Daily SD Levels - Indicator
"Daily SD Levels - Indicator" logo
06/08/2025
2
Desktop
Since 16/07/2025
Sales
2
"Daily SD Levels - Indicator" uploaded image"Daily SD Levels - Indicator" uploaded image"Daily SD Levels - Indicator" uploaded image"Daily SD Levels - Indicator" uploaded image

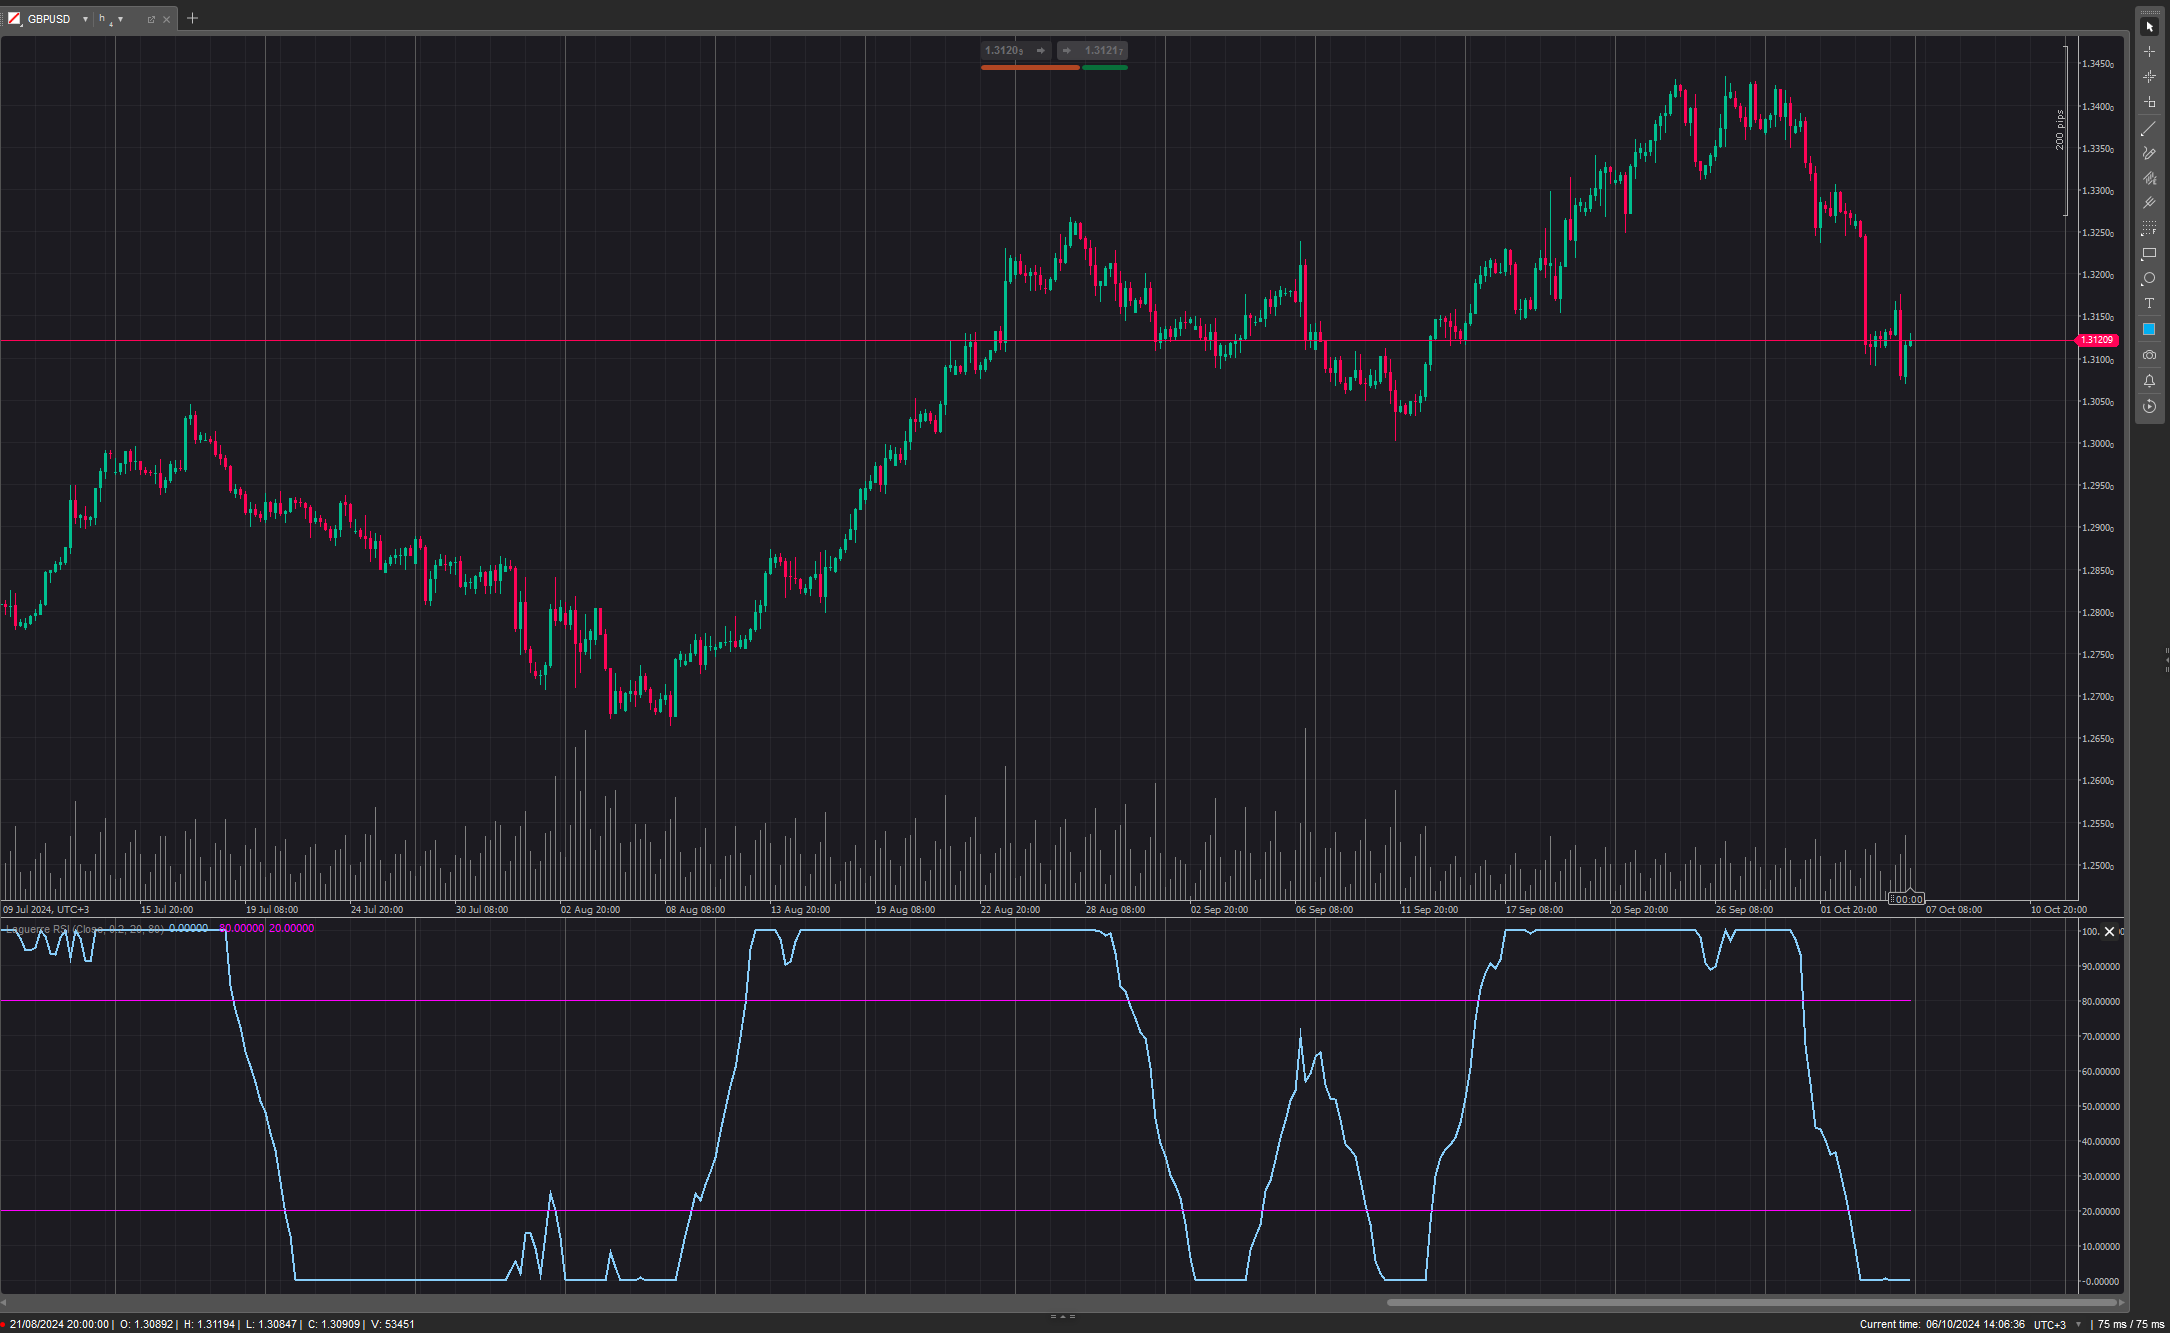
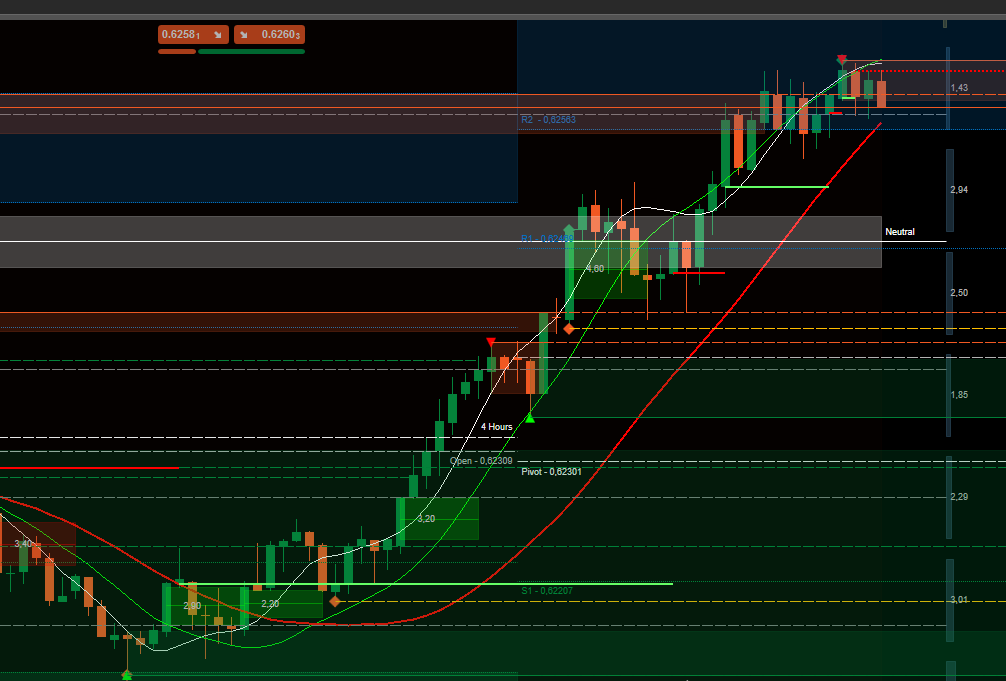
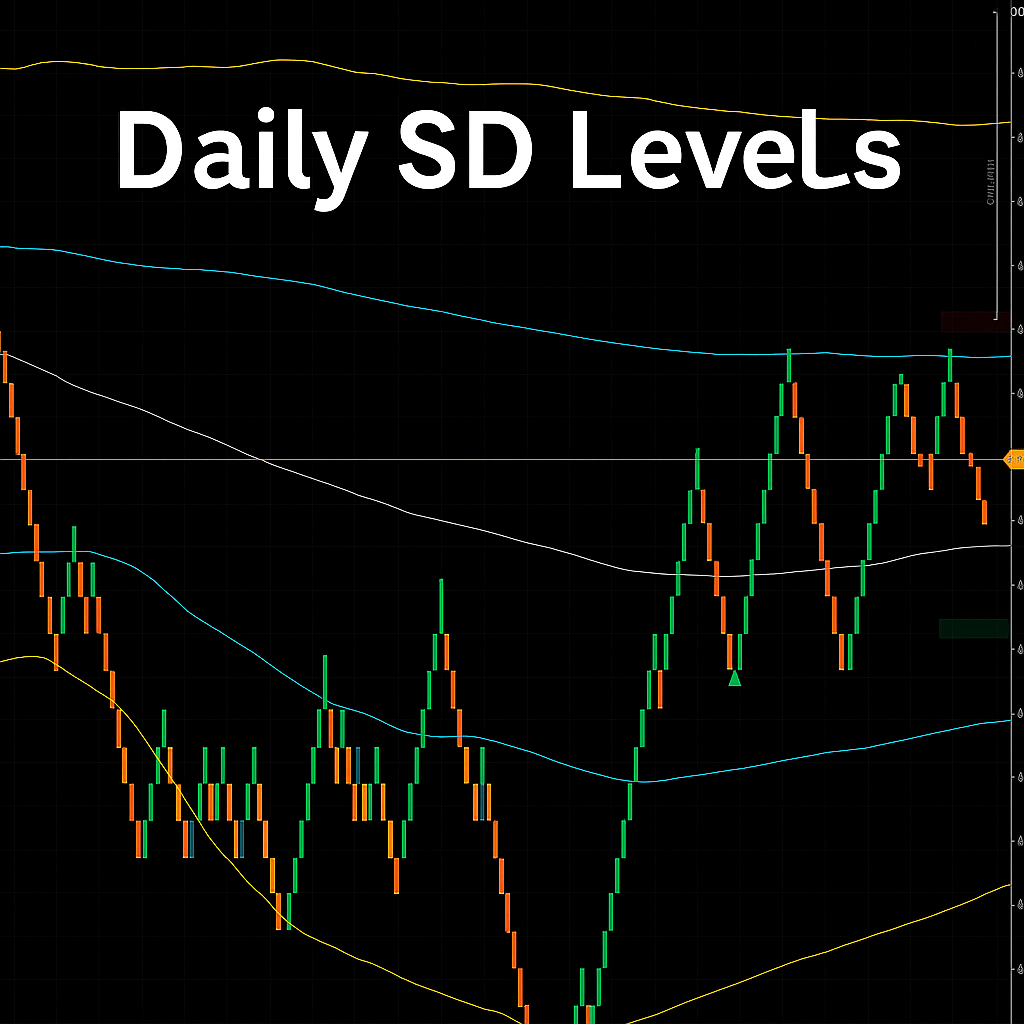
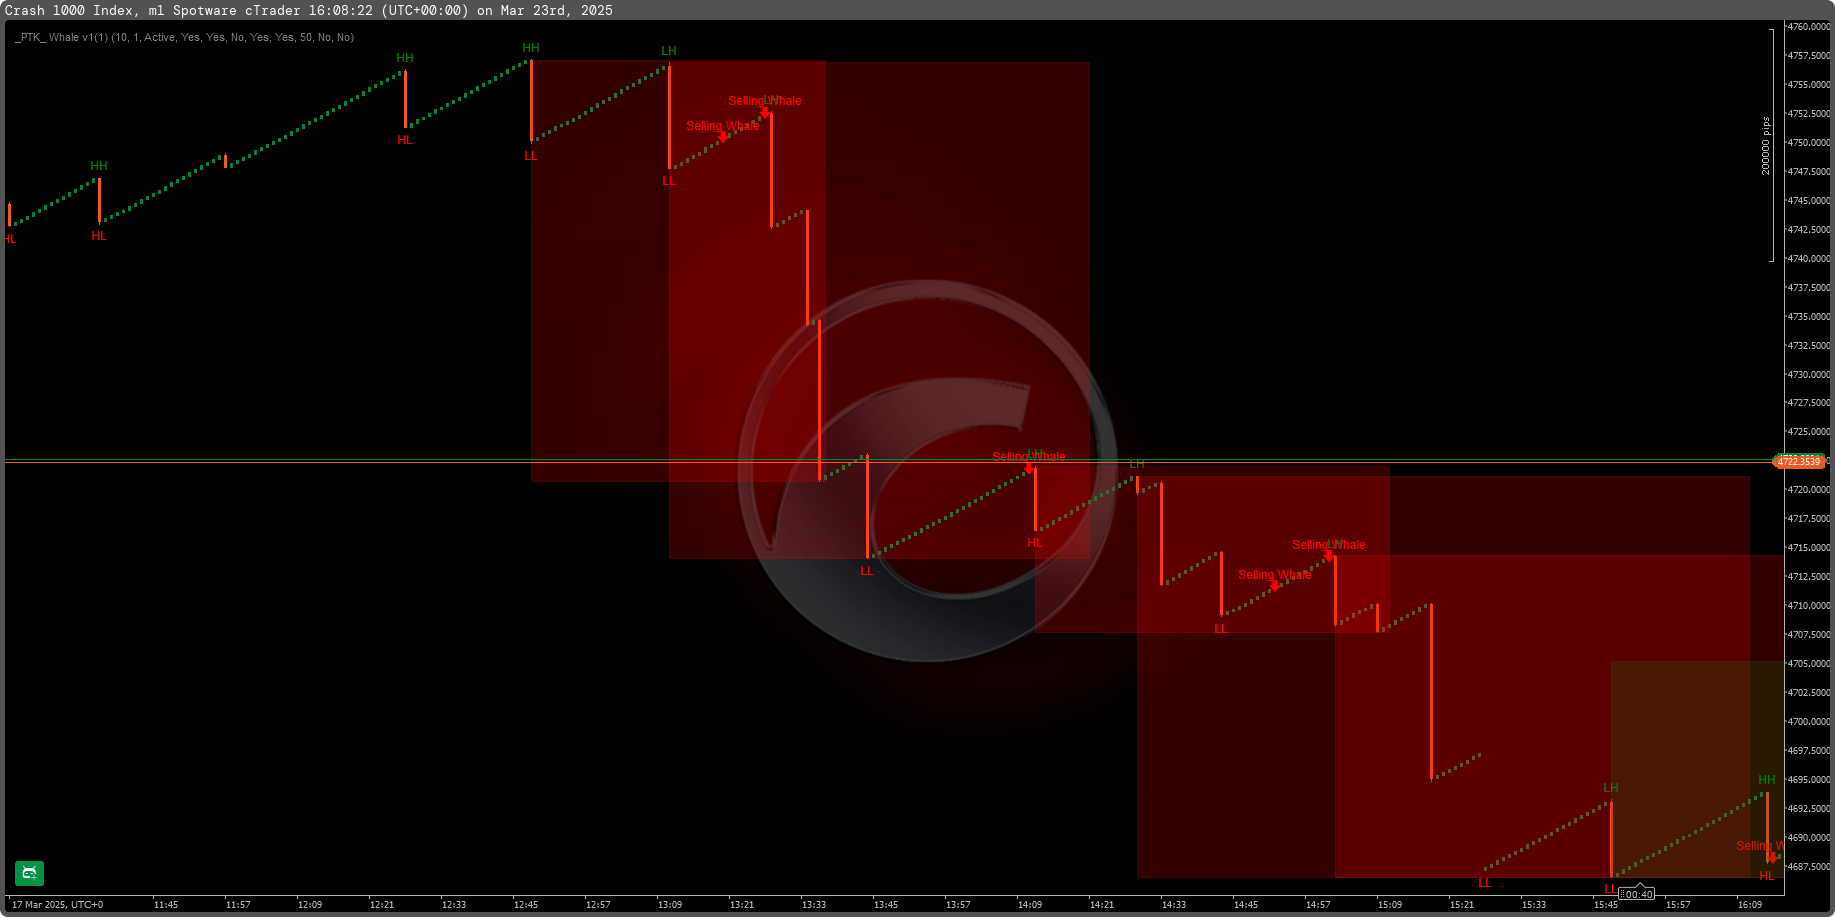
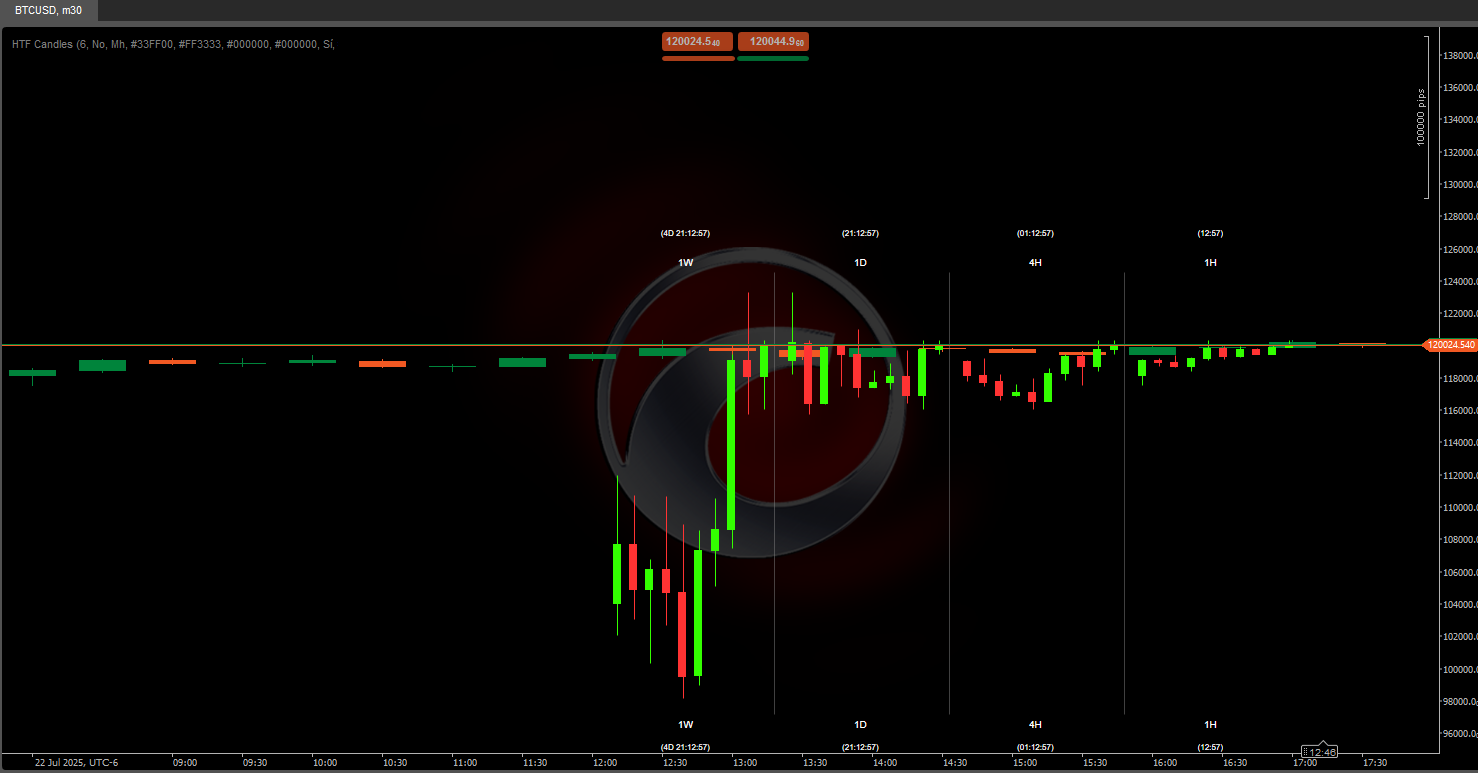
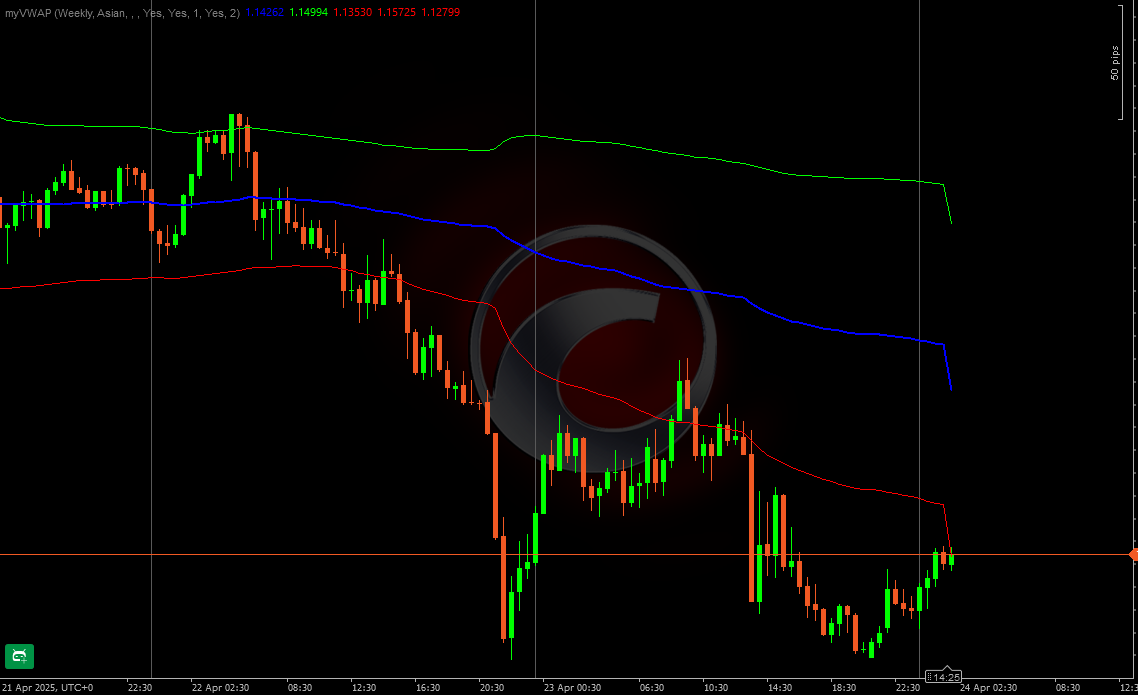
Daily SD Levels – Dynamic VWAP-Based Standard Deviation Bands

The Daily SD Levels indicator plots dynamic VWAP (Volume-Weighted Average Price) and Standard Deviation Bands (+1/+2 and -1/-2) calculated over the current trading day.

This tool helps traders visually assess intraday volatility, potential support/resistance zones, and price extremes, all based on actual market volume and price action – not fixed or arbitrary levels.


Key Features:

  • VWAP Line for intraday fair value tracking.
  • +1/+2 and -1/-2 SD Bands to identify overbought/oversold zones.
  • Levels reset daily, adapting to each session’s price and volume dynamics.
  • Optimized for Renko, Range Bar, and Intraday Trading.
  • Built for traders who need clarity and dynamic price zones.

This indicator is perfect for:

  • Mean reversion setups.
  • Identifying stretched moves for possible reversals.
  • Visual confirmation of breakouts beyond statistical boundaries.

No clutter. Just clean, responsive levels that move with the market.

0.0
Reviews: 0
Customer reviews
No reviews for this product yet. Already tried it? Be the first to tell others!
More from this author
JMA-Like
JMA-like is a highly responsive and ultra-smooth moving average designed to replicate the behavior of the original JMA!
You may also like
Indicator
Indices
RSI
XAUUSD
+7
RSI Divergence
Detects bullish and bearish divergences
Multi_TF Candlestick Chart Overlay
Perfect for traders who demand a clear overview of multiple timeframes at a glance.
Indicator
Indices
Signal
Whale Hunting For boom crash
The **Whale Hunting Indicator** is a trading tool for **Boom & Crash and Volatility indices**, featuring **Auto Trend De
VegaXLR - Candlestick Patterns Alerts
Real-Time Candlestick Pattern Detection with Custom Alerts & Trend Analysis for cTrader
HTF Candles
🌟 HTF indicator for cTrader! Real-time higher timeframe candles (1W-1H) on your chart.
Indicator
Indices
Prop
Stocks
+3
[Hamster-Coder] Price
Indicator designed to calculate and manipulate price inputs (sources) in real time
xhobaniFX_Anchored VWAP
xhobaniFX_Anchored VWAP: Volume Weighted Average
Indicator
XAUUSD
Commodities
ATR
+1
[Stellar Strategies] Visual Trend Momentum
Visual Trend Momentum is a MA/ATR/Volume trend tool. Visual signals for strong trends & reversals. Customizable. 📈📉
Top-rated
"STC" logo
5.0
(2)
Free
STC
Schaff Trend Cycle (STC) Indicator
Indicator
Indices
RSI
Signal
+1
[Stellar Strategies] QQE
The QQE indicator is a technical analysis tool designed to identify potential trend changes and trading signals 📈📉
Laguerre RSI
Laguerre RSI is based on John EHLERS' Laguerre Filter to avoid the noise of RSI.
Indicator
Indices
Stocks
Commodities
+2
SymbolTFOverlay
The SymbolTFOverlay display the current symbol and timeframe as a semi-transparent text overlay on the chart.
MultiTimeFrameTrend
A compact, visual multi-timeframe trend indicator for cTrader. Easily spot bullish or bearish trends across 4 customizab
Indicator
NAS100
NZDUSD
Martingale
+22
Candle Timer
Candle Timer best used for Scalper
rvwap v1
Rolling VWAP with dynamic or fixed time window, customizable source price and standard deviation bands.
Order Block Finder
Order Block Detector is built to spot and display Order Blocks on chart, often triggering strong price reactions.
Indicator
Grid
NAS100
NZDUSD
+15
TS_Pivot
Those who are involved in trading know how important it is to take into account the previous session. With Order Block
IR VLine
don't move to the end of chart after timeframe changing. it should be better to use for near history. for long history