Indicator
Breakout
ATR
LT_SmartSwings
"LT_SmartSwings" logo
03/09/2025
4
Desktop
Since 25/09/2024
Sales
14
"LT_SmartSwings" uploaded image"LT_SmartSwings" uploaded image"LT_SmartSwings" uploaded image"LT_SmartSwings" uploaded image"LT_SmartSwings" uploaded image"LT_SmartSwings" uploaded image"LT_SmartSwings" uploaded image"LT_SmartSwings" uploaded image"LT_SmartSwings" uploaded image"LT_SmartSwings" uploaded image

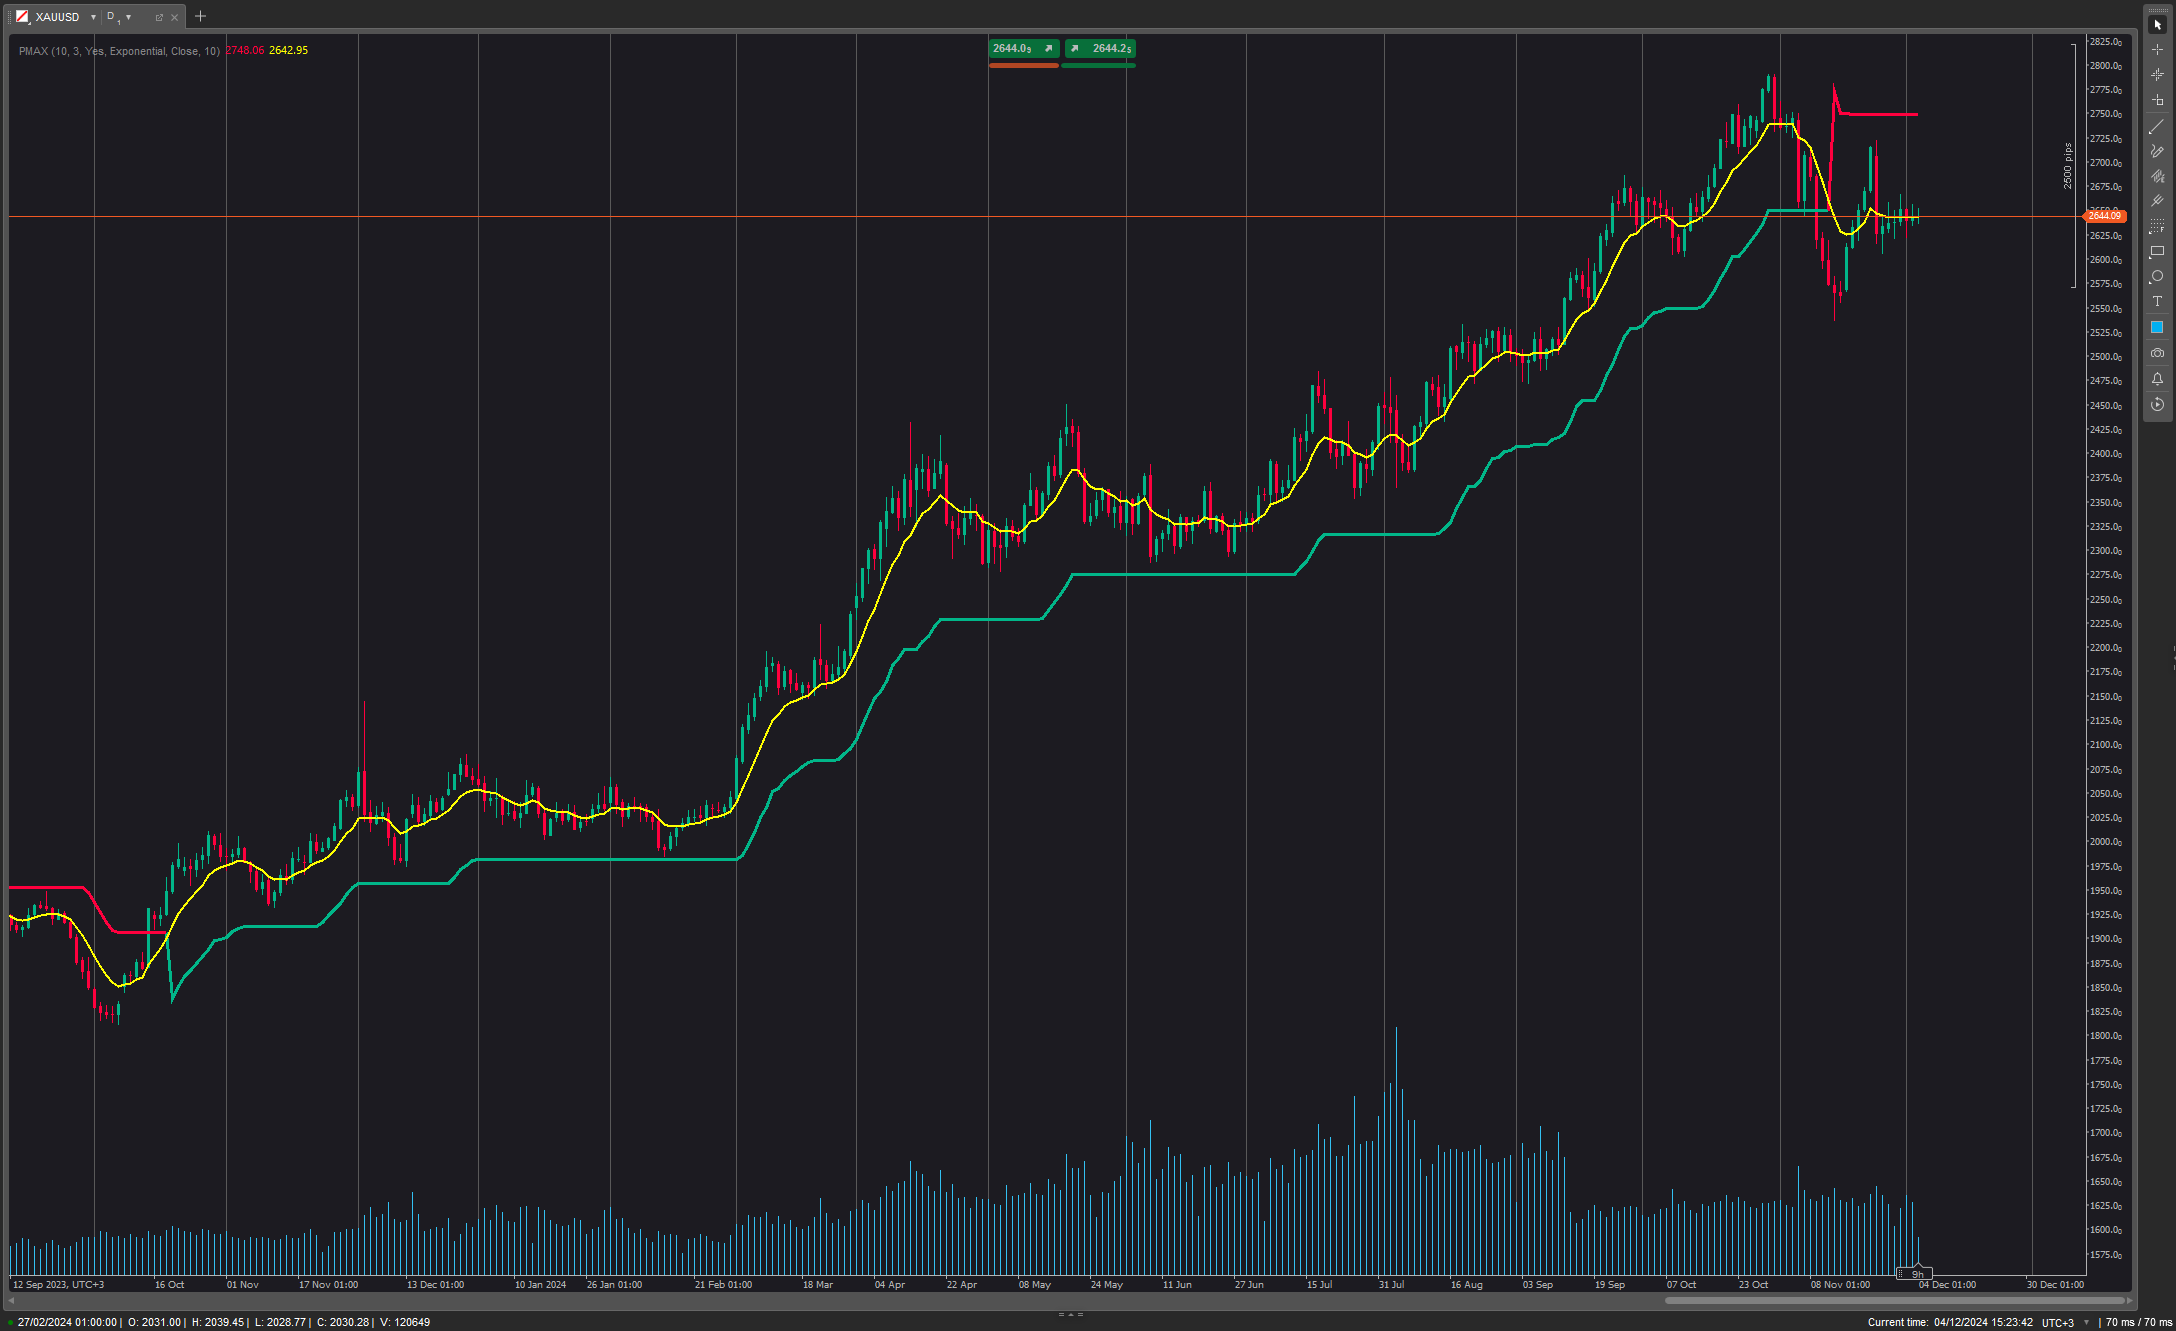
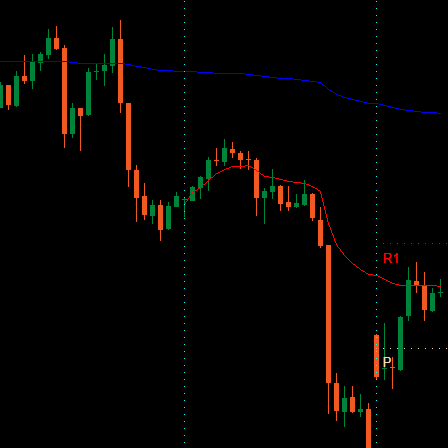
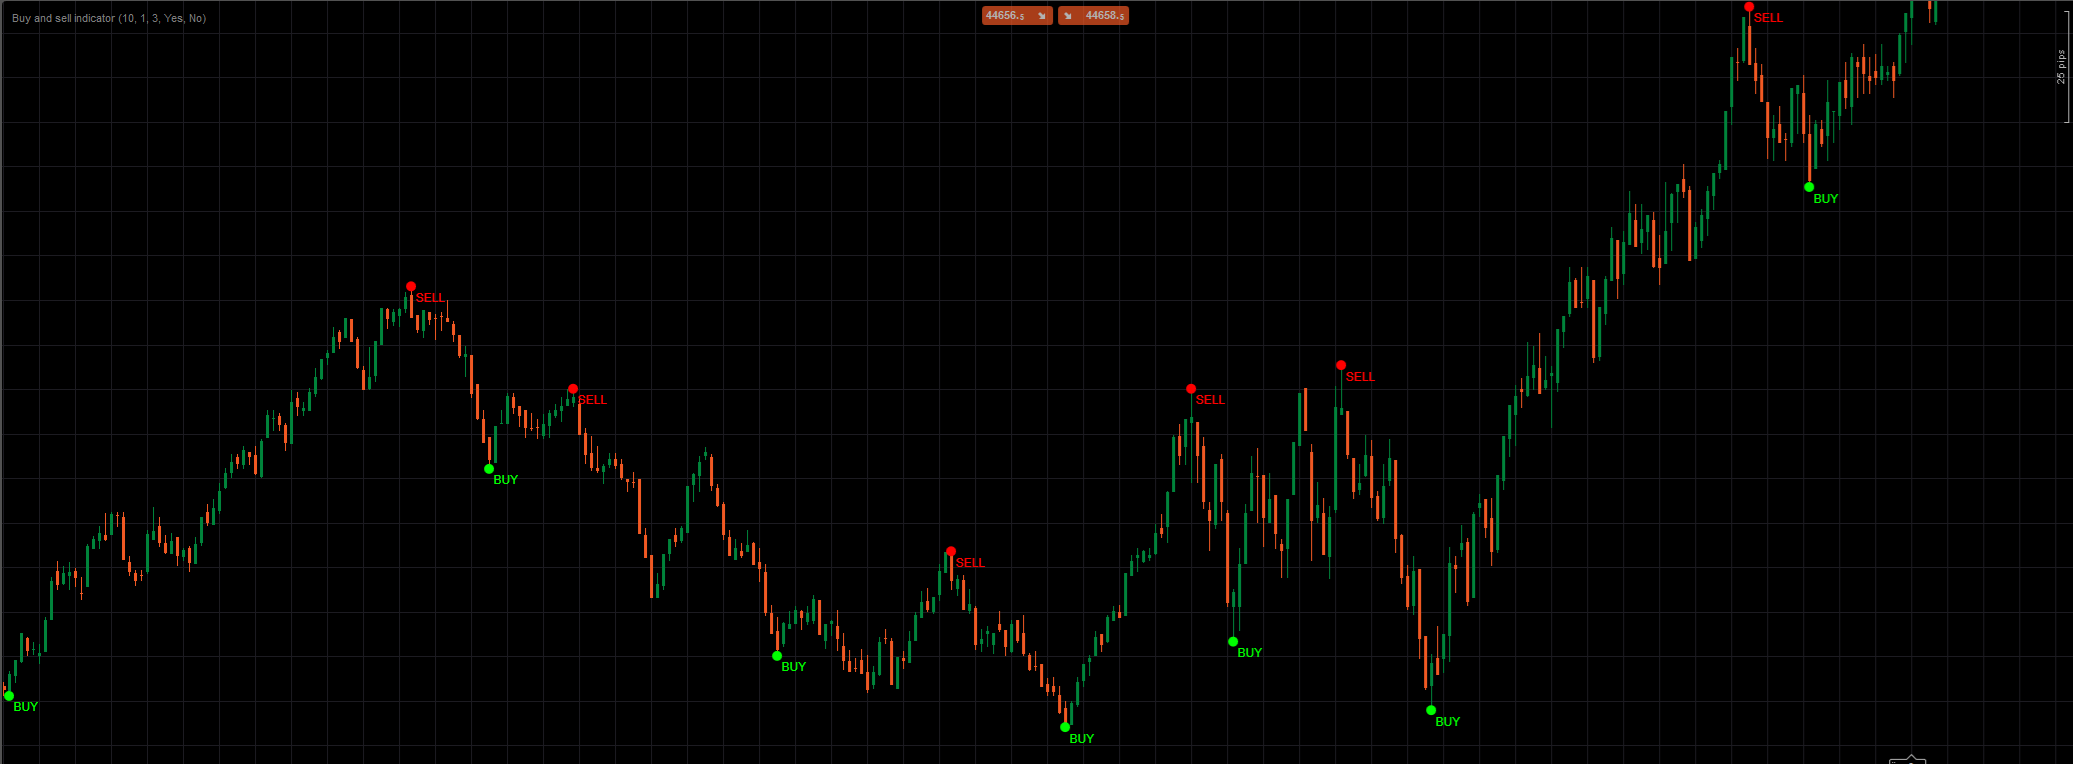
LT_SmartSwings is a powerful swing-based market structure indicator designed to help traders visualize key turning points, market moves, and breakout events with clarity and flexibility. Built for precision and adaptability, this tool is ideal for traders who rely on swing logic, Fibonacci confluence, and breakout analysis.

Core Features:

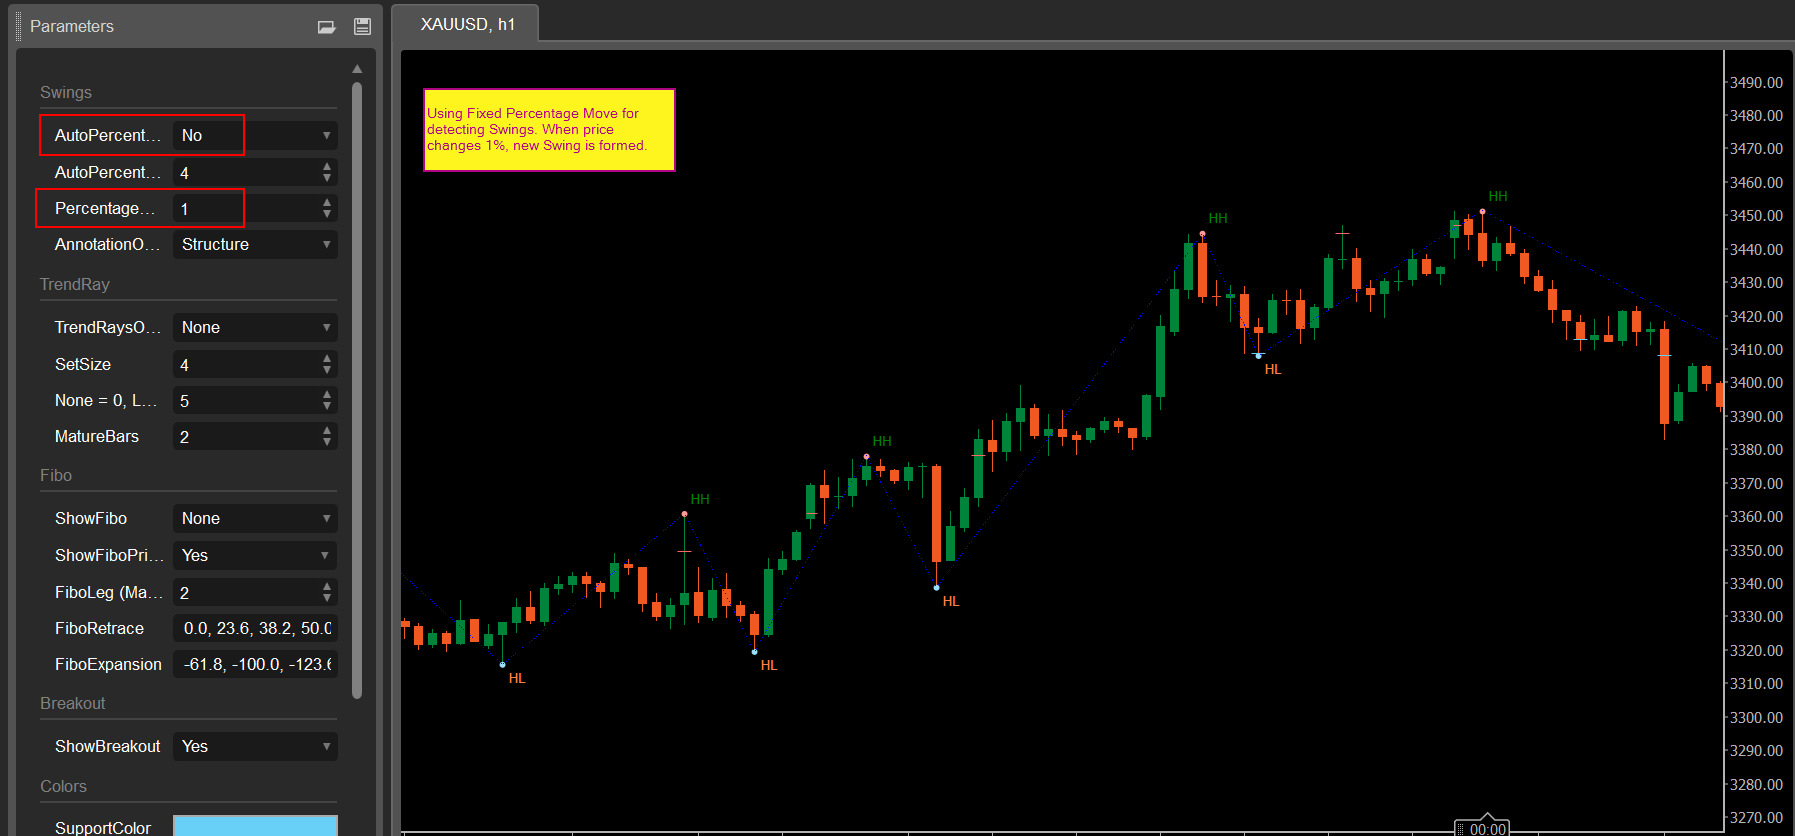
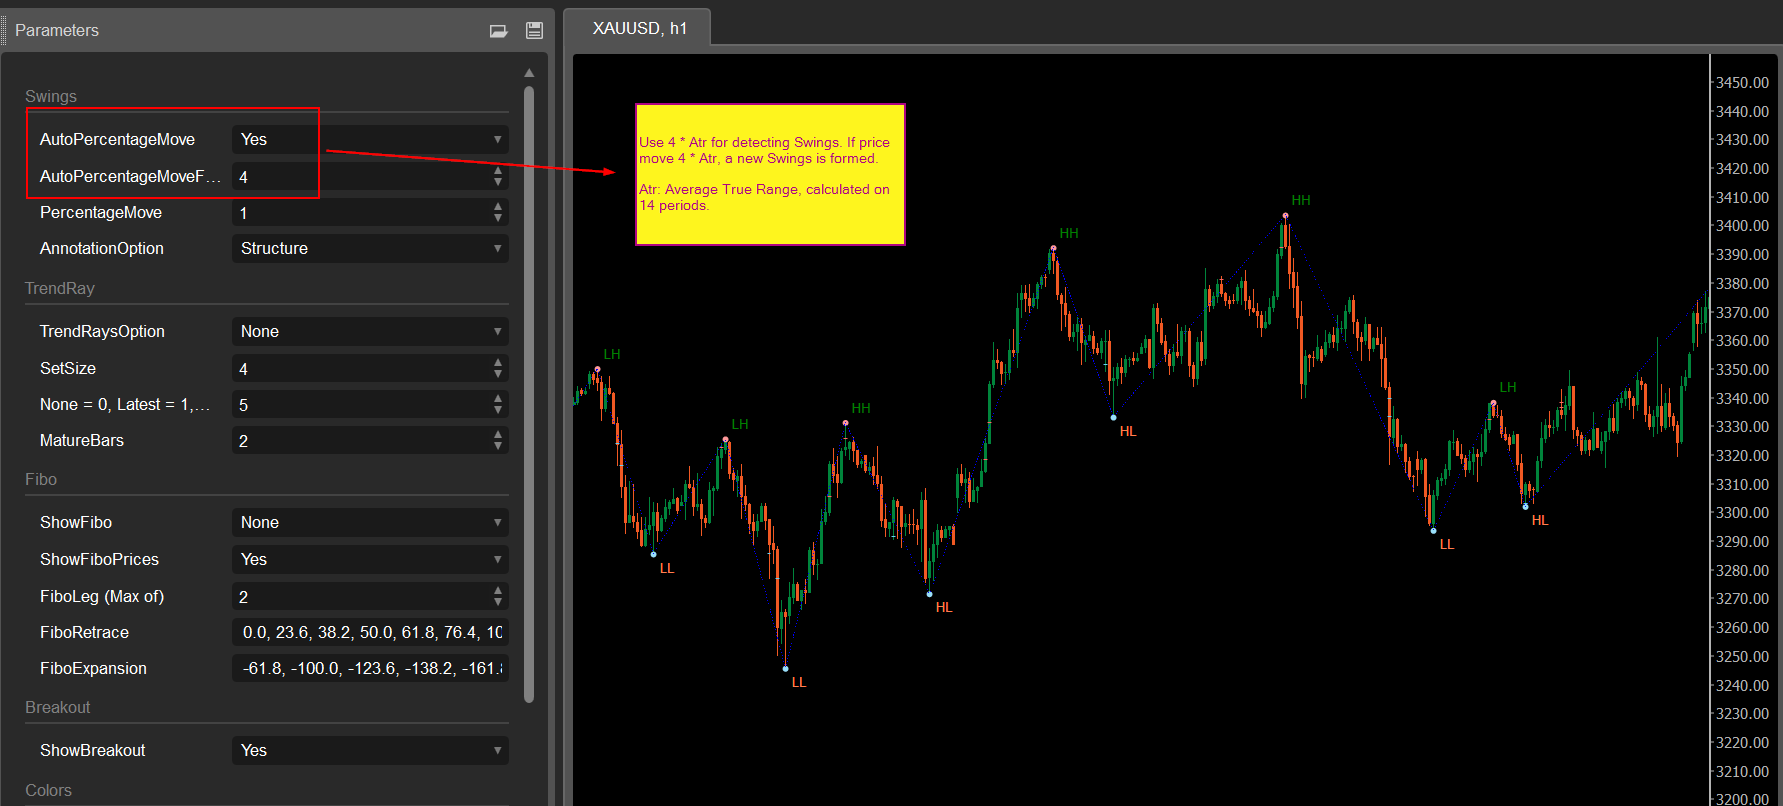
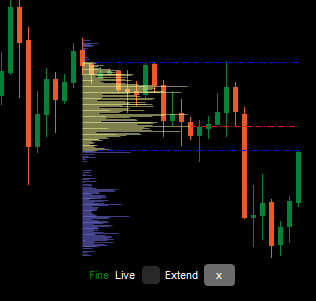
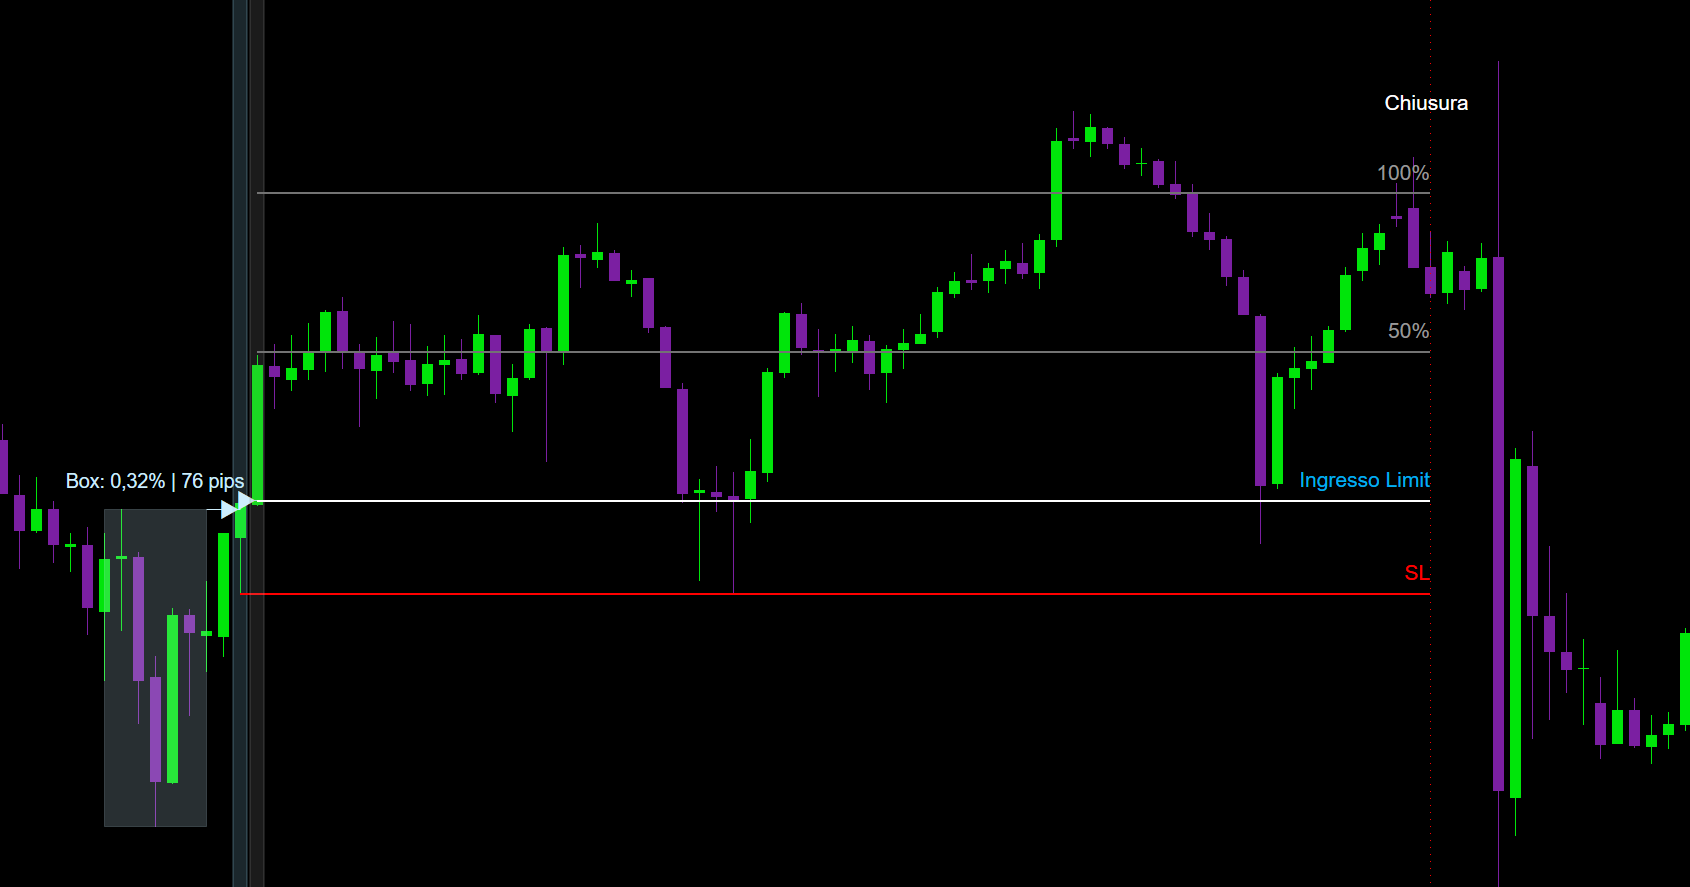
  • Swing High/Low Detection based on price movement percentage
  • Auto or Manual Threshold: Use fixed % or auto mode (based on ATR x factor)
  • ZigZag Line connecting key swings
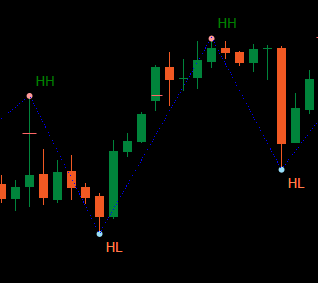
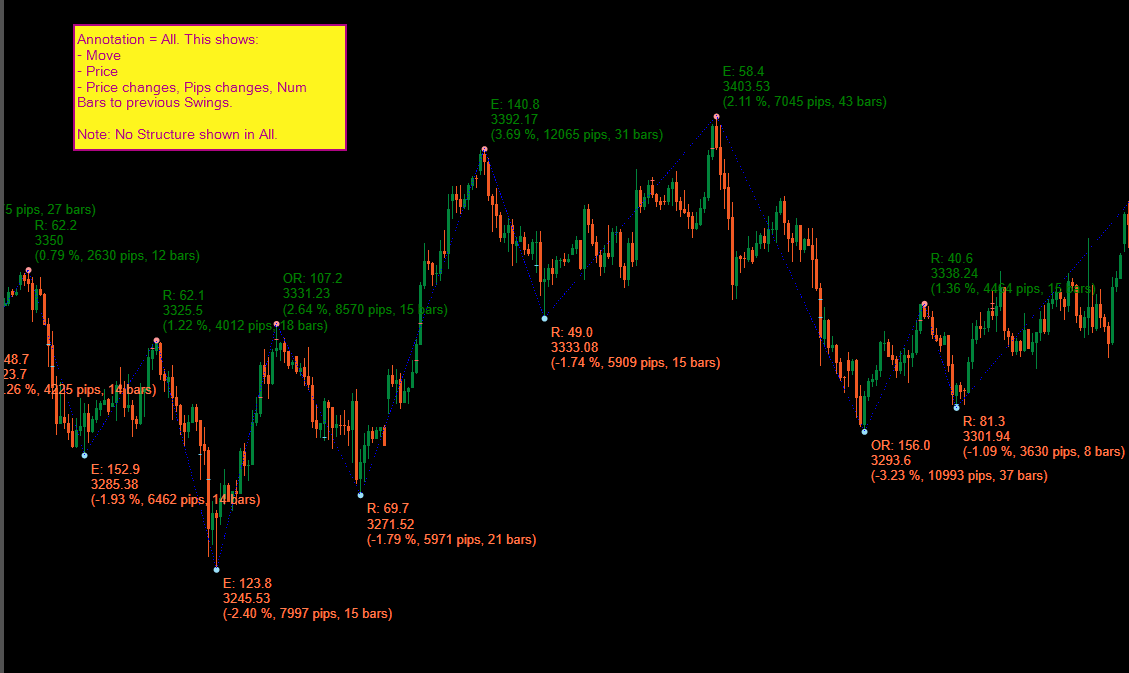
  • Detailed Annotations with 5 modes:
    • Structure: HH, HL, LH, LL
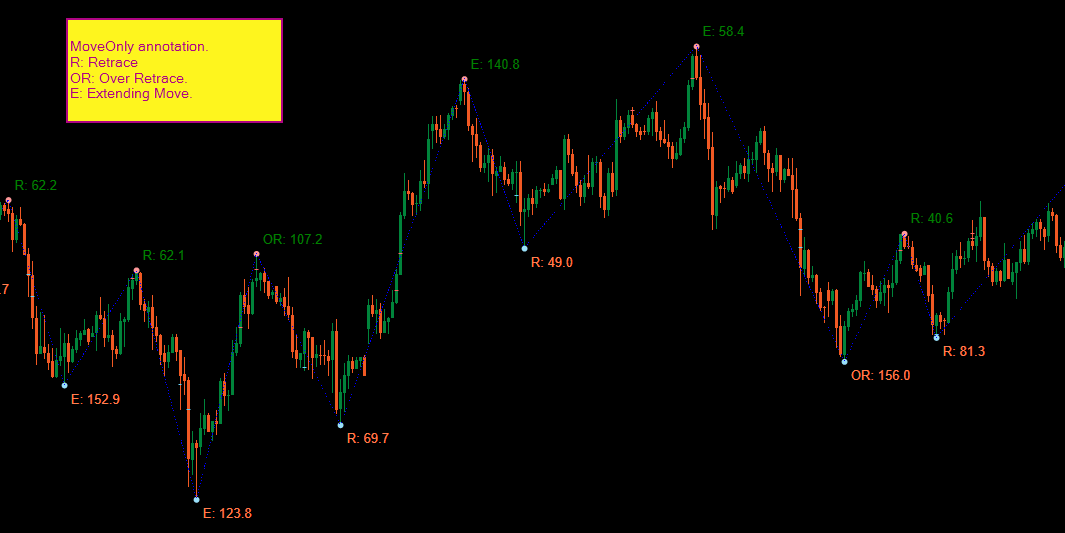
    • MoveOnly: Retrace (R) and Extension (E) percentages
    • PriceOnly
    • MoveNPrice
    • All: move %, pips, bars, price, move type
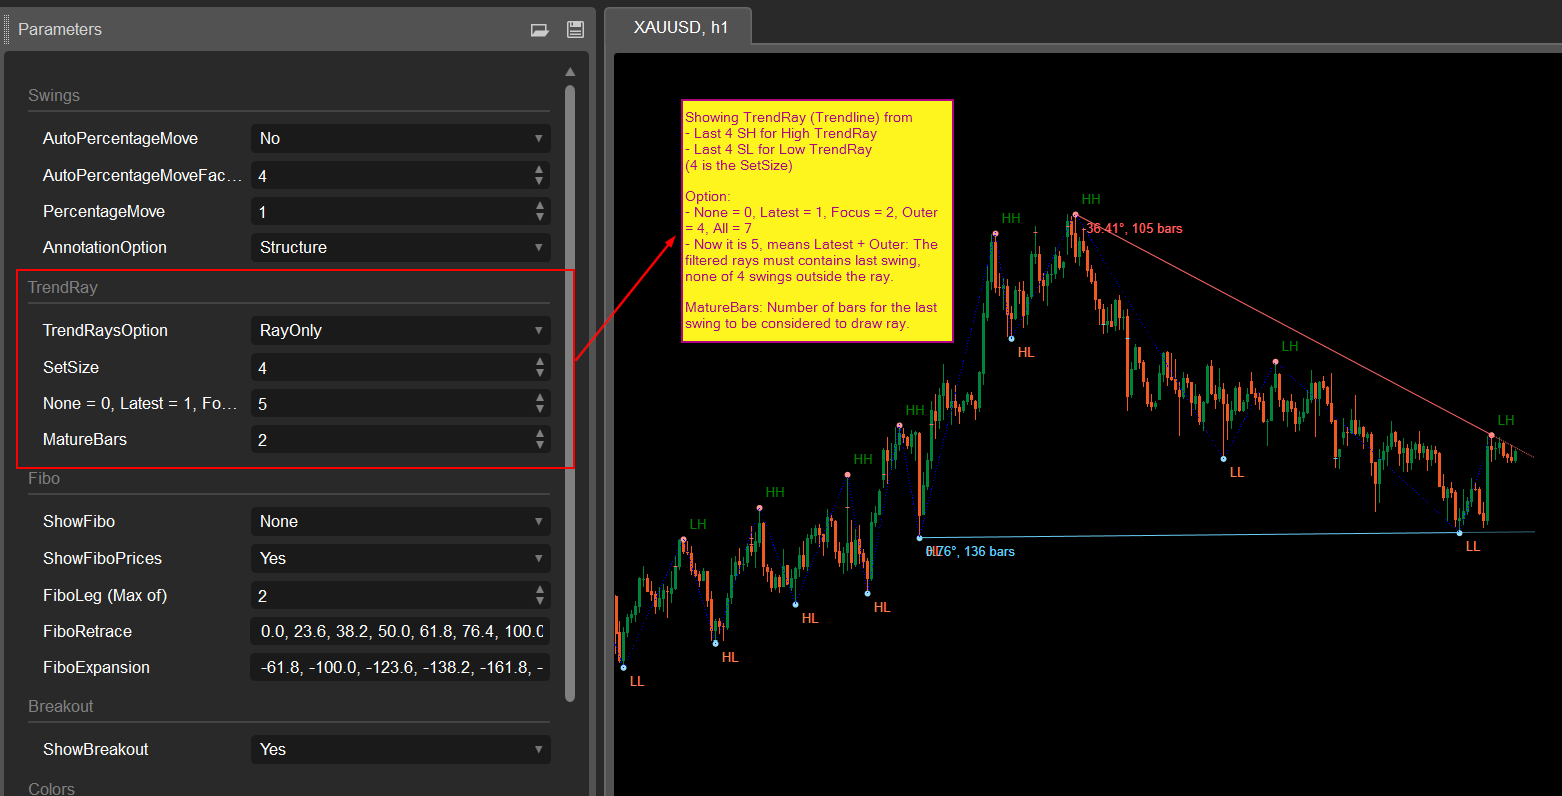
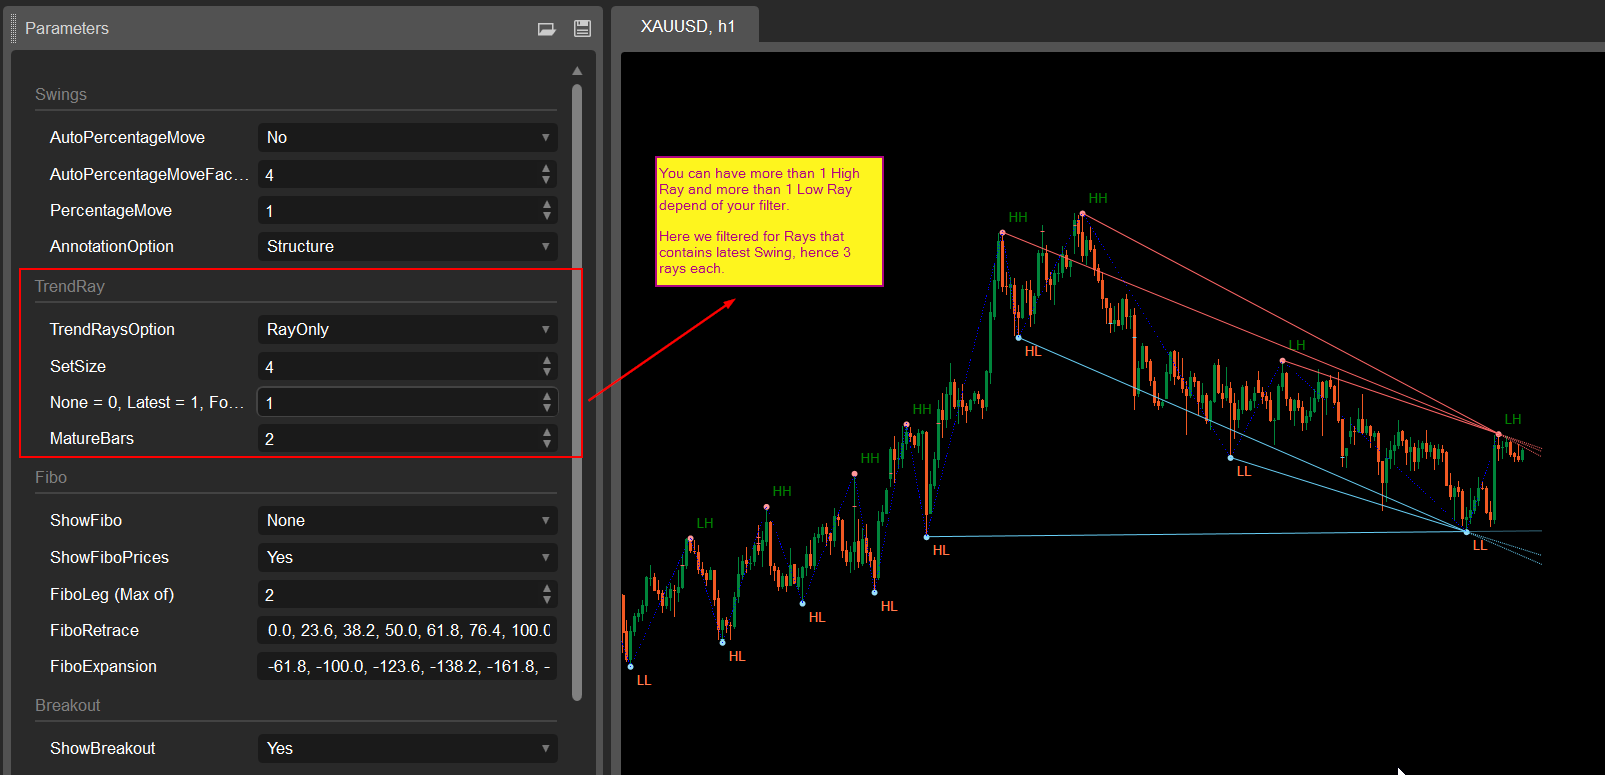
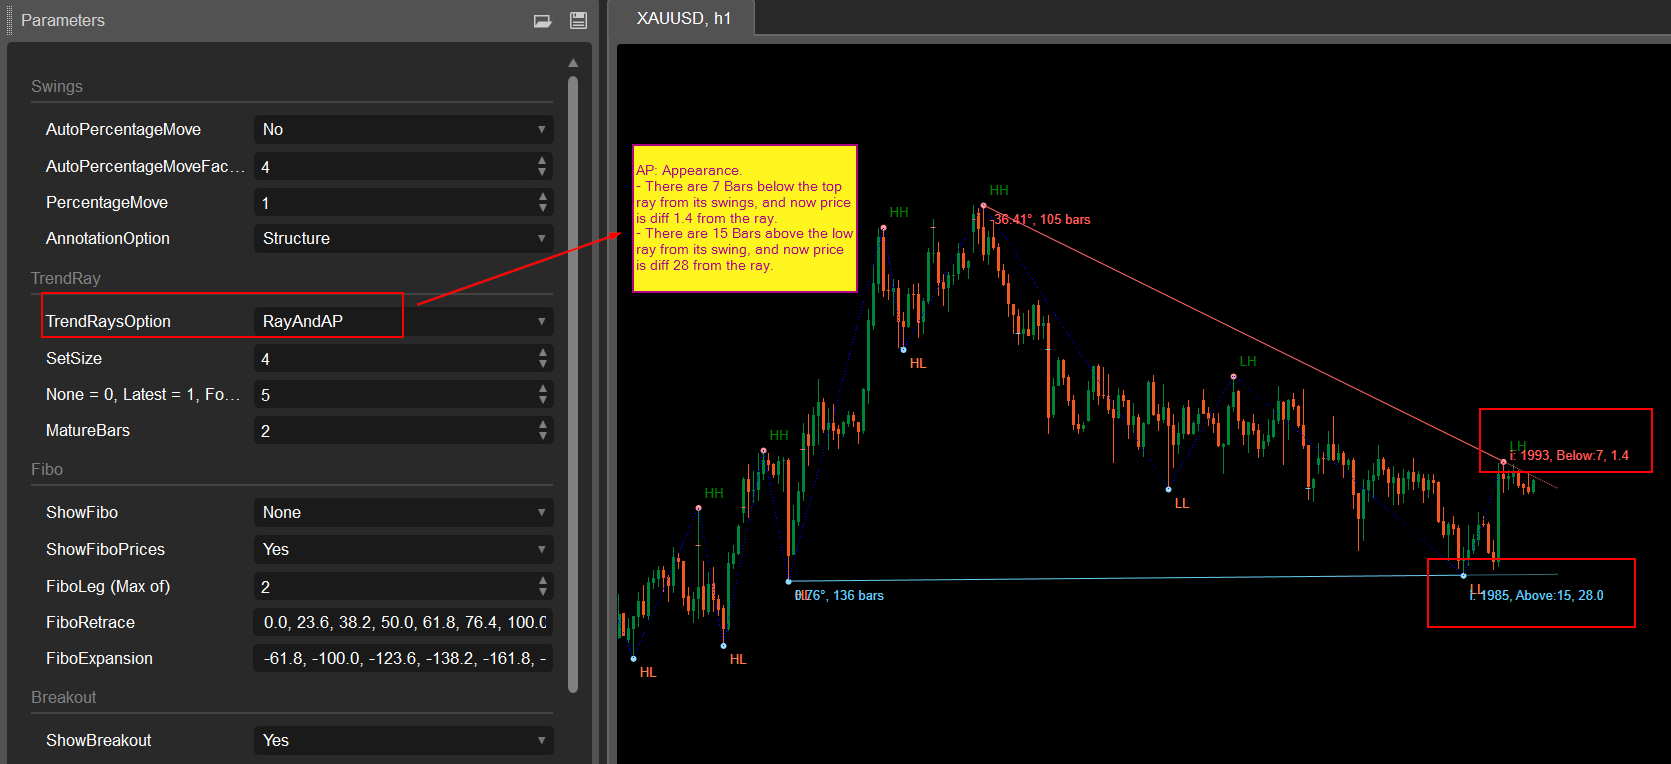
  • Trend Ray Projection (with multiple filtering options):
    • Draws rays from recent swings using smart constraints
    • Options: Latest, Focus (slope), Outer, or All
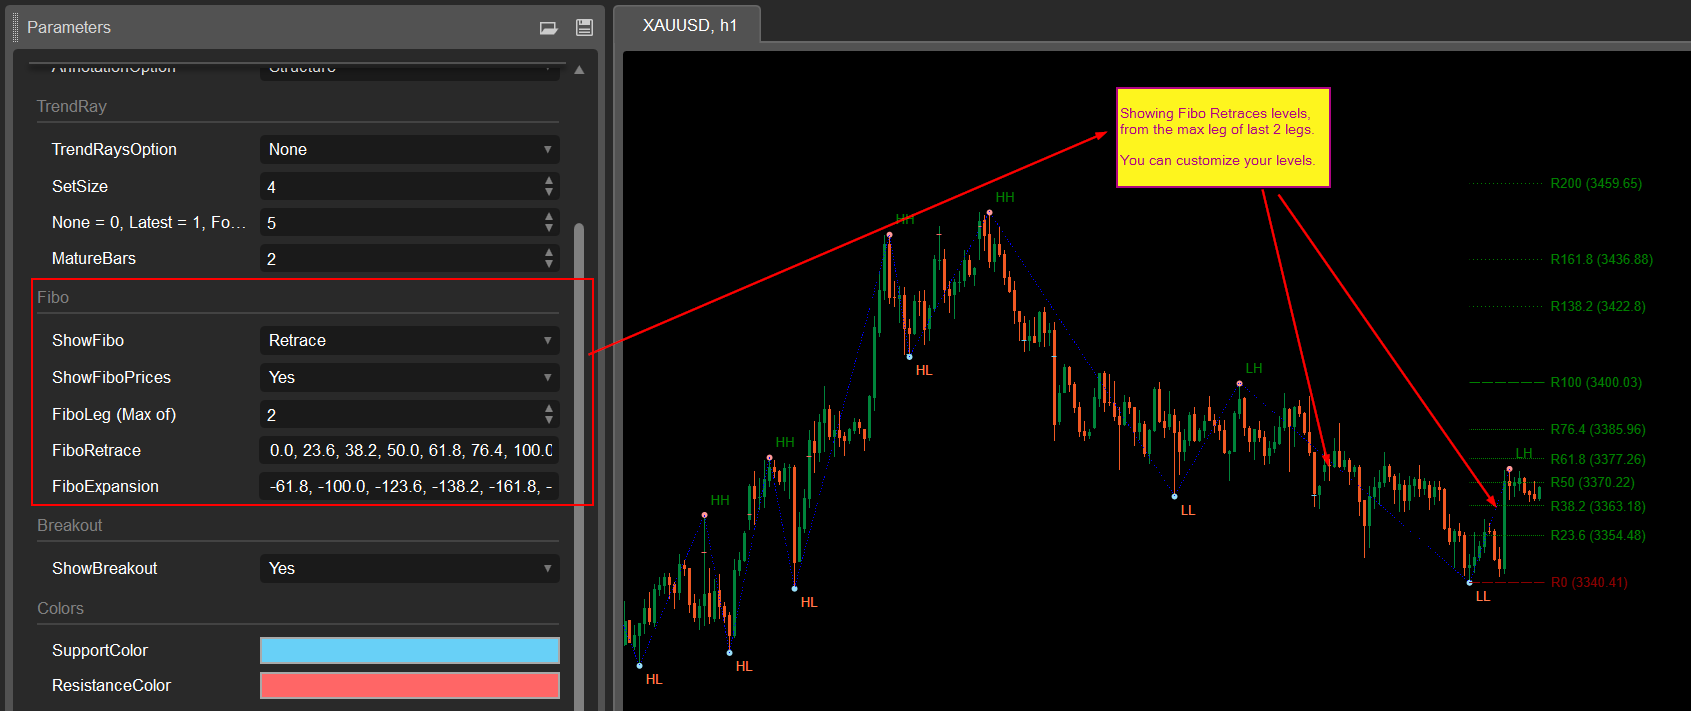
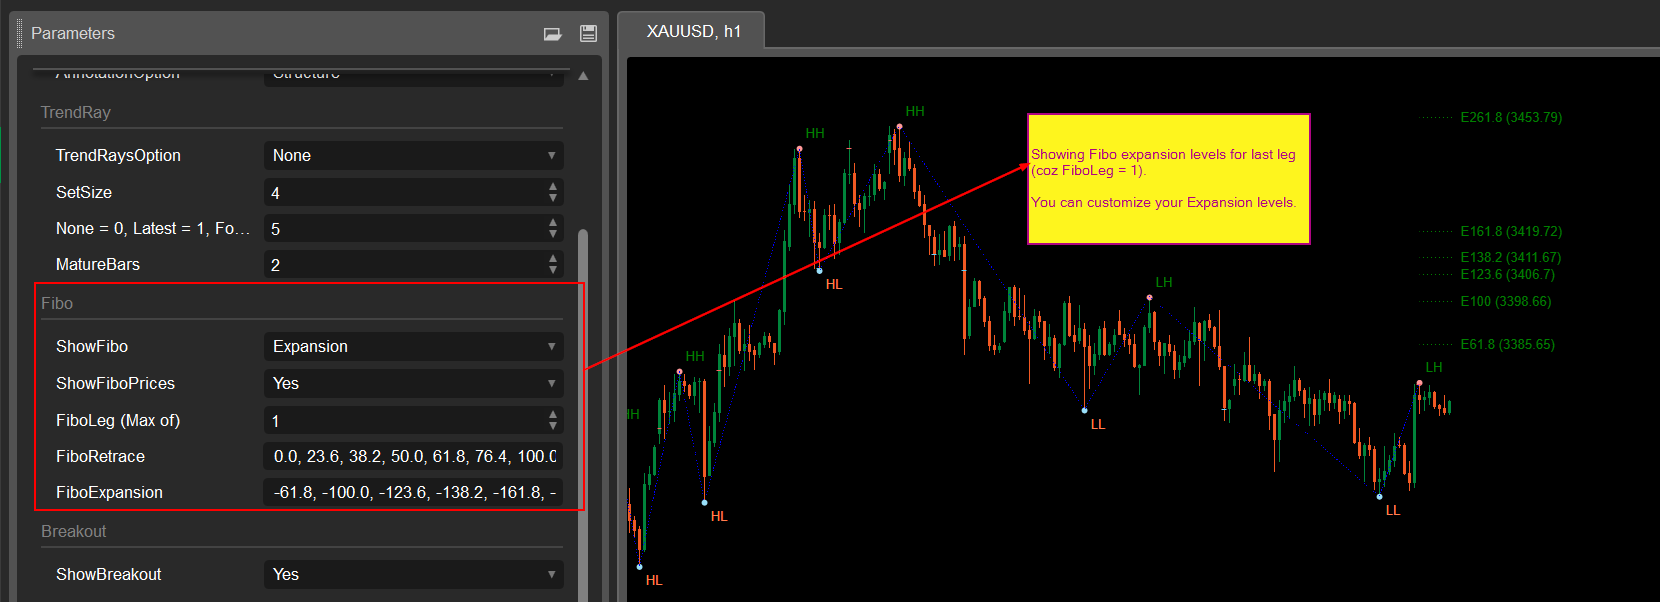
  • Automatic Fibonacci Levels:
    • Draws Retracement or Expansion levels based on recent moves
    • User-configurable level sets
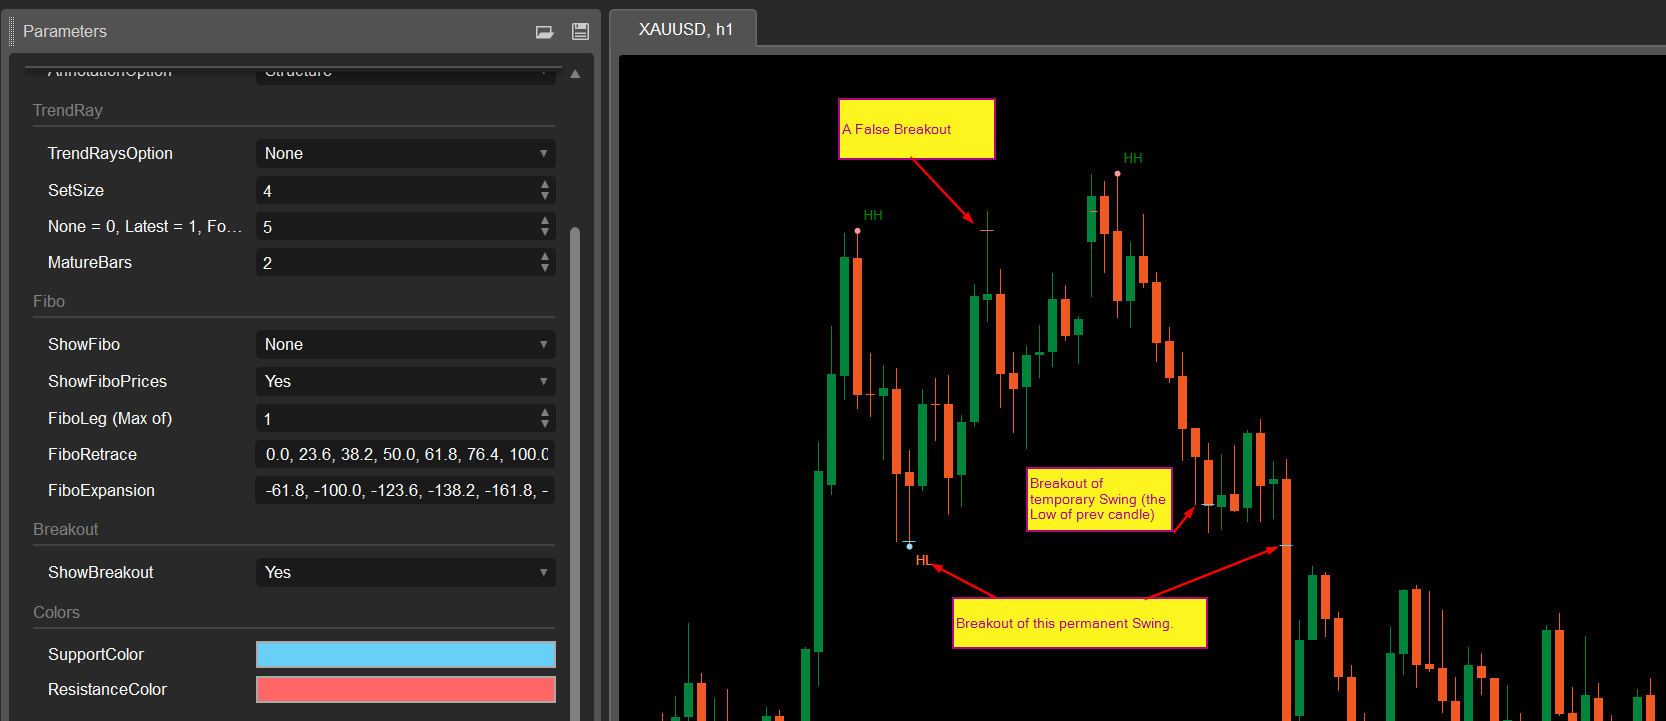
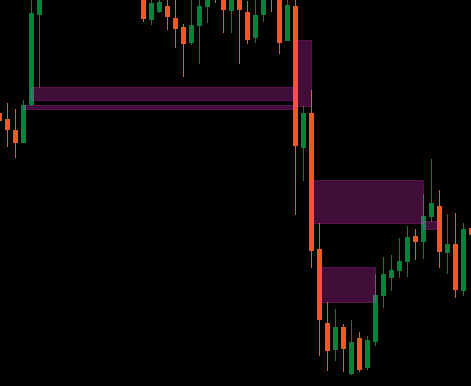
  • Breakout Marking:
    • Detects breakout of swing points (both confirmed and false breakouts)
    • Persistent display for historical reference
  • Color Customization for support/resistance lines

Use Cases:

  • Identify support/resistance dynamically
  • Understand swing structure and transitions
  • Spot trend continuation or reversal using Fibs
  • Visualize breakout points for trade planning
  • Combine with your existing systems or discretionary strategy

Recommended Use:

  • Attach to your working timeframe (e.g., M30, H1)
  • Best suited for manual traders, structure analysts, and confirmation-based strategies


Launch Offer: Available now for only $15!

0.0
Reviews: 0
Customer reviews
No reviews for this product yet. Already tried it? Be the first to tell others!
More from this author
Indicator
Indices
Commodities
ATR
+4
LT_Ind_Candles
Most used candle patterns. (1 candle, 2 candles and 3 candles patterns) and Marubozu. Bonus Fibo Risk control.
LT Flexible Volume Profile
Flexible Volume Profile, designed with performance in mind.
cBot
ATR
LT_RiskGuardian
Auto-manages SL, TP, and position size to enforce risk discipline. Never enter a trade without a plan again.
LT_FairValueGap
Detects valid Fair Value Gaps from strong 3-bar patterns. Keep drawing unfilled gaps until price fills them.
Indicator
Indices
Prop
Commodities
+3
LT_Ind_TradeNet
Personal trade tracker for a single symbol. Clear net profit summary — FreshNet, ManageNet, DayNet, WTDNet, MTDNet.
Indicator
VWAP
Indices
Prop
+4
LT_Ind_VWAP
Multi-anchor VWAP indicator for cTrader. Plots two VWAP lines (red and blue) with selectable anchors.
Indicator
Indices
Prop
Commodities
+3
LT_Ind_Pivot
Draws pivots (P, S/R, CPR) from selected anchors like H1–Month1, with optional mid-levels (PS1, S1S2, etc.)
Indicator
Indices
Prop
Stocks
+3
LT_Ind_SRZones
Automatic Support/Resistance zones from swing points.
You may also like
Indicator
Indices
Prop
Stocks
+3
[Hamster-Coder] Price
Indicator designed to calculate and manipulate price inputs (sources) in real time
Buy and sell indicator
Buy and Sell Signals
Indicator
Stocks
Forex
MACD
+1
SmartBot-Volume MACD
a revolutionary indicator that integrates volume into MACD.
Indicator
NAS100
RSI
NZDUSD
+16
AlphaTrend Pro Max
Turn data into precision trades with AlphaTrend Pro Max — advanced trend, signal & structure analysis in one.
Indicator
Indices
RSI
Forex
+3
ScalpingSignals9000
High-probability trading signals in the fast-paced world of forex and CFD trading.
Indicator
Indices
Stocks
Commodities
+2
SymbolTFOverlay
The SymbolTFOverlay display the current symbol and timeframe as a semi-transparent text overlay on the chart.
Supply Demand - BasicV1
Supply and demand zones. They're important. Here's a free version to get you started!
IVB 2.0
IVB 2.0 is an indicator that works on the strategy of imbalance of the maximum volatility box of indices
Indicator
Breakout
ORB v1.1
Opening Range Breakout v1.1 - Visuals + Stats
MA Sabres
Conquer the markets with MA Sabres! This indicator spots trend flips with MAs and cool Sabre shapes & alerts.
Indicator
RSI
Breakout
Supertrend
+1
Reactive Moving Average
Combines SMA with dynamic correlation to adapt to market trends. Adjusts sensitivity, filters noise🚀📉
Indicator
RSI
Signal
MACD
[Stellar Strategies] Moving Averages Combined 1.0
Smooths price action with 6 MAs (3 SMA, 3 EMA). Reduces noise, clarifies trends 📈📉
Top-rated
Free
Indicator
ATR
Supertrend
PMAX
It's a combination of two trailing stop loss and the other one is well-known ATR-based SuperTrend.
Indicator
RSI
XAUUSD
Breakout
+5
Dynamic Range MomentumI
This histogram helps visualize the strength and direction of market movements, making it easier to spot potential trends
Indicator
NAS100
NZDUSD
XAUUSD
+14
Elliott Wave Fib Auto
🚀 Automated Elliott Wave & Fibonacci tool for cTrader. Spot trends, corrections & retracements fast.
Indicator
NAS100
NZDUSD
XAUUSD
+11
FBX VWAP
FBX VWAP Anchored — Professional VWAP
Golden Boom And Crash Spike Detector
Golden Boom and Crash Spike Detector is a trading tool designed for Crash 300 and Boom 300 indices on M1 Timeframe.