Pinescriptlabs Store indicators: Pinescriptlabs Store cBots : (cBot) Gold & BTC BreakoutSession Pivots(new)
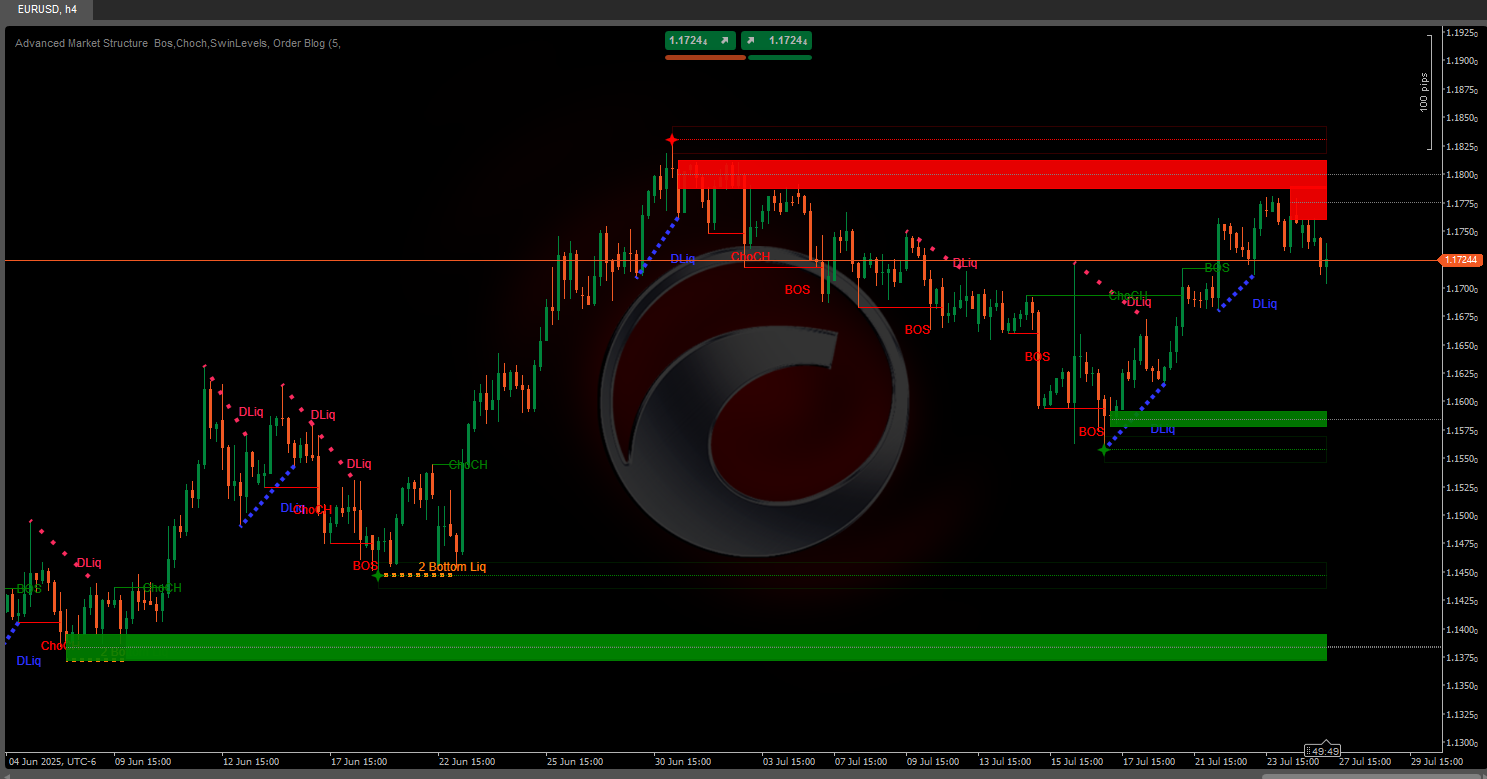
Advanced Market Structure: Bos, Choch, SwinLevels, Order Blocks, Market Structure & Liquidity Finder (New)
ZigZag Price Liquidity Projection
Trailing Smart Algorithm (new)
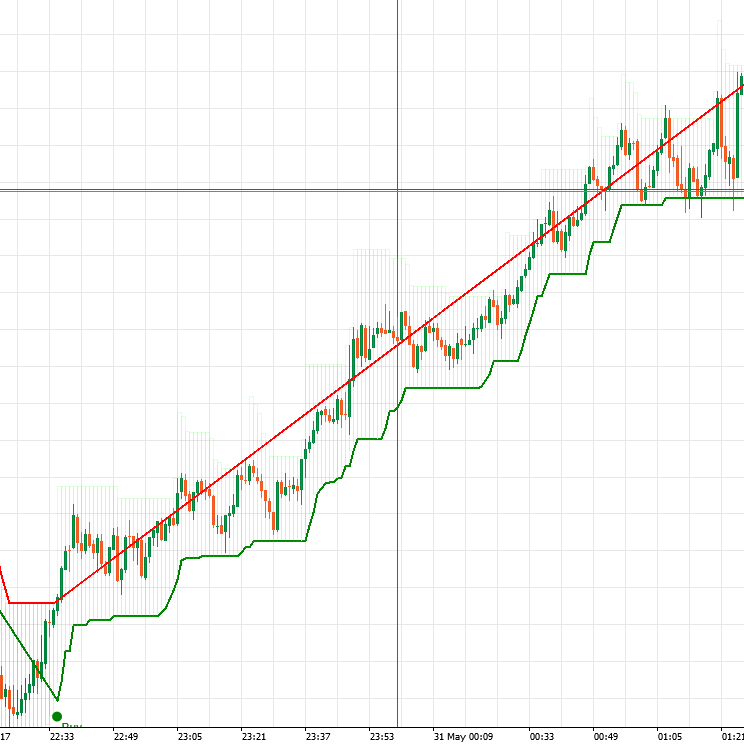
Prediction Based on Linreg & ATR
SmartTrend Support &
Resistance
Lines
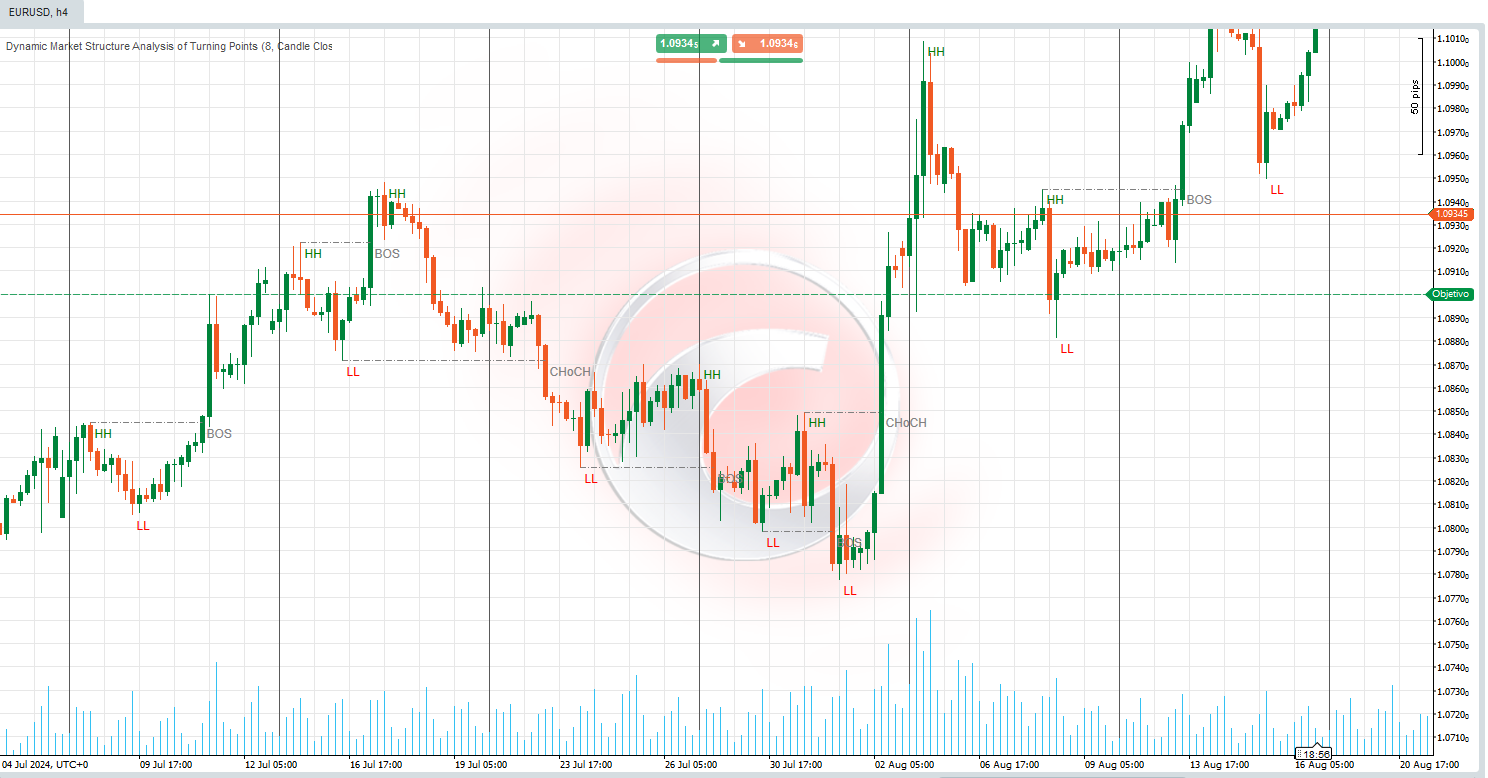
Dynamic
Market Structure
Analysis
of
Turning
Points
Fibonacci
Linear
Regression
Multi-timeframe
Auto
Support and
Resistance
Trend
Lines
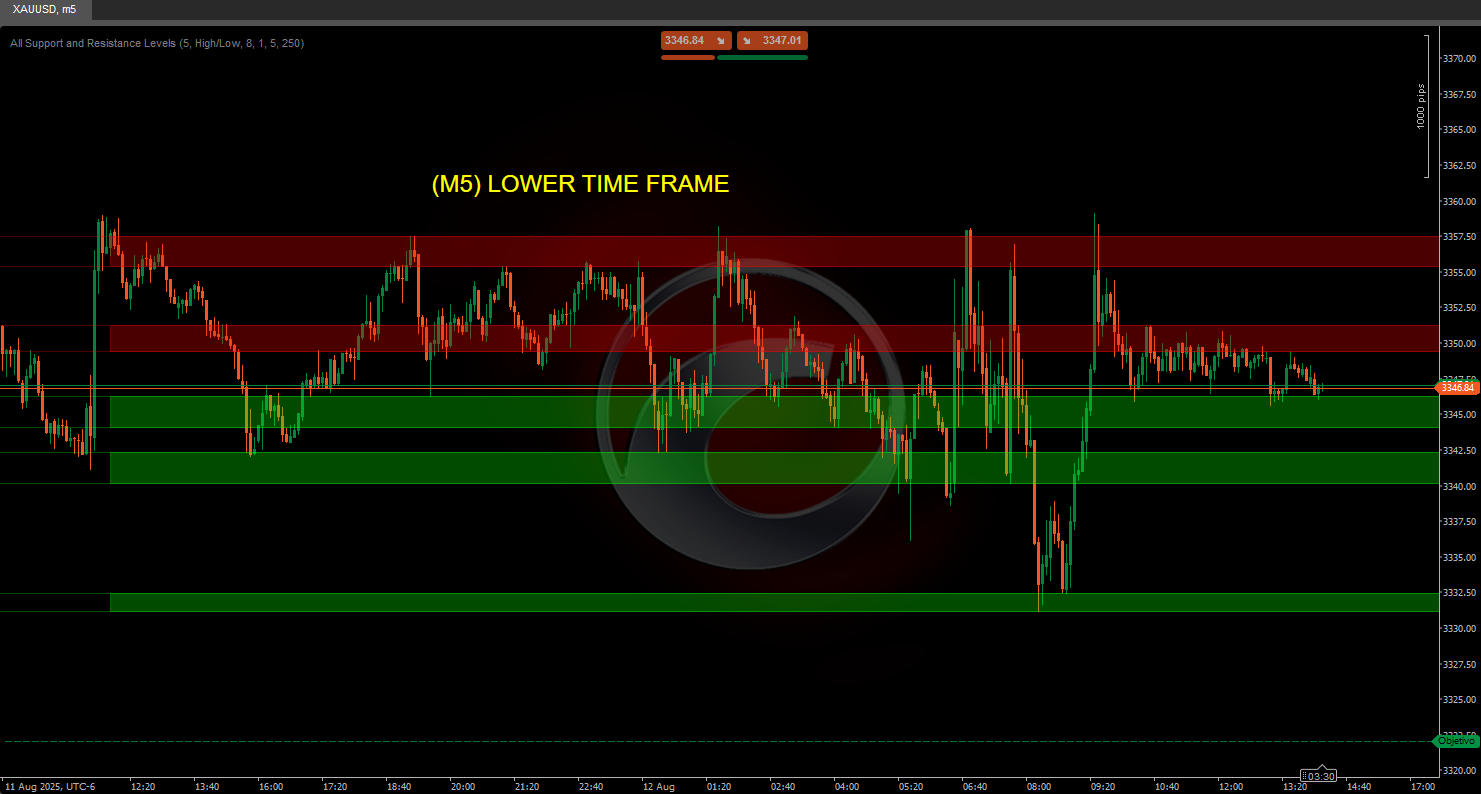
All
Support and
Resistance
Levels
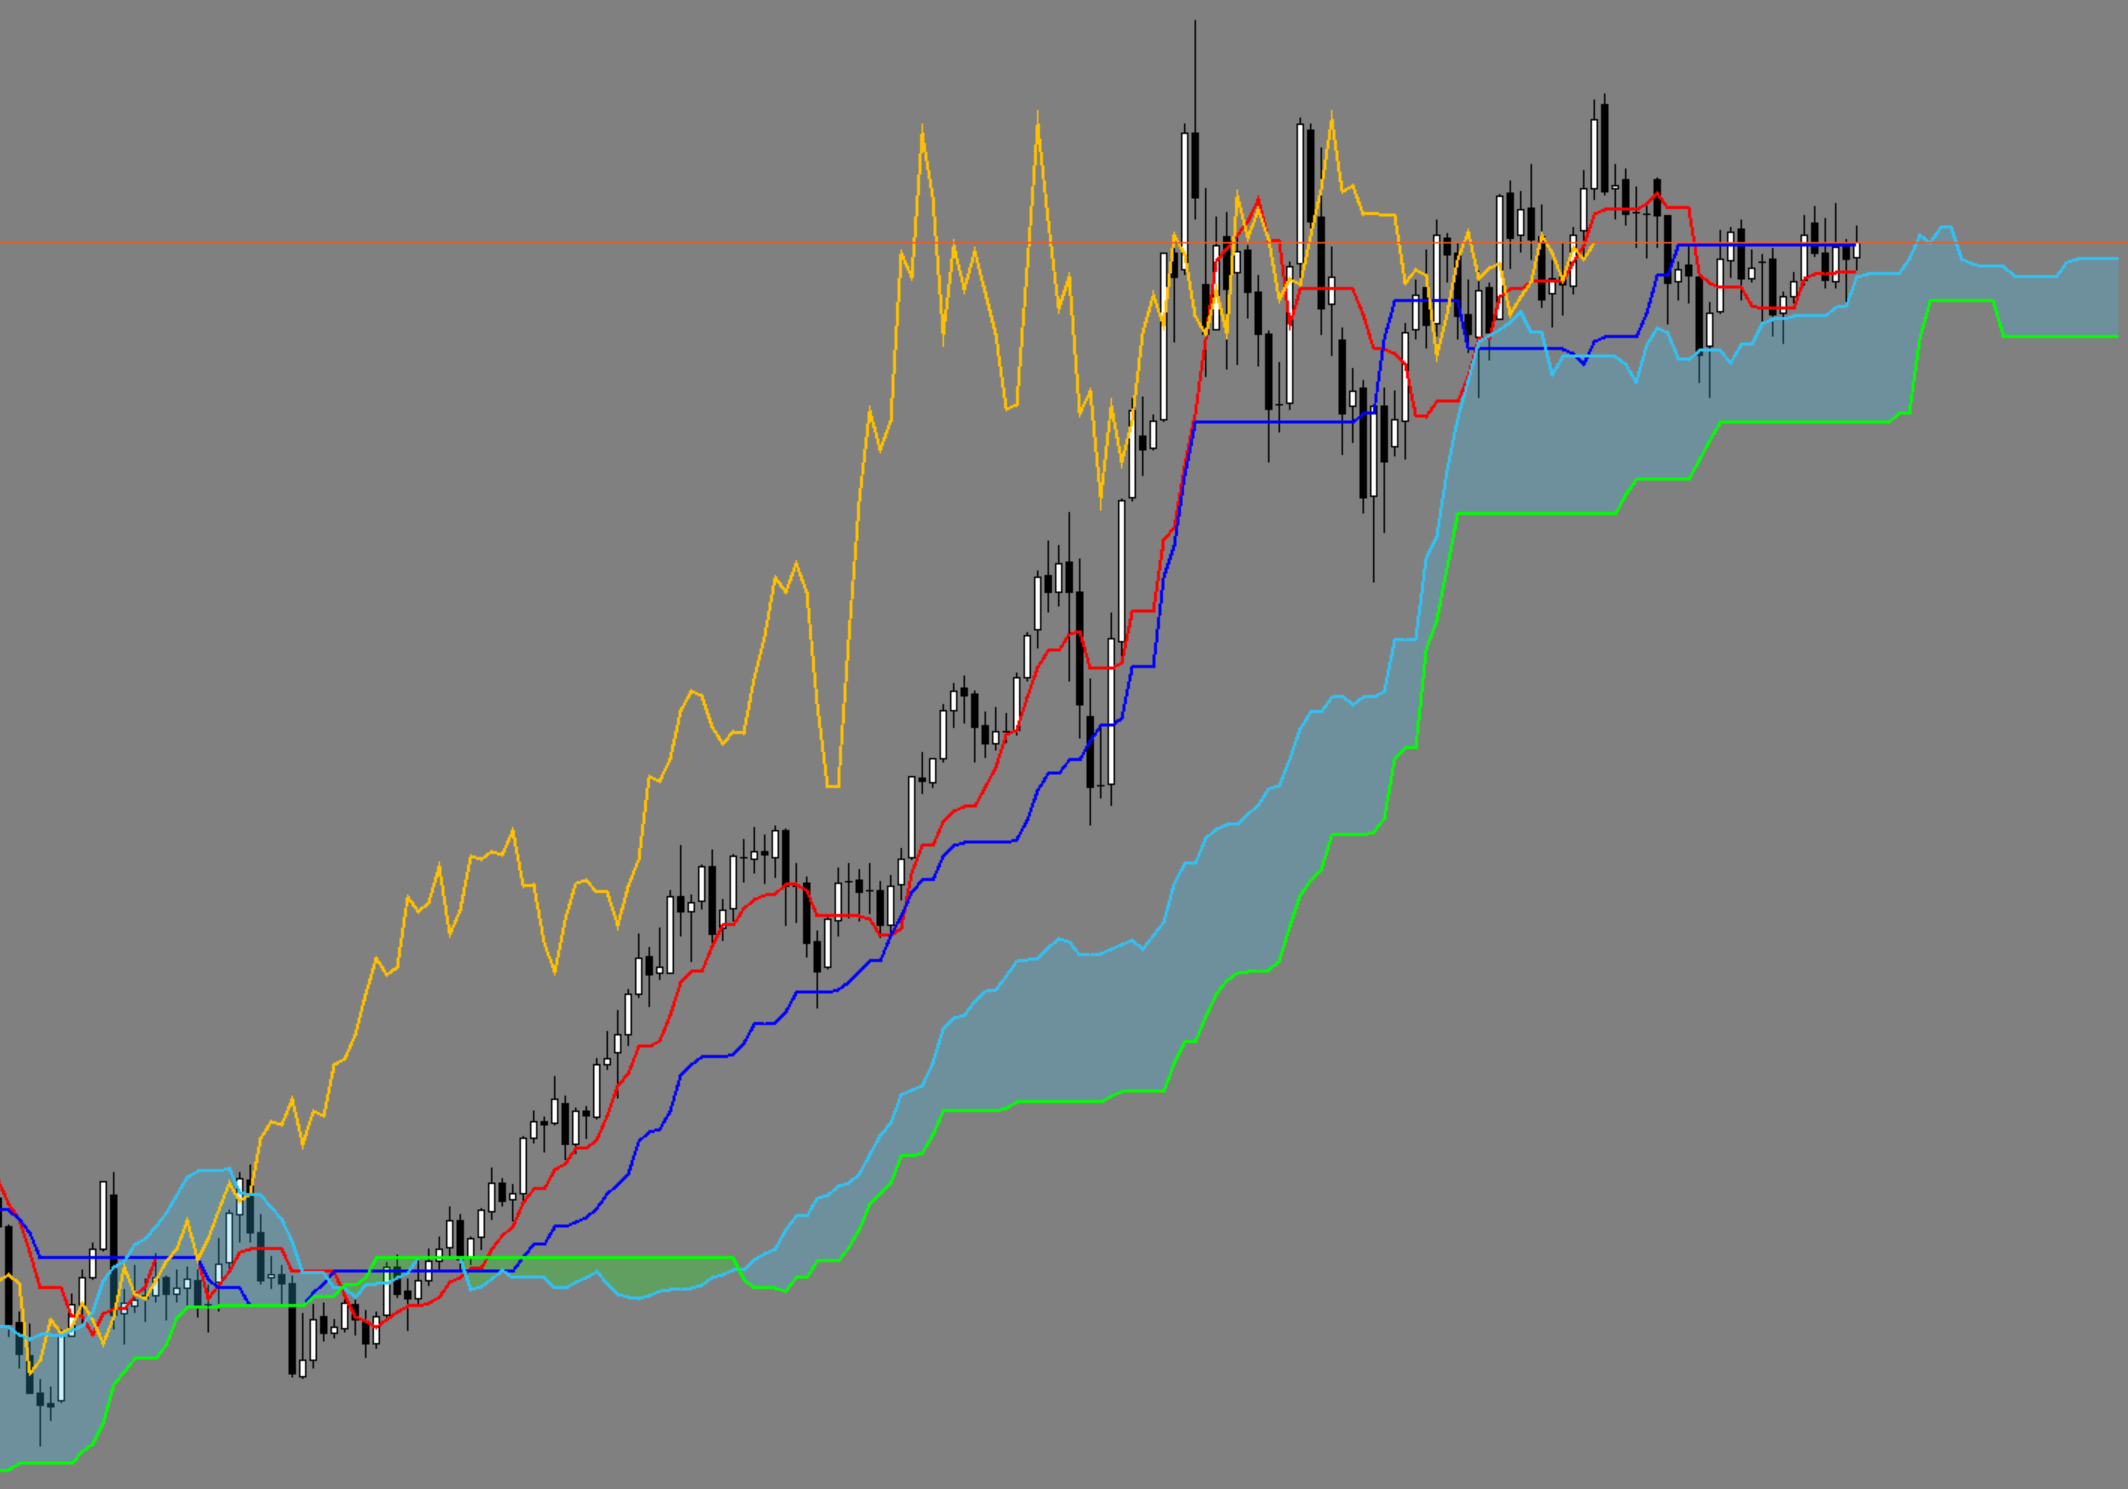
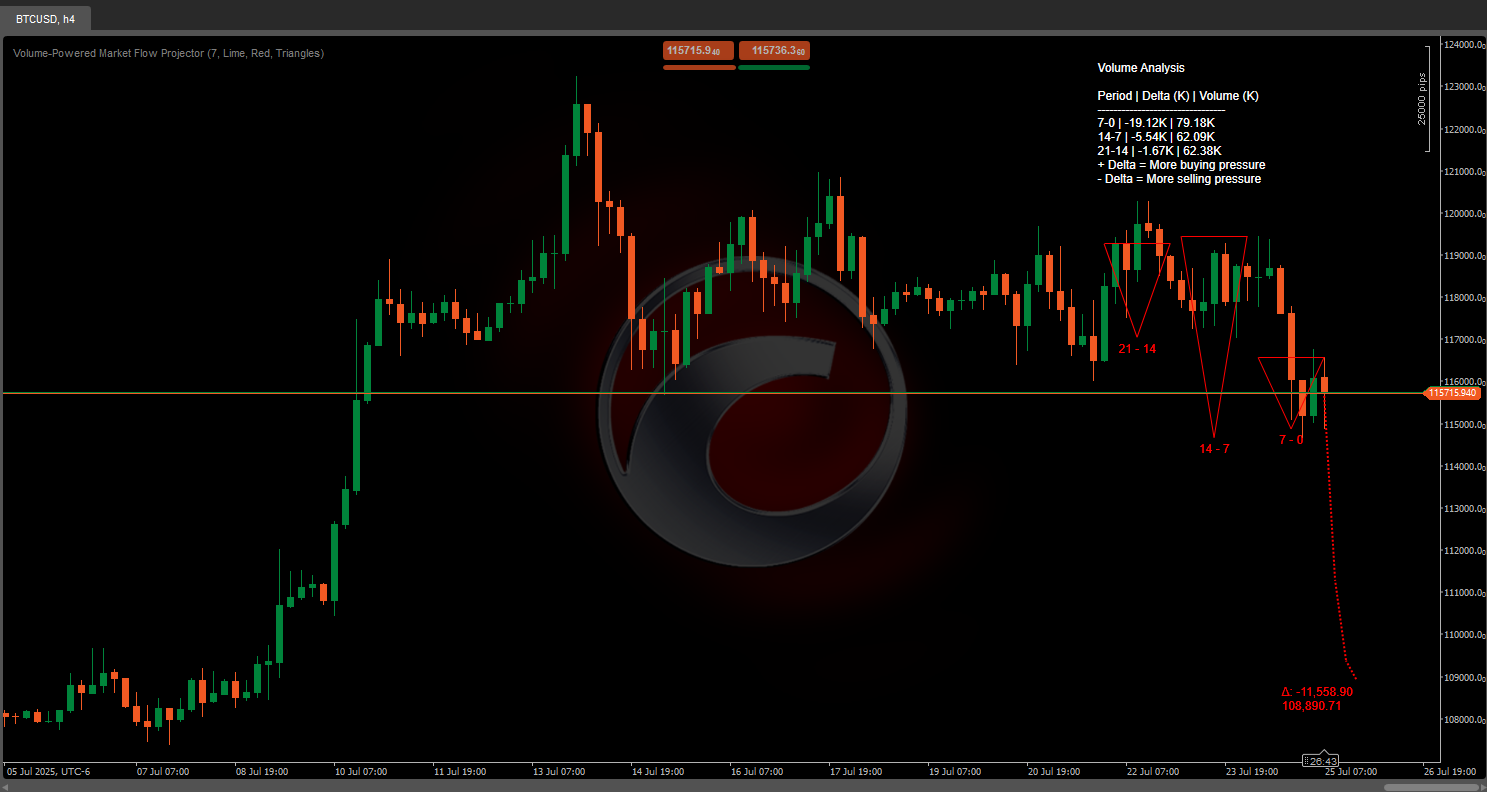
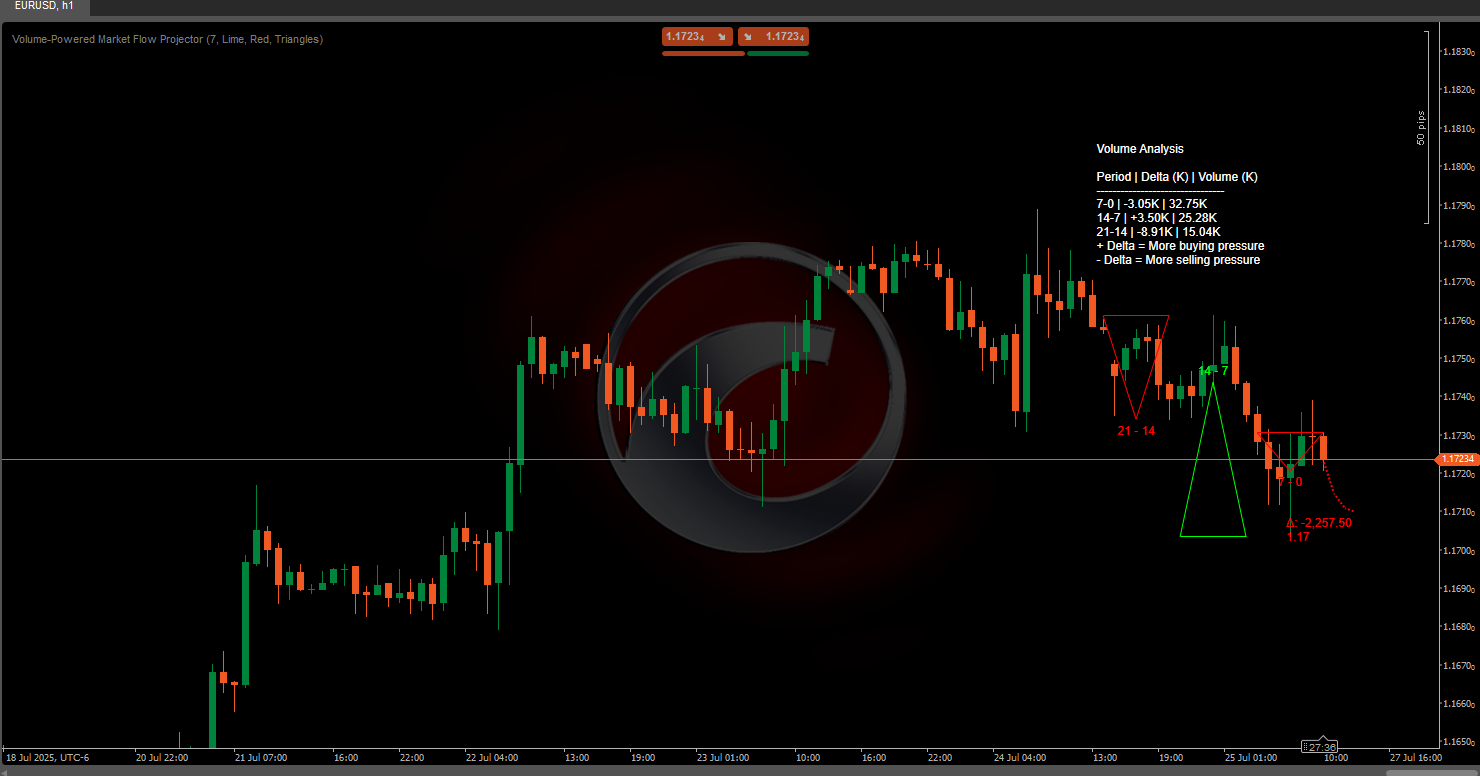
📊 Market Flow Projection:
The FutureTrend indicator is designed to dynamically analyze and project market behavior by integrating price and volume data across multiple time dimensions. Its key functionalities include:
⏳ Three-Period Analysis
📈 Calculates the average prices (highs and lows) and delta volume (difference between buying and selling pressure) across three consecutive periods defined by the Period parameter.
🔍 This consolidated view of historical movements helps identify dominant trends and shifts in market behavior.
🚀 Future Trendline Projection
📊 Using a weighted average of delta volumes from the three analyzed periods, the indicator projects a future trendline that reflects the market’s possible direction.
🛠️ The projection adjusts dynamically using smoothing factors to avoid extreme predictions.
🔷 Visual Representation of Shapes
🎨 Historical data is visually represented through geometric shapes (triangles, circles, or boxes) that illustrate the evolution of volume and price ranges for each period.
🔴🟢 The assigned colors (UpColor and DownColor) indicate the prevailing trend (bullish or bearish), enabling quick interpretation.
🏷️ Average Delta Volume & Future Price Label
📍 At the end of the projected trendline, a label displays the average delta volume and the estimated future price, offering a key reference for potential price movements and trend strength.
📋 Volume Data Table
📑 Provides a detailed table breaking down total volumes and delta differences for the three analyzed periods.
📊 This enables traders to quickly compare volume data, interpret market context, and support the future trend projection.
🔮 Direction
By combining volume and price data, the indicator offers a robust tool to predict both trend strength and potential shifts in market behavior during upcoming periods.
5 | 100 % | |
4 | 0 % | |
3 | 0 % | |
2 | 0 % | |
1 | 0 % |