MultiTimeFrameTrend
27/07/2025
1
Desktop
Since 21/01/2025
Sales
1
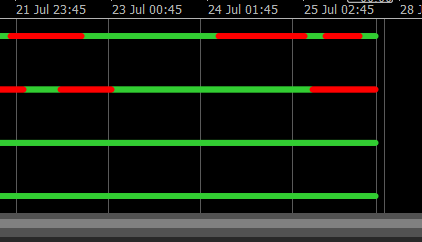
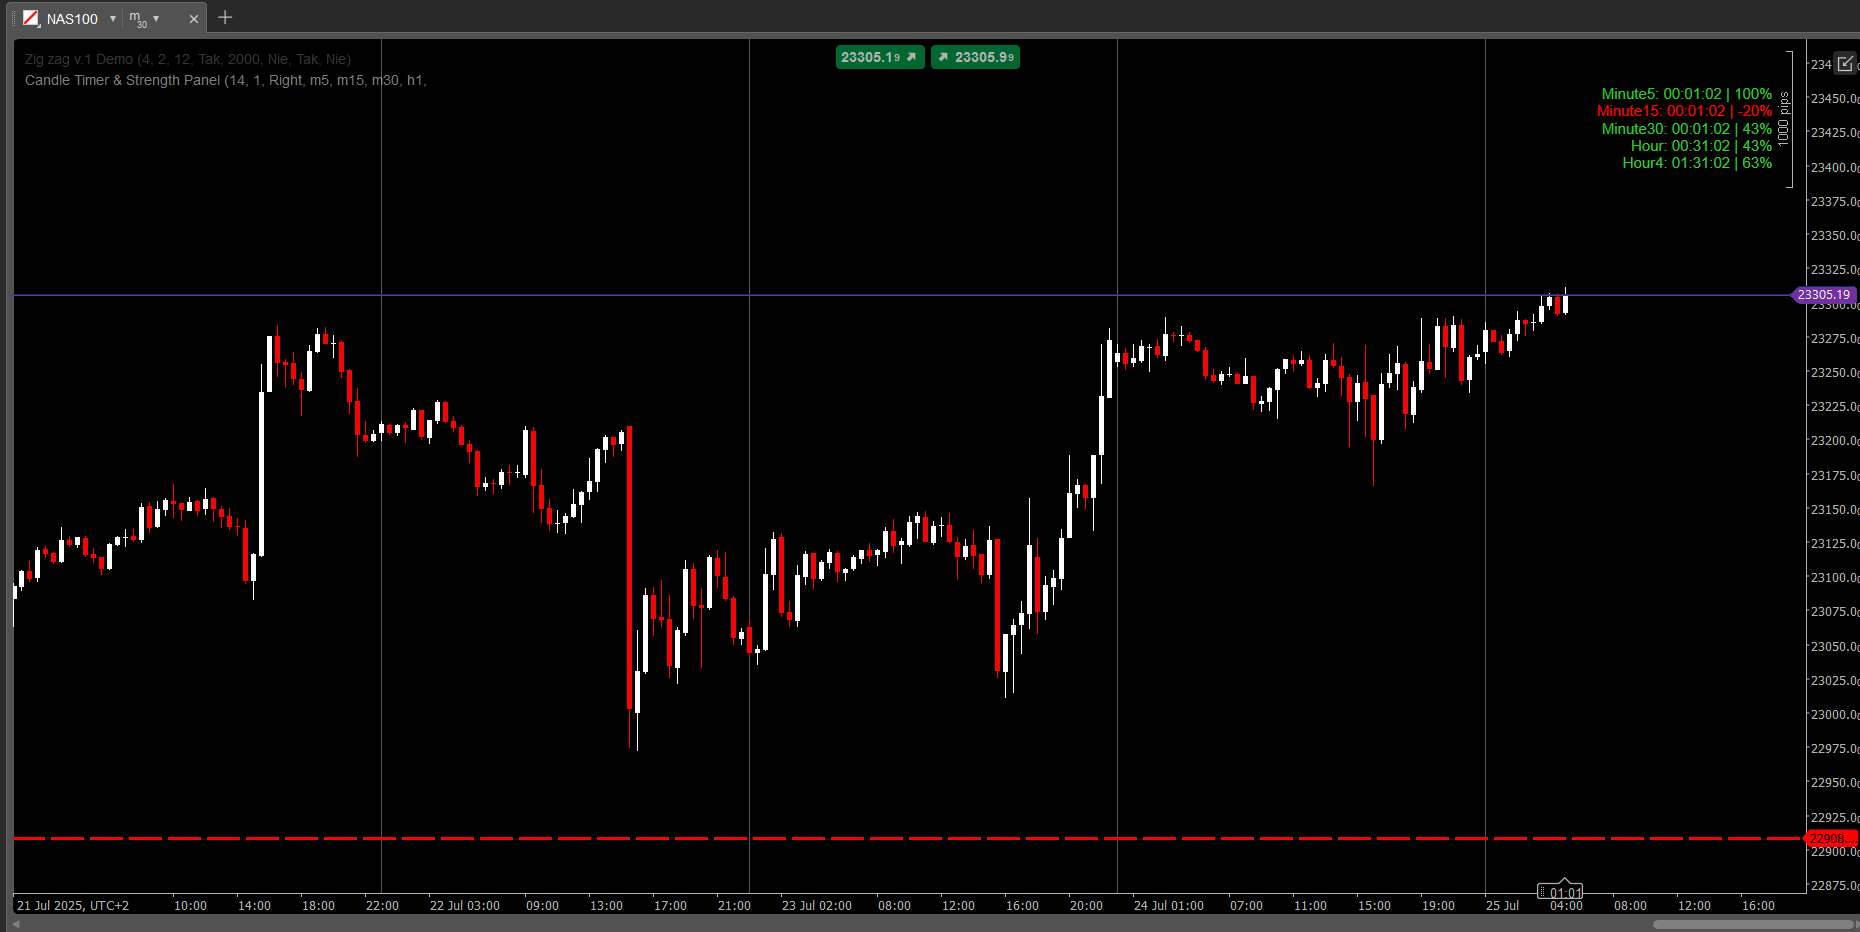
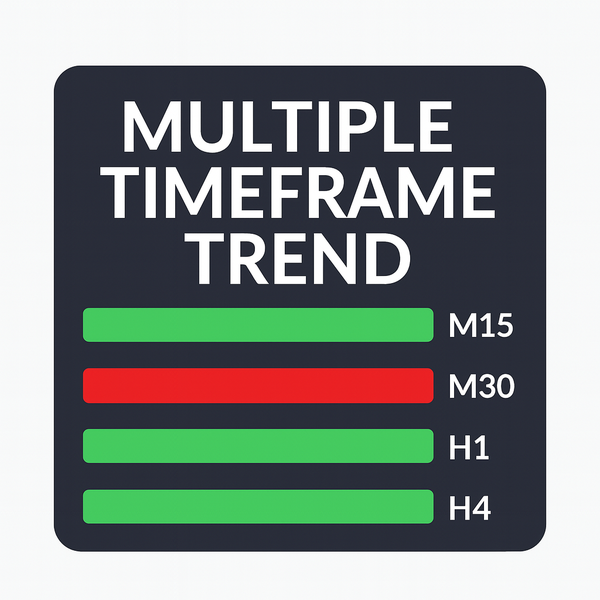
Multi Timeframe Trend Dots is a powerful and minimalist trend indicator built for cTrader. It allows traders to visually track trend direction across up to 4 selectable timeframes using simple but effective color-coded dot lines.
✅ Green = Uptrend
✅ Red = Downtrend
✅ Clean layout in a single sub-window
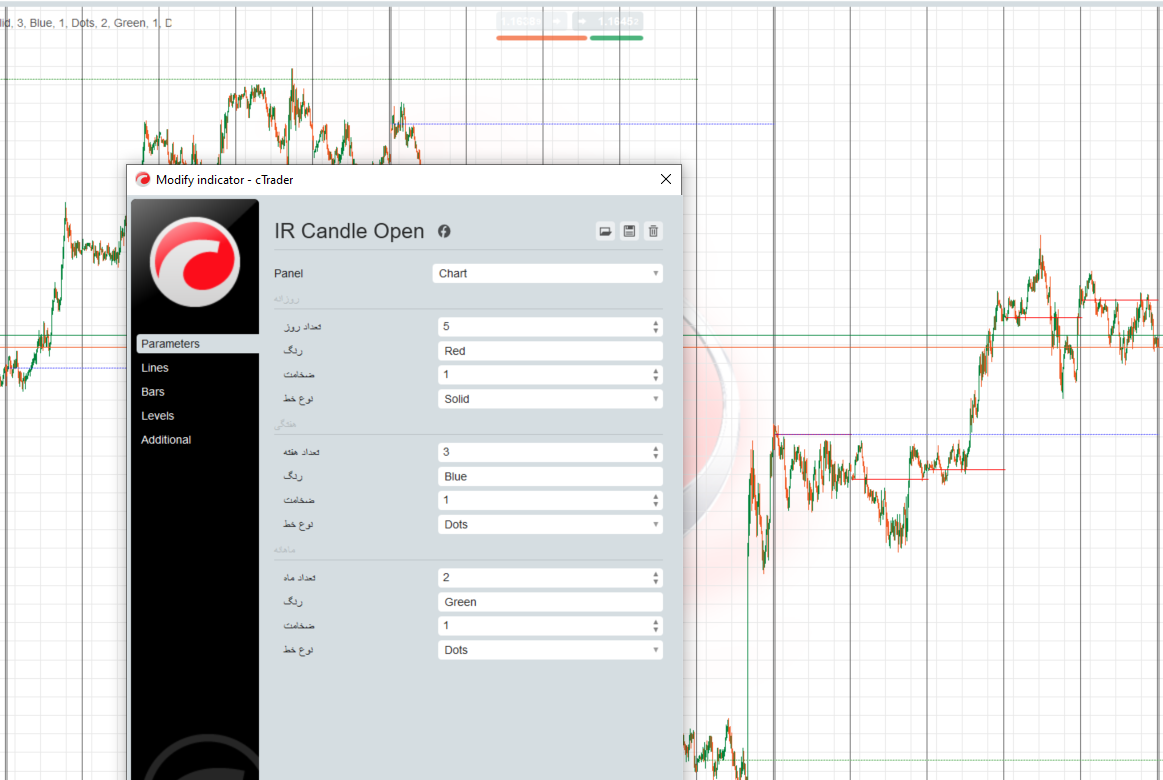
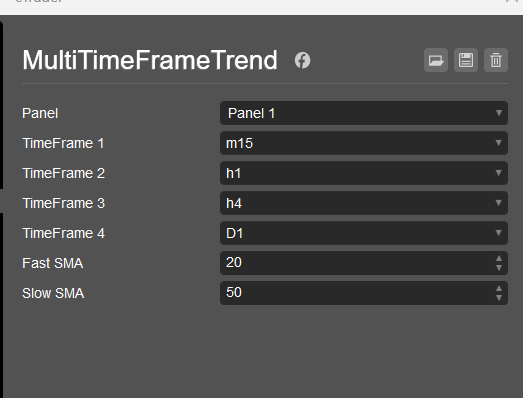
✅ Customizable SMA fast/slow settings
✅ Works on any symbol and timeframe
Whether you're a scalper, intraday trader, or swing trader, this indicator gives you a quick glance of multi-timeframe alignment — ideal for making confident entries or filtering out bad setups.
💼 Includes:
- Trend logic based on SMA crossover
- 4 level dot placement (adjusted for readability)
- Timeframe labels at the end of each trend line
- Fully compatible with all cTrader versions
🎁 Perfect companion for strategy building or manual trading.
You may also like

.jpg)
.png)