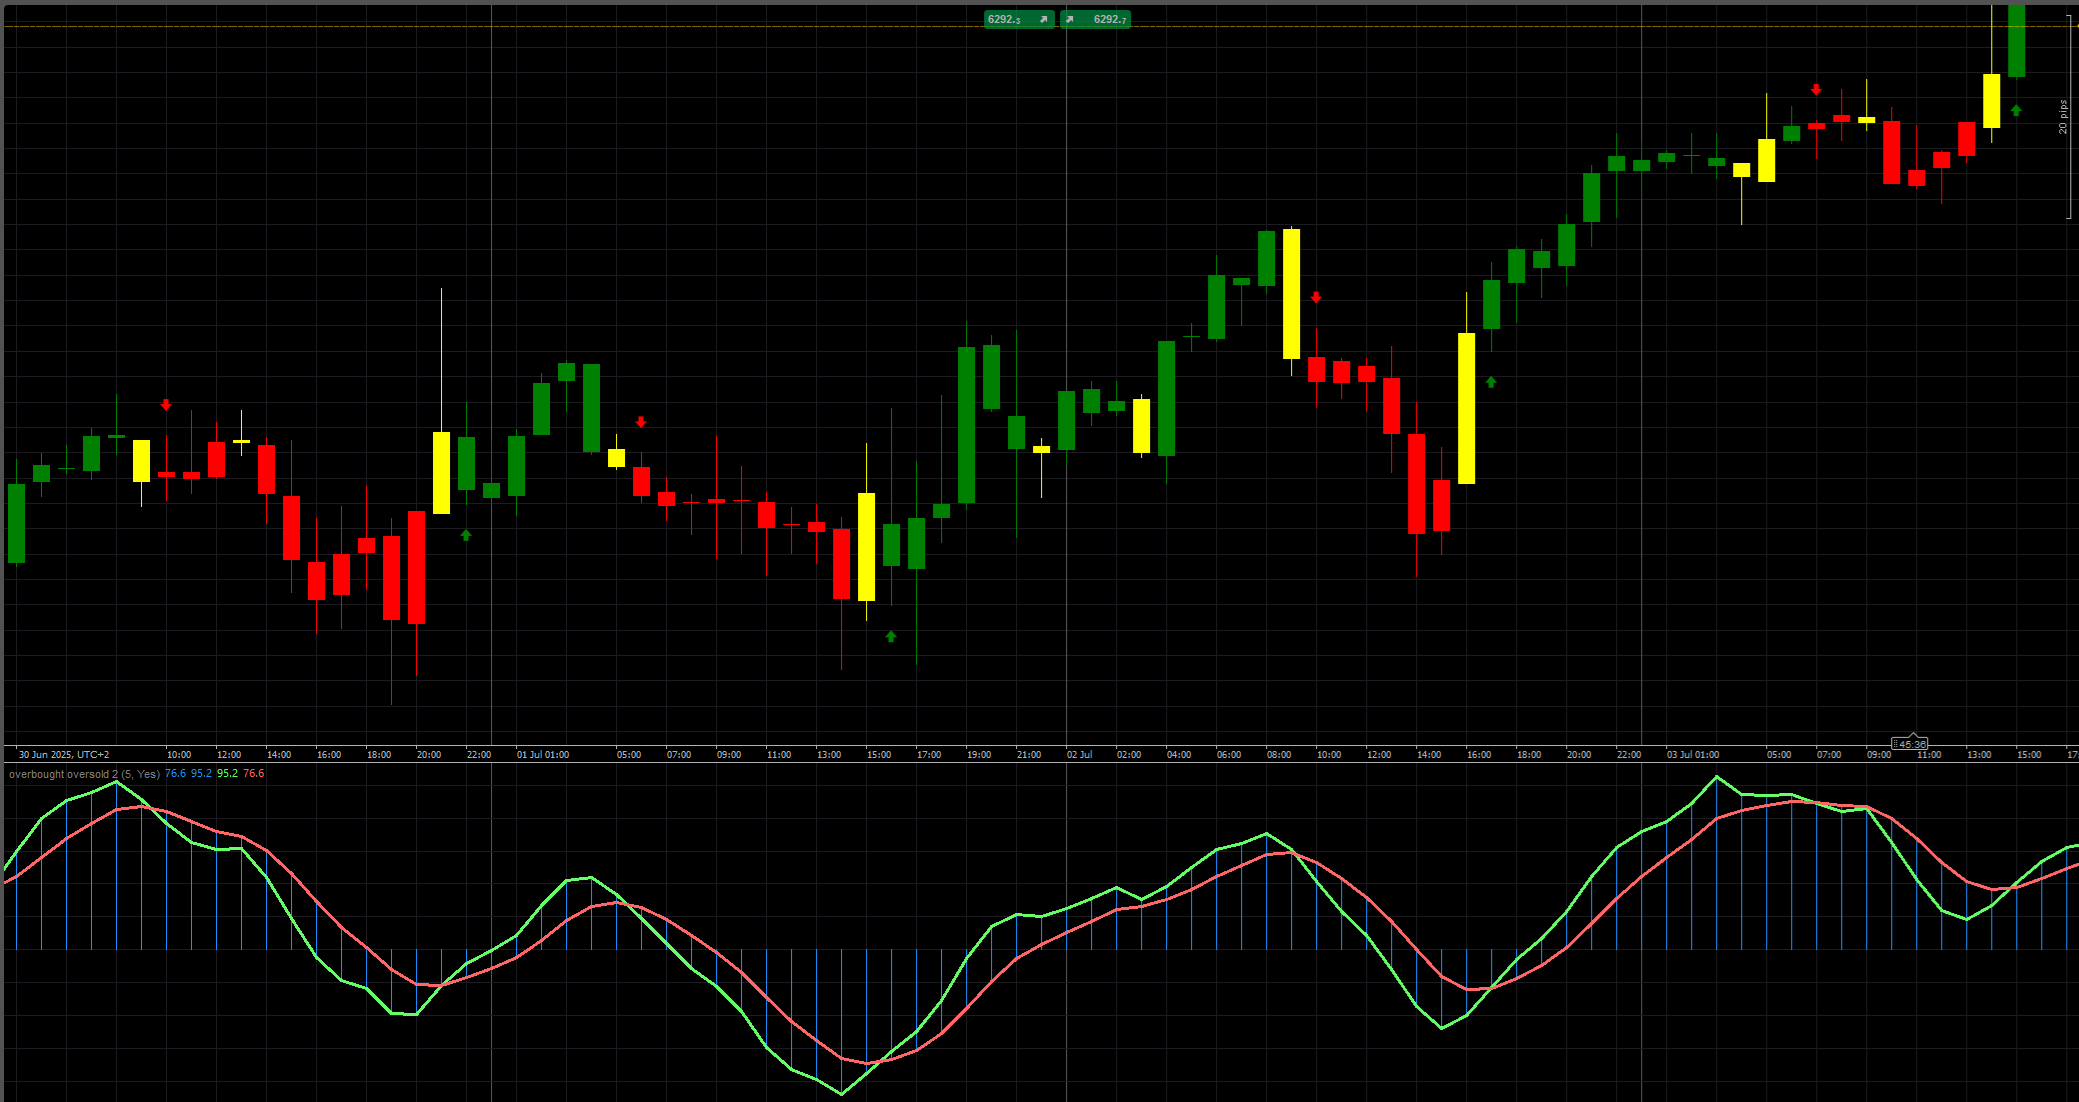
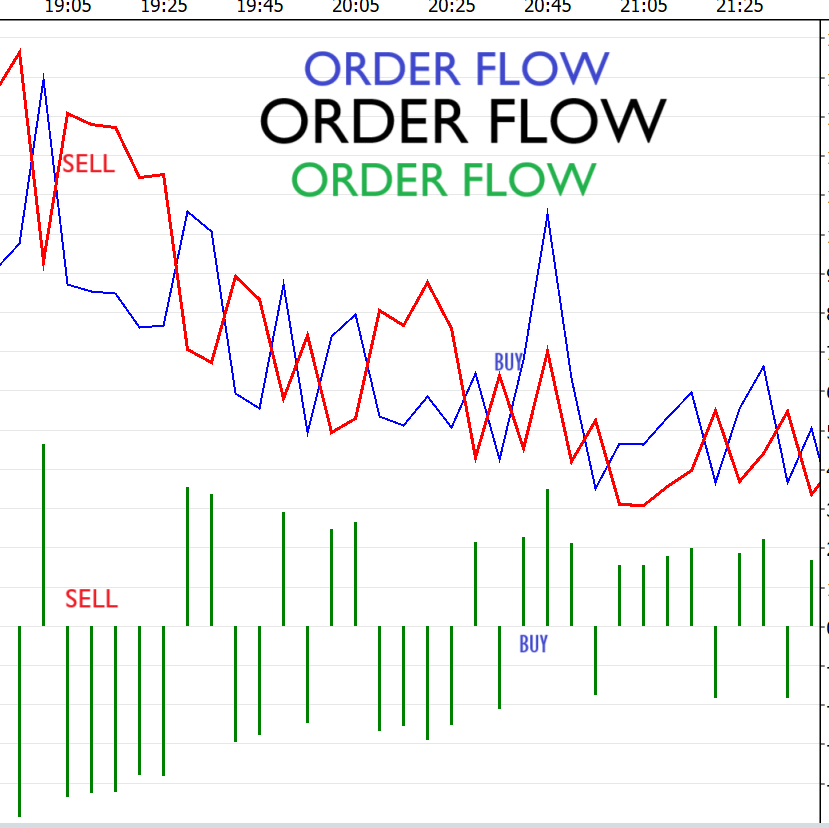
Order Flow
"Order Flow" logo
23/08/2025
83
Desktop
Since 28/07/2025
Traded volume
201.01K
Pips won
24.85K
Sales
1
Free installs
223
"Order Flow" uploaded image"Order Flow" uploaded image"Order Flow" uploaded image"Order Flow" uploaded image"Order Flow" uploaded image"Order Flow" uploaded image

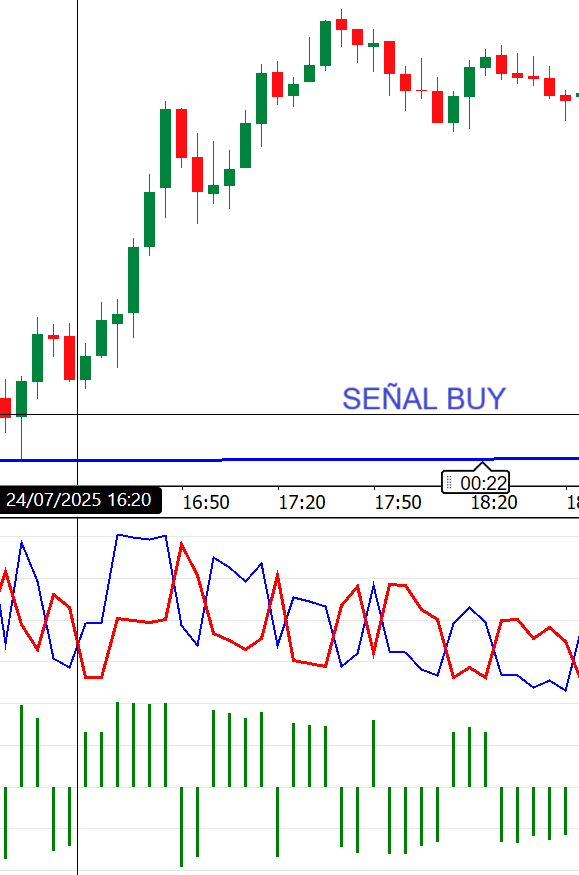
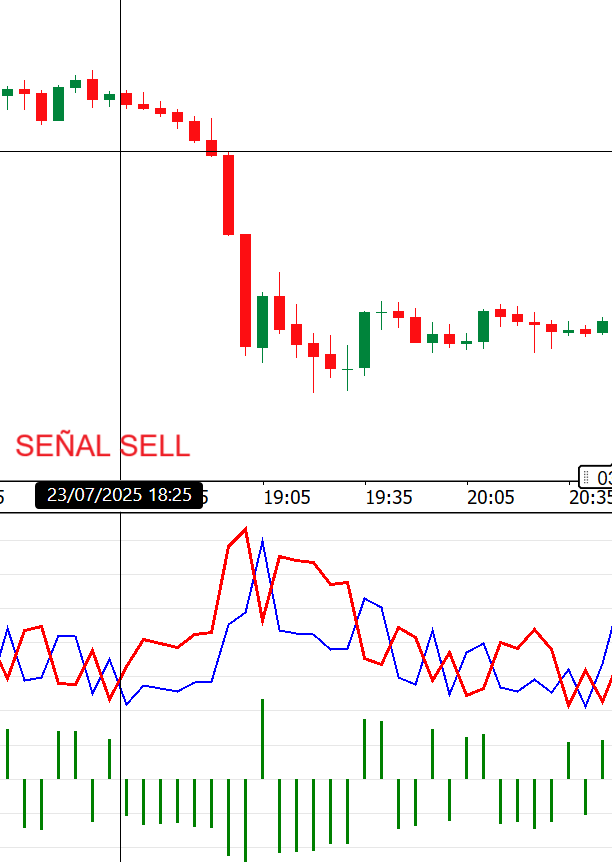
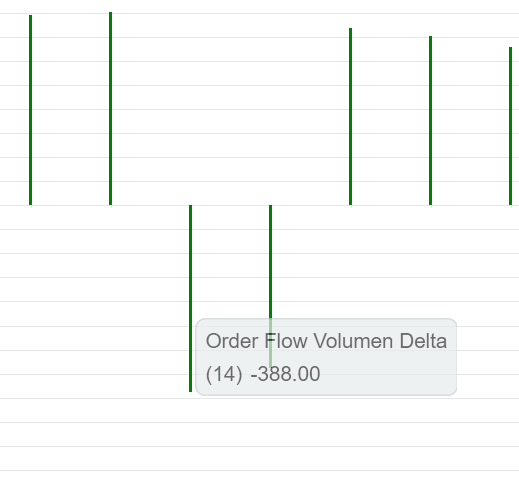
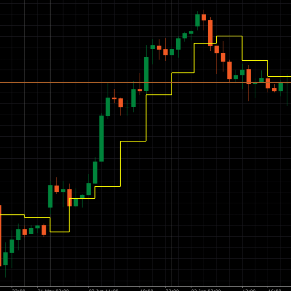
Confirmar la dirección del precio:

  • Si el precio está subiendo y el Volumen Delta es positivo (histograma verde arriba de cero), esto confirma que hay presión de compra, lo que sugiere que podrías entrar en una operación de compra ("buy") para aprovechar el movimiento alcista.
  • Si el precio está bajando y el Volumen Delta es negativo (histograma verde abajo de cero), confirma presión de venta, lo que podría ser un buen momento para una operación de venta ("sell").
0.0
Reviews: 0
Customer reviews
No reviews for this product yet. Already tried it? Be the first to tell others!
More from this author
Precio Promedio Ponderado por Volumen
VWAP (Volume Weighted Average Price, Precio Promedio Ponderado por Volumen)
cBot
Grid
RSI
XAUUSD
+2
Long Grid Remaining Candle Time
La mejor estrategia que encontraras en el mercado!
cBot
ATR
Signal
Crypto
+1
CriptoCrossoverBotFree
Adquiere su máximo potencial con la versión de paga / Get your full potential with the paid version.
cBot
Signal
Crypto
BTCUSD
+1
CryptoCrossoverBot
Crossover Bot es un sistema de trading algorítmico actualmente en operación real, currently in live operation.
cBot
Supertrend
MACD
BTCUSD
+2
BTCDirectionalIndex
Combina los indicadores Índice Direccional Promedio (ADX) y Convergencia/Divergencia de Medias Móviles (MACD).
cBot
Grid
ATR
Supertrend
+3
GridAsssault
Automatizado inteligente, diseñado para operar con precisión y seguridad en mercados volátiles, BTC/USD.
You may also like
True Trend H4
It draws a step line that visualize the movement of H4. Particularly effective when trade on lower timeframe.
Indicator
NAS100
NZDUSD
XAUUSD
+7
Bayesian Price Projection Model
Bayesian theory** to forecast a future price while providing **uncertainty ranges** that represent upper and lower bound
Indicator
Indices
Stocks
Forex
+2
HorizontalSupportResistance
This extraordinary multi-timeframe support and resistance indicator is nothing short of market wizardry.
IR Macd + MacdLine
some user add moving average to macd to see better. in ctrader 4.3.11 there is a problem with this . I make a macd tha
ICT Killzone and Sessions high_low
This indicator is an essential tool for traders seeking to visualize key trading sessions on their charts.
IR Coral
Coral indicator
Premium Discount Zones
Premium Discount Zones" spots key areas (🟣Premium/🟢Discount) using recent highs/lows & volume..............
Indicator
RSI
XAUUSD
Breakout
+5
BOS & CHOCH
Market structural patterns , specifically the concepts of Change of Character (ChoCH) 🔄 and Break of Structure (BoS) 💥
vpdi
VPDI (open, close, high and low with % of the previous day and price changes in % of the previous day's close)
Indicator
Indices
Prop
Stocks
+5
New Way Sar - Free
The Parabolic SAR, or "Stop and Reverse," is a dynamic technical analysis tool
Indicator
NAS100
NZDUSD
XAUUSD
+12
Volume Meter
Volume Meter
Indicator
NAS100
NZDUSD
RSI
+12
TrendFibonacci
The TrendFibonacci indicator is a powerful tool for traders, combining Fibonacci retracement levels
Area of Interest
Area of Interest with the power of AI to detect the market interest.
Indicator
VWAP
ZigZag
RSI
+6
RSI T3 Overbought and oversold areas
Three parameter RSI
Indicator
Grid
NAS100
NZDUSD
+17
Institutional Volume Supply Demand
Volume Profile Supply Demand
Break of Structure
The Break of Structure (BoSCHoCh) Indicator is a smart market structure tool designed to help traders easily spot trend.
Indicator
Indices
RSI
Bollinger
Clustering
Clustering tool for traders with visual insights into market patterns.
overbought oversold
Overbought Oversold Indicator