Fibonacci Pitchfan
"Fibonacci Pitchfan" logo
06/08/2025
55
Desktop
Since 03/10/2024
Sales
107
Free installs
16999
"Fibonacci Pitchfan" uploaded image"Fibonacci Pitchfan" uploaded image"Fibonacci Pitchfan" uploaded image"Fibonacci Pitchfan" uploaded image"Fibonacci Pitchfan" uploaded image

🚀 10,000+ traders already use our TOP indicators🏆

Discover why professionals choose us – the most powerful tools on cTrader (indicators, algorithms, and cBots) are waiting for you.

👉 Get all our TOP systems here:

_______________________________________________

📌 Market Structure Indicators

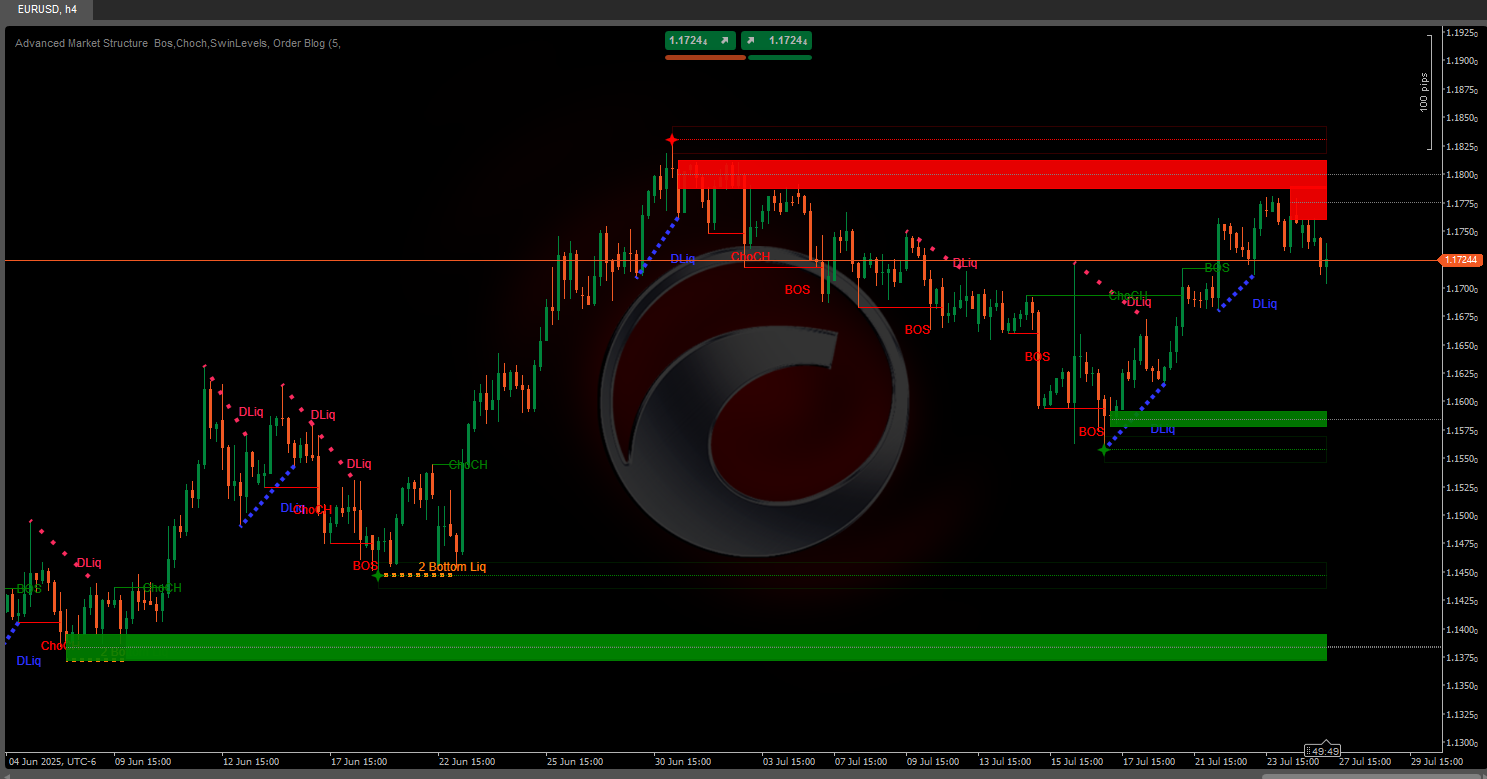
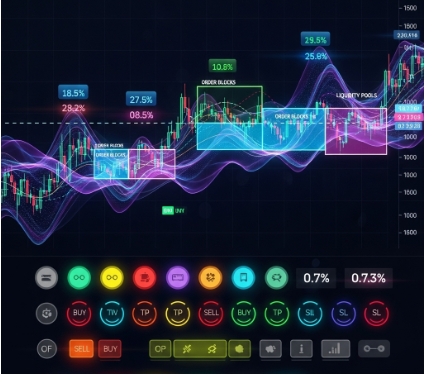
·     ✅ AdvancedMarket Structure: Bos, Choch, SwinLevels, Order Blocks,  Market Structure& Liquidity Finder

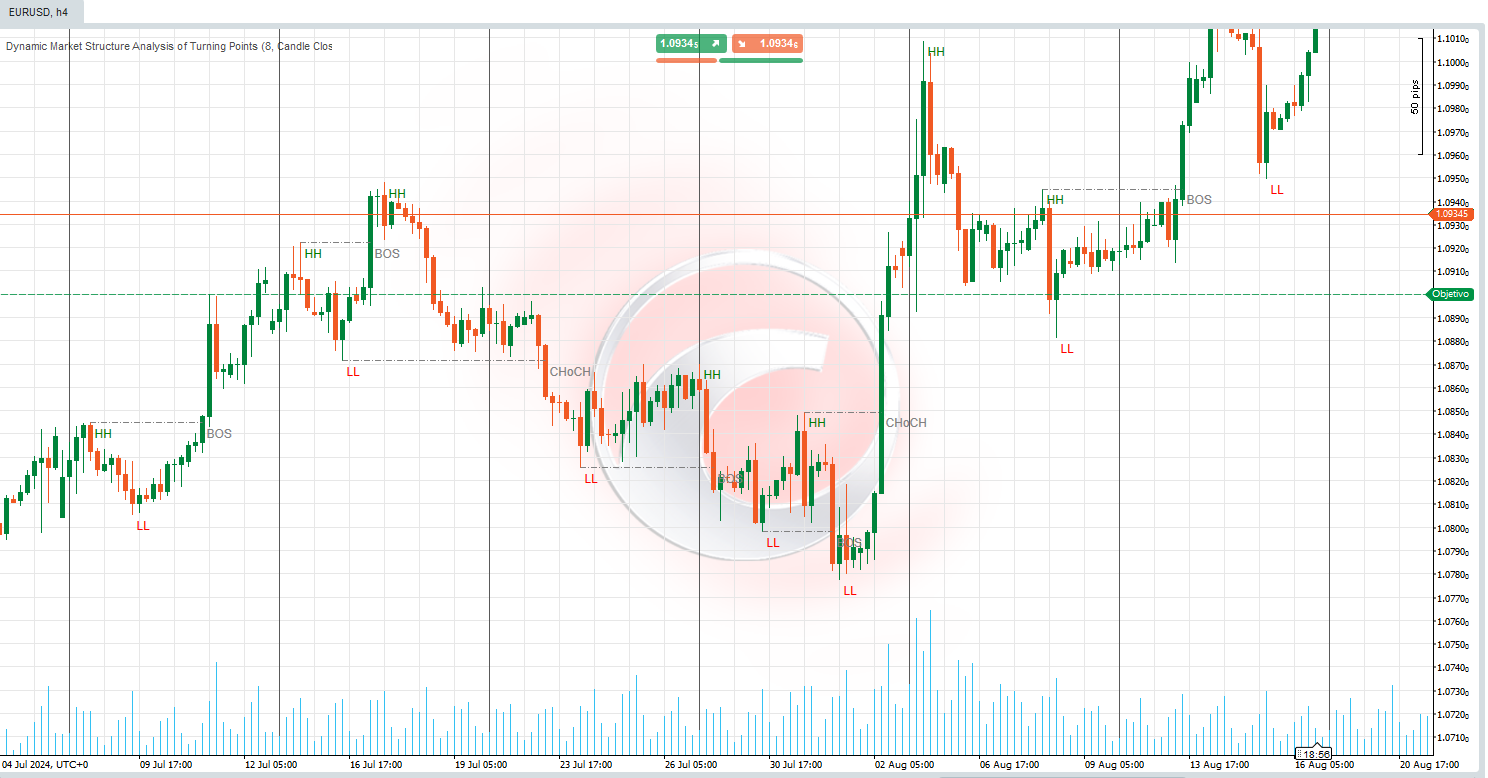
·     🔄 Dynamic Market StructureAnalysis of Turning Points

·     🧱 Order Block

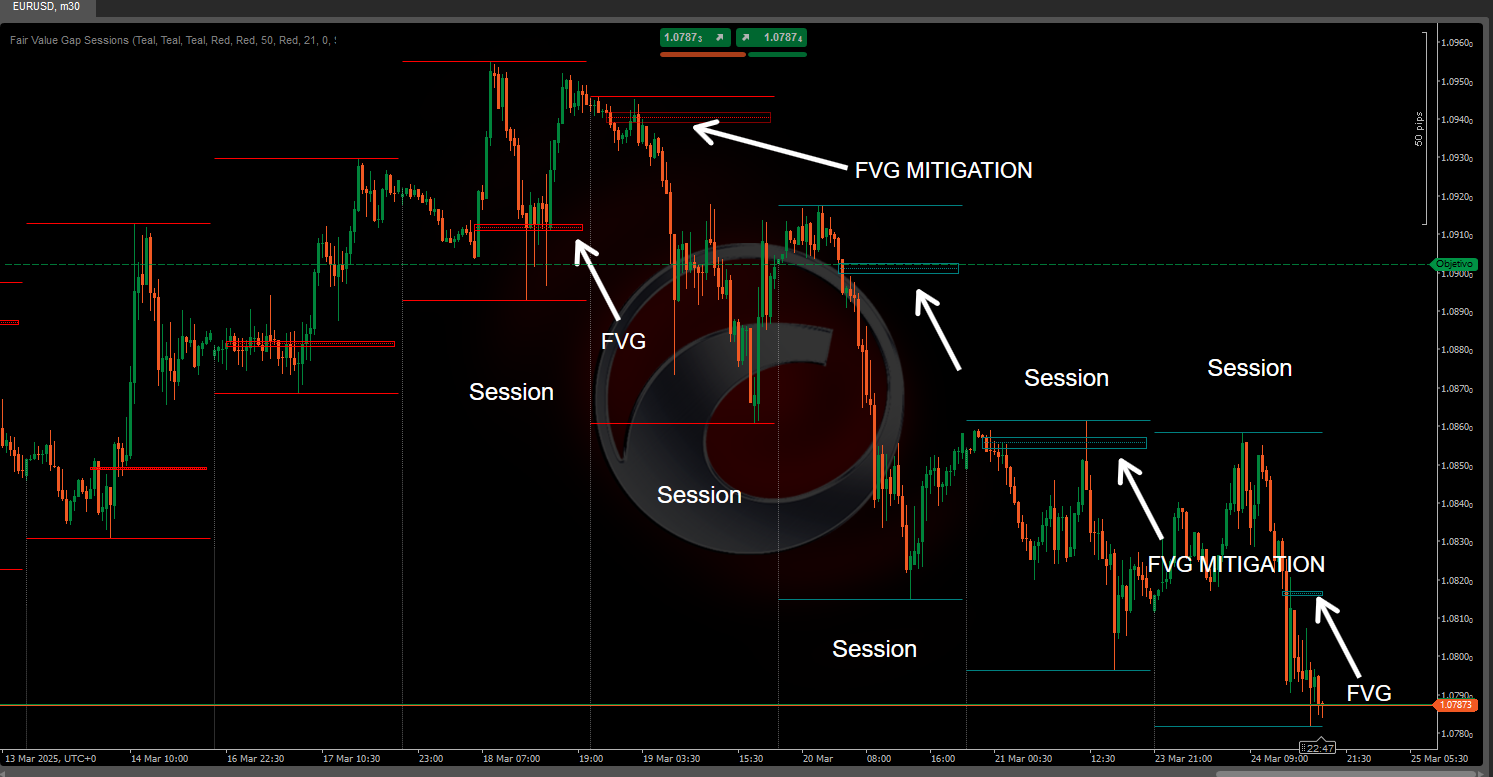
·     ⚖️ Market Imbalance

·     ⛓️ BOS & CHOCH

·     🧠 ICT Power of 3

·     🌀 Market Polarity Zones

_______________________________________________

🔚 Smart Exit Systems
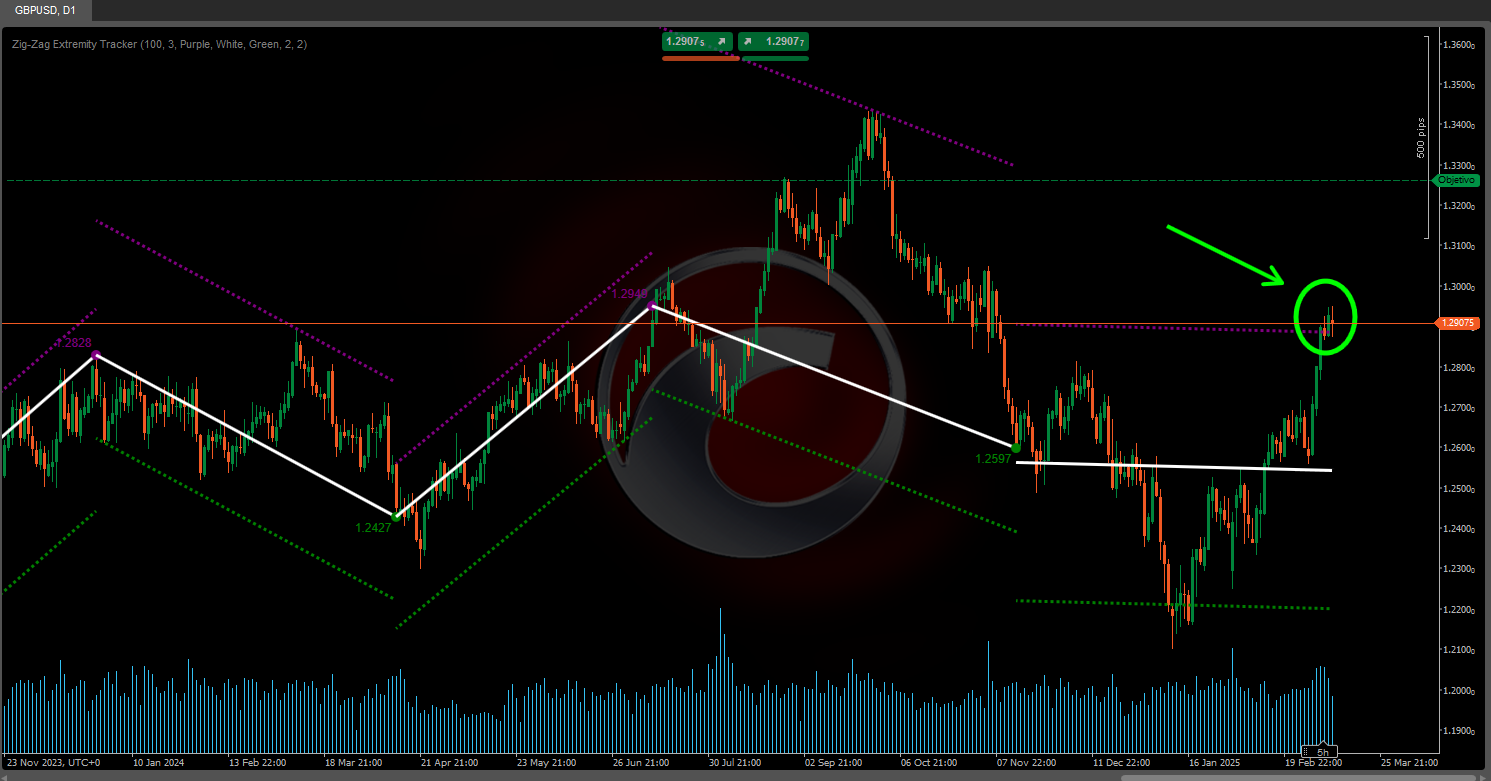
·     📍 Trailing Smart Algorithm

_______________________________________________

📐 ZigZag Indicators

·     🔍 ZigZag Price LiquidityProjection

·     🧭 S&R Structural ZigZag

·     ➖ ZigZag

·     🎯 Zig-Zag Extremity Tracker

_______________________________________________

🧱 Support & Resistance Indicators

·     🟩 SmartTrend Support &Resistance Lines

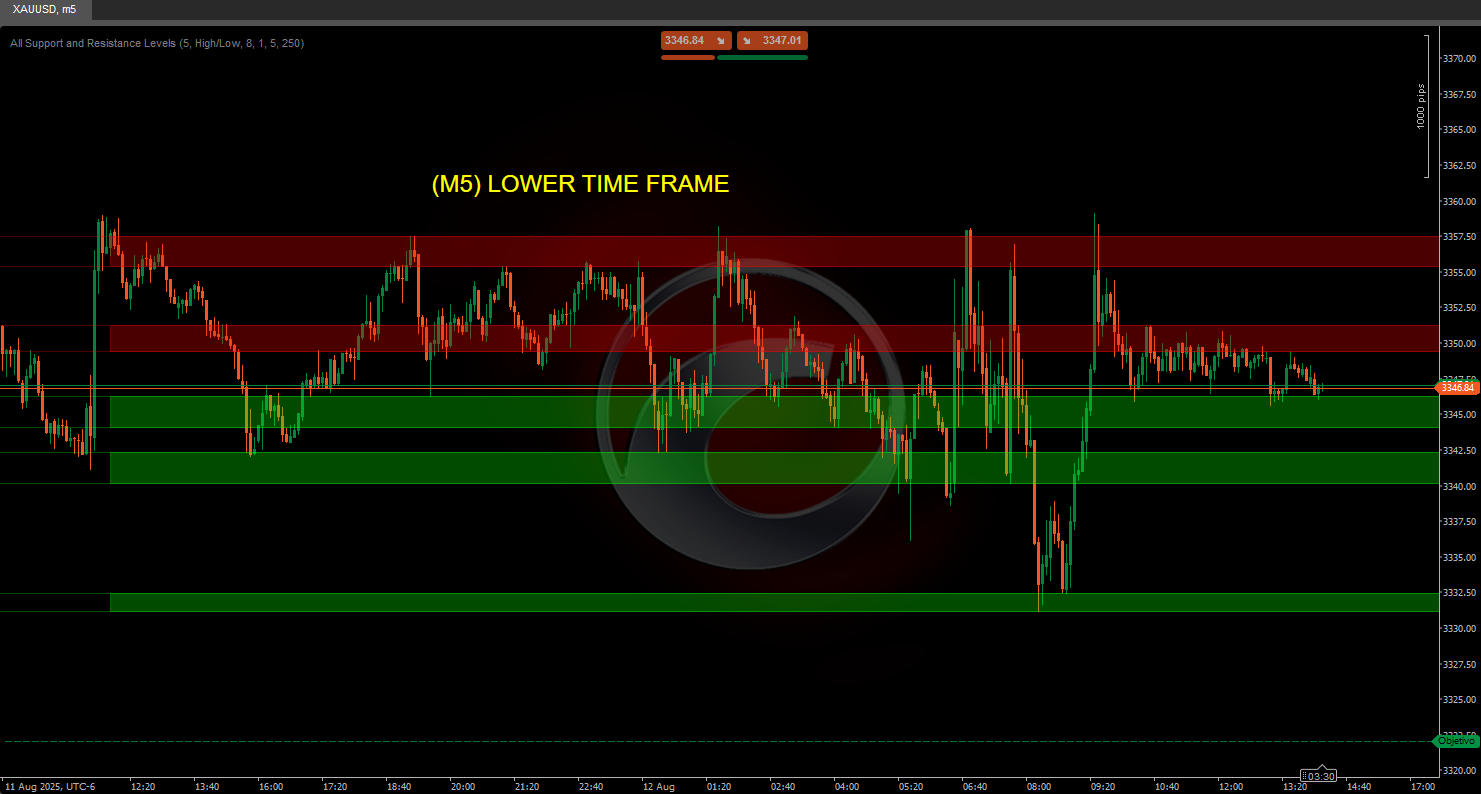
·     🧱 All Support and ResistanceLevels

_______________________________________________

📊 Trend & Channel Indicators

·     🔄 Auto-Trend Channel

·     📊 Supertrend

·     ⚡Momentum Trend Analyzer

·     🧠 Adaptive Trend Channel

·     💥 Channel Breakout System

·     🌈 Dynamic Trend Gradient

·     ⭐ PREMIUM SSL CHANNEL

·     🔁 Reactive Moving Average

_______________________________________________

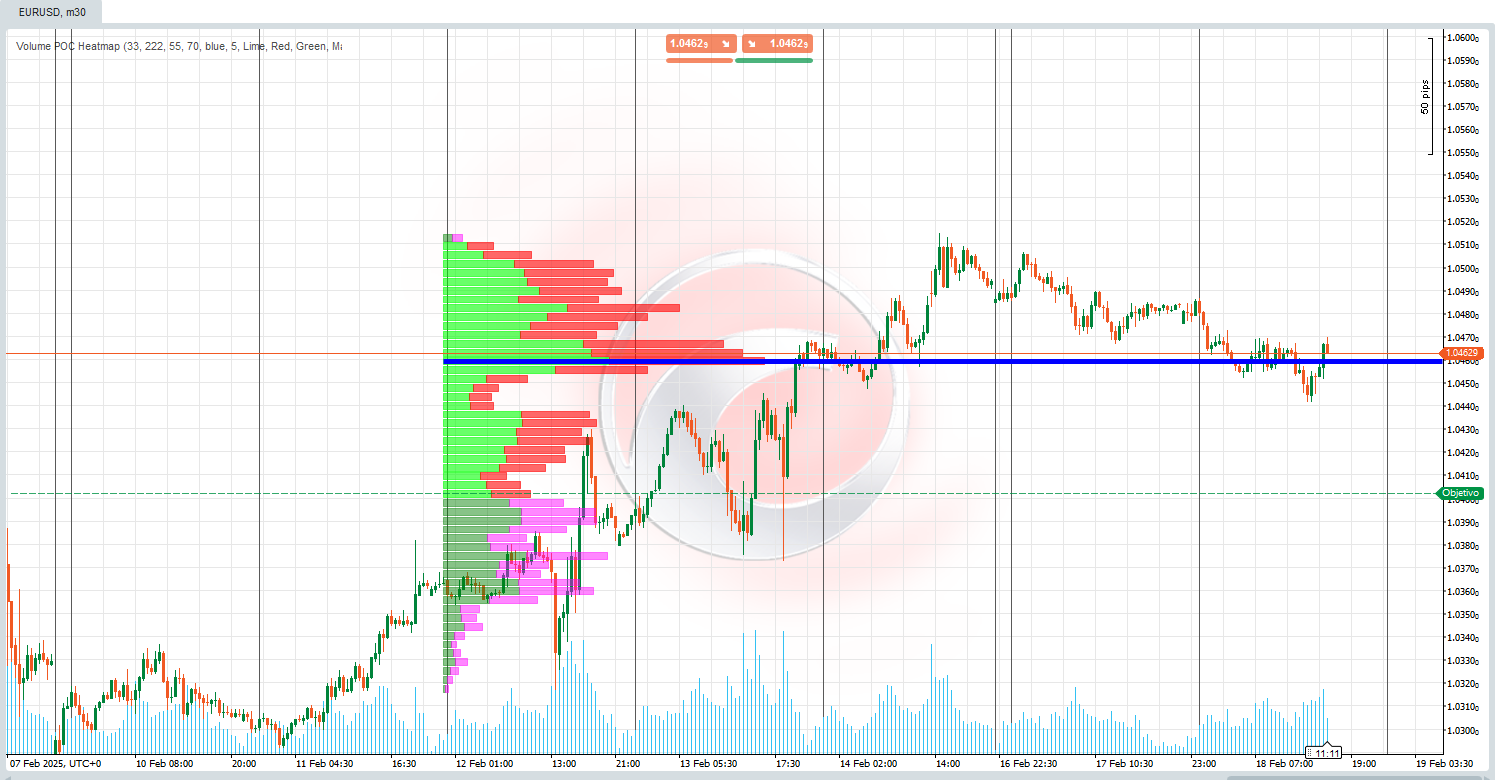
💧 Volume & Liquidity Tools

·     🔥 Volume POC Heatmap

·     📉 Leverage Liquidation Map

·     🔍 Momentum Fair Value Gap

·     🕒 Fair Value Gap Sessions

_______________________________________________

Momentum & RSI Indicators

·     📈 RSI Trend Trigger

·     🚀 Dynamic Range Momentum

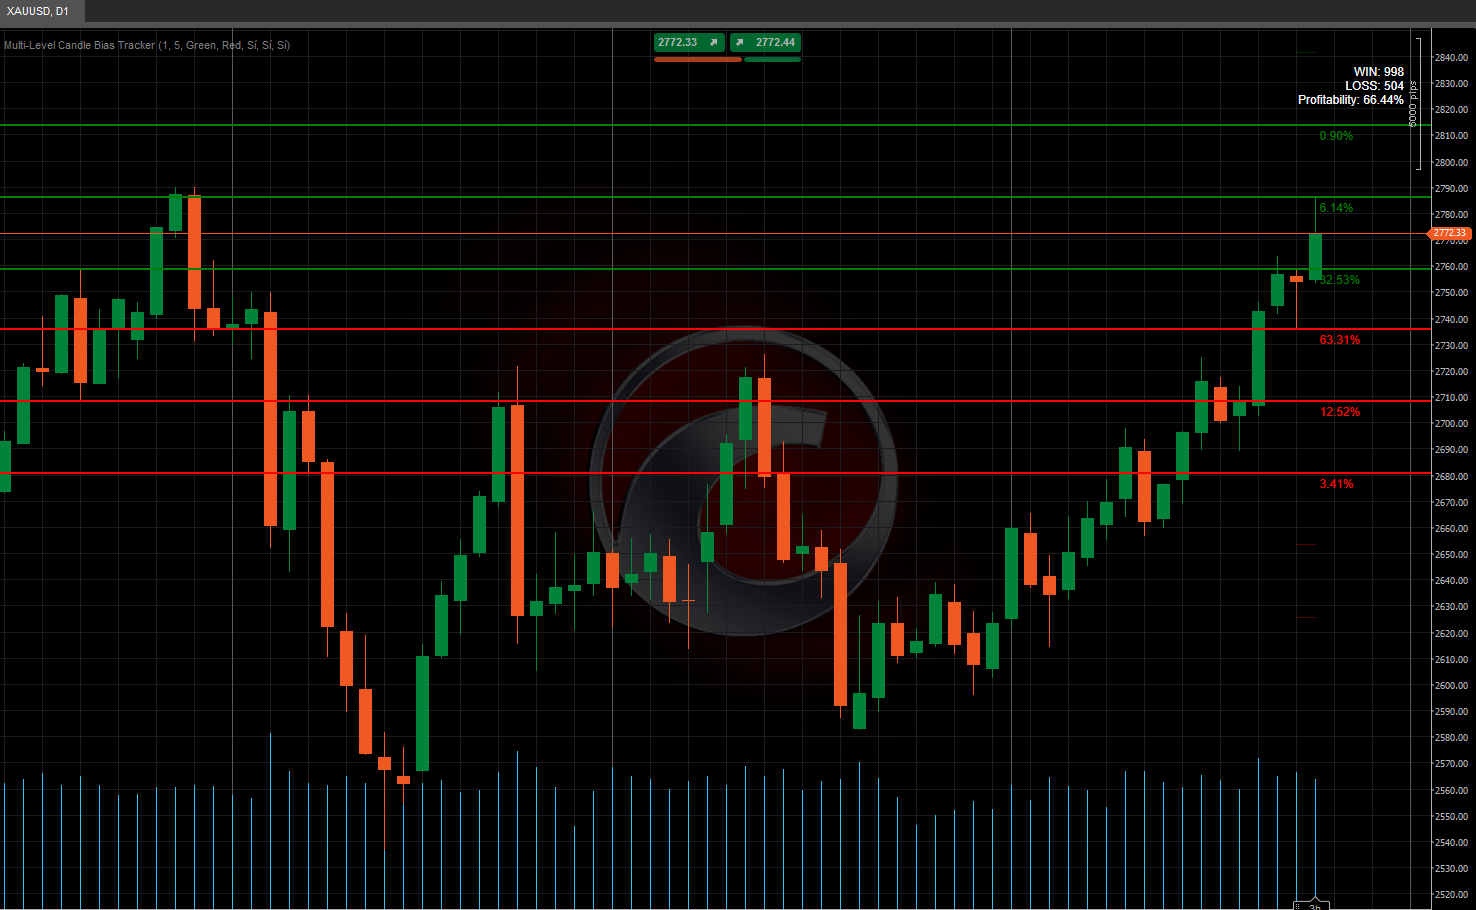
·     🔎 Multi-Level Candle Bias
Tracker

_______________________________________________

🔮 Prediction & Projection Tools

·     📐 Prediction Based on Linreg& ATR

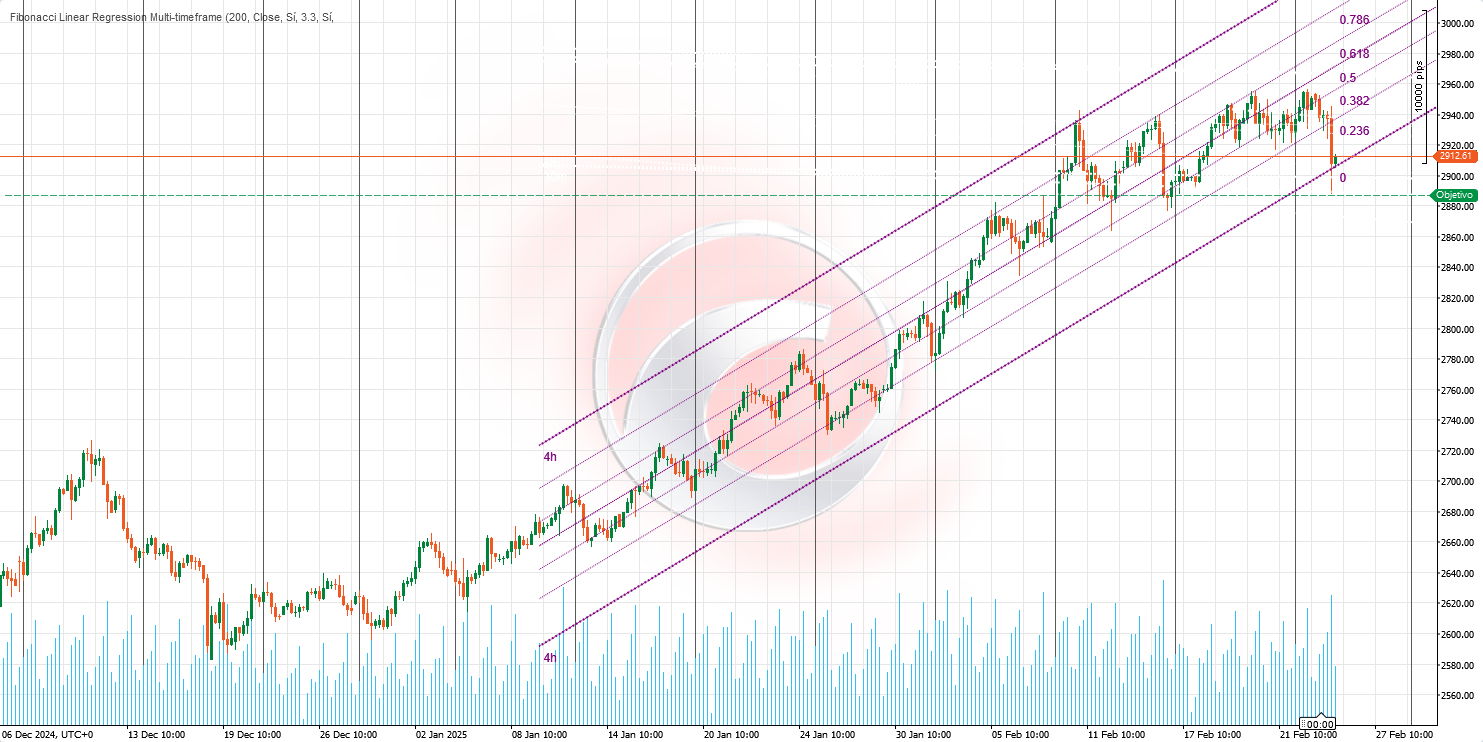
·     📏 Fibonacci Linear RegressionMulti-timeframe

·     📈 Volume-Powered Market Flow Projector

______________________________________________________________________________________________

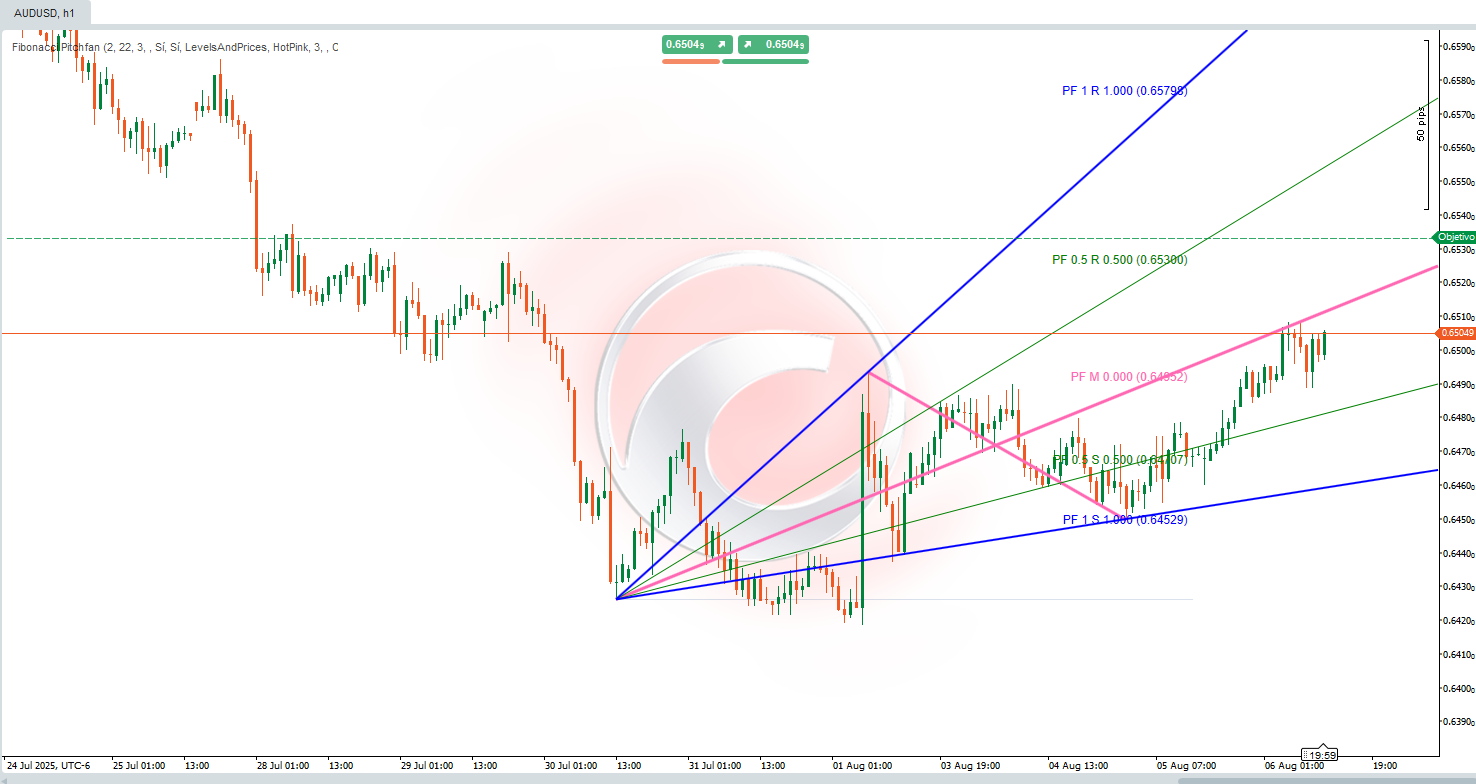
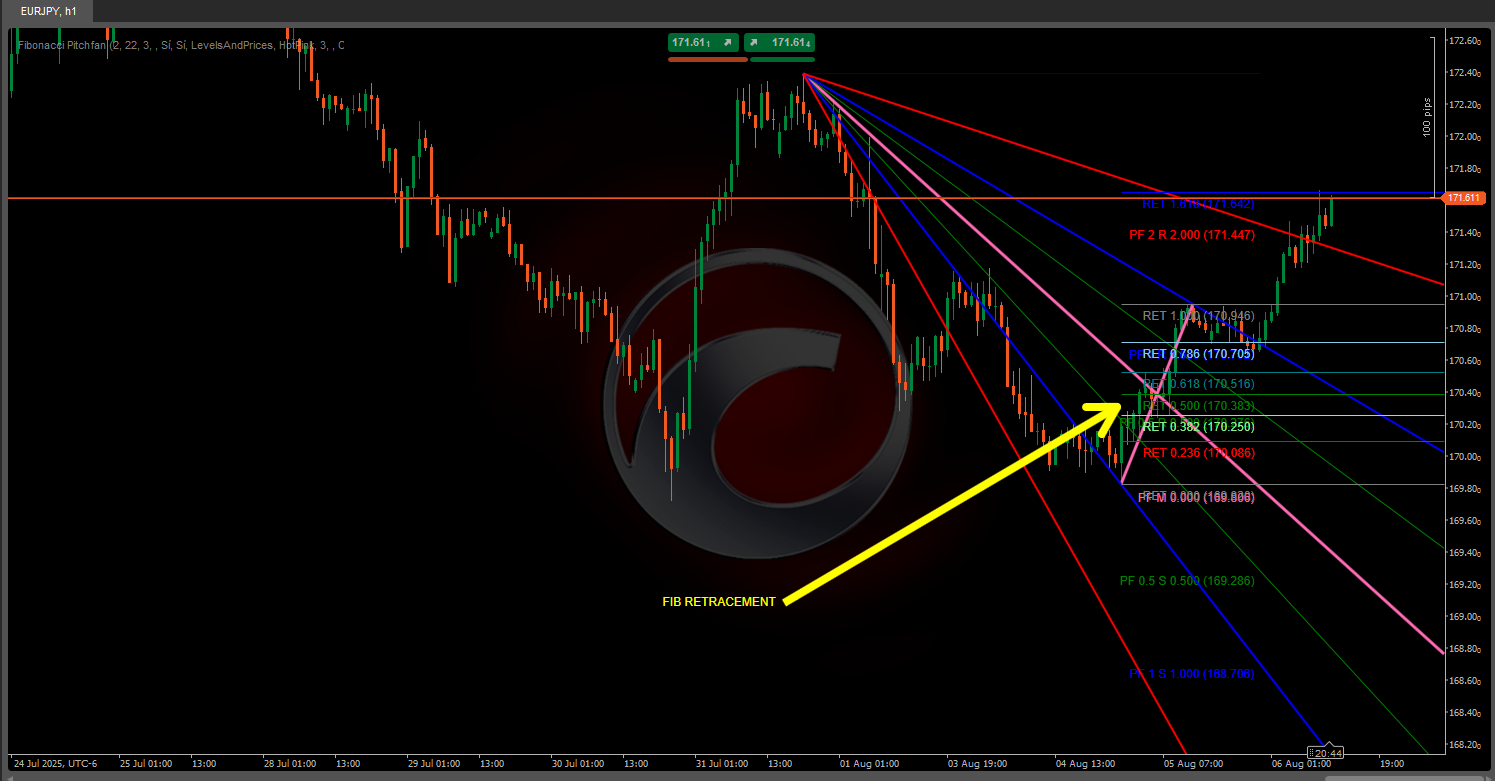
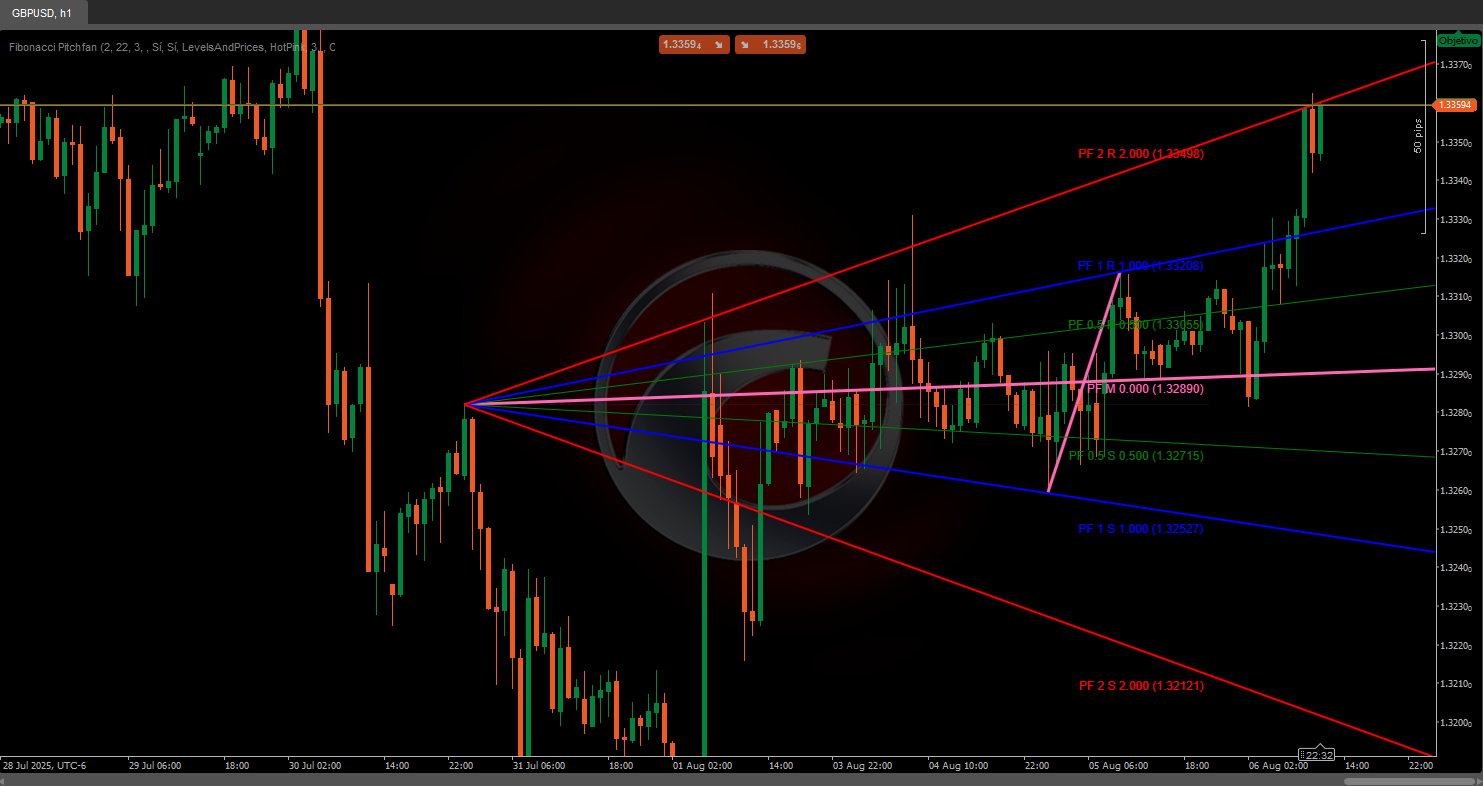
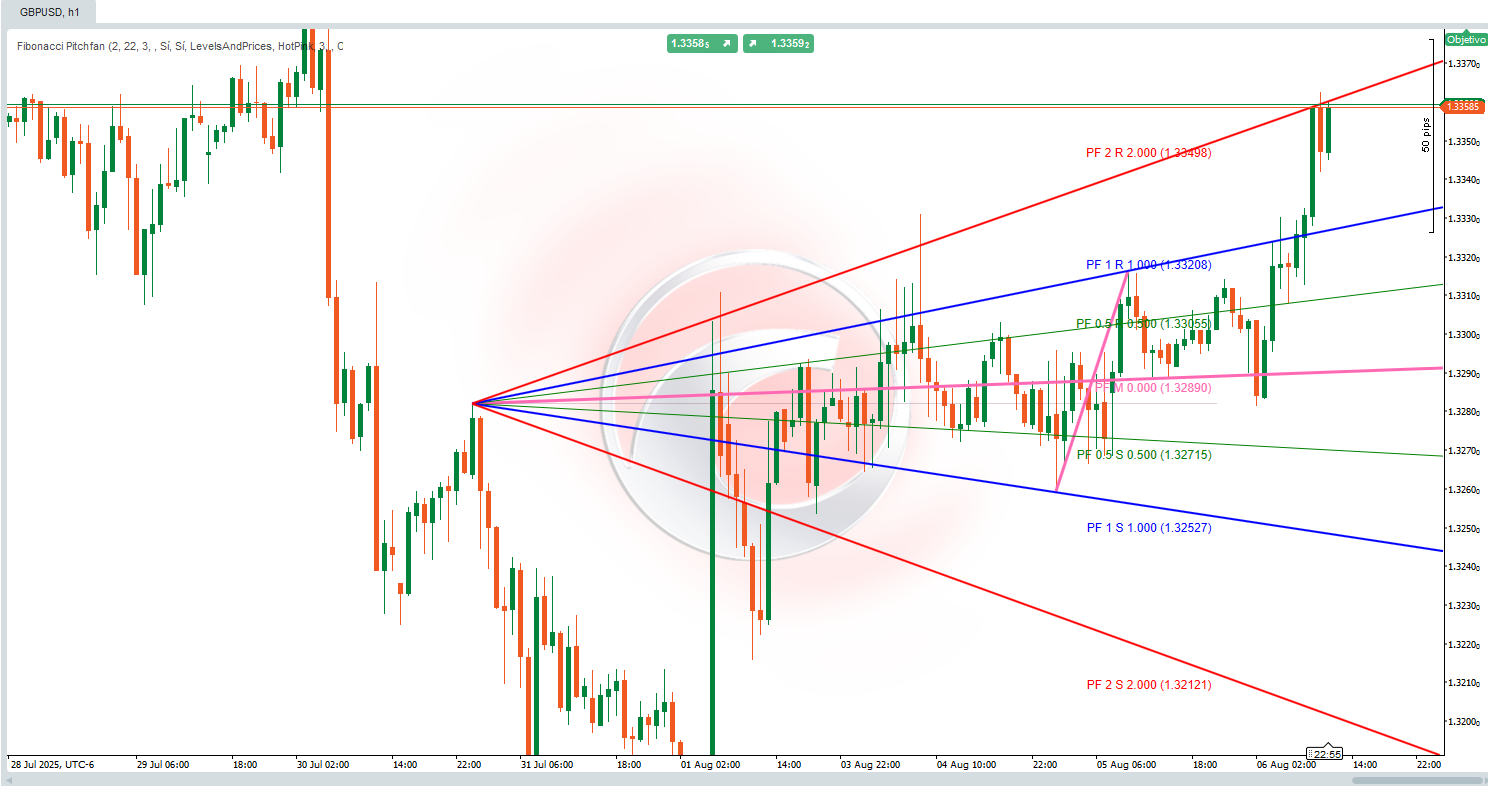
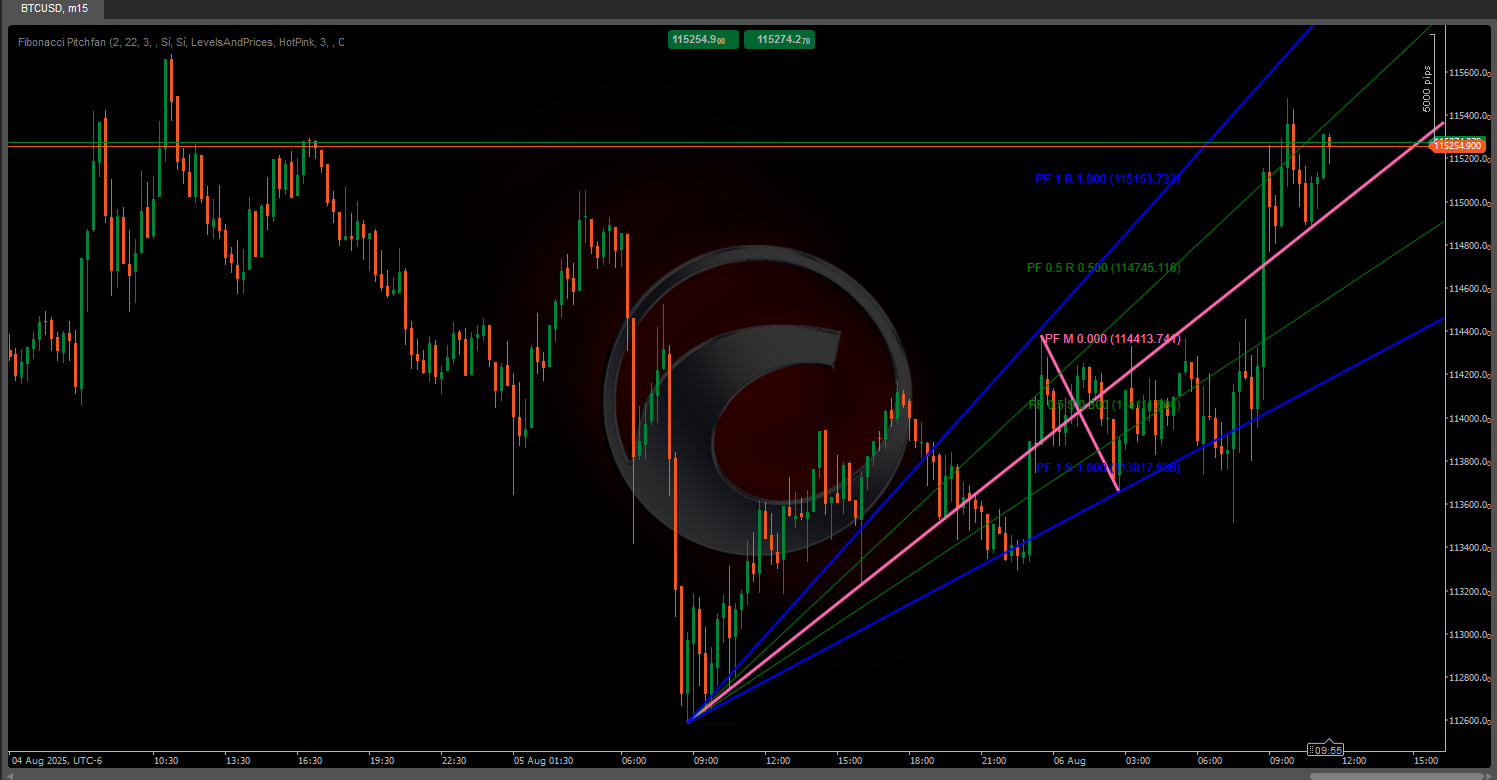
Fibonacci Pitchfan 📊✨

An advanced technical indicator that combines pivot detectiondynamic trendlines, and Fibonacci levels to create a visual tool helping traders identify trends, support/resistance zones, and potential reversal points. 🎯 Highly customizable, it adapts to different trading styles via configurable parameters. Below is a breakdown of its logic and calculations.

Core Components 🔧

The indicator relies on three key elements working together:

1. Pivot Detection 🔄

  • Identifies key price reversal points (high/low pivots).
  • Uses a user-defined bar range (pivot depth) to determine if a bar is a significant high/low vs. surrounding bars.
  • Filters noise by requiring pivots to exceed an ATR-based deviation threshold, ensuring only relevant price swings are considered.

2. TrendFan & Fibonacci Levels 📐

  • Projects a fan of dynamic trendlines from a historical pivot into the future, using predefined levels (e.g., 0.25, 0.5, 1.0) to mark potential support/resistance.
  • Optional Fibonacci levels (horizontal lines) highlight retracement/extensions between key pivots.

Calculation Logic 🧮

1. Pivot Identification

  • For each bar, the algorithm scans a symmetrical range of prior/following bars (based on pivot depth).
  • high pivot is confirmed if the bar’s high is the highest in the range; a low pivot if its low is the lowest.
  • The deviation threshold (a % of ATR relative to price) filters out minor fluctuations, focusing on meaningful market moves.

2. TrendFan Generation 🌪️

  • reference historical pivot (configurable) is paired with the latest pivot to form a baseline.
  • median line is drawn between them, and projected trendlines (at predefined levels) extend into the future, creating a "fan" of key price zones.

3. Fibonacci Projections 🔢

  • Retracement levels (e.g., 0.236, 0.5, 0.618) mark potential pullback areas within the prior price move.
  • Extension levels project price targets beyond the initial range, adjusted for trend direction.
  • Levels can be inverted or extended based on user settings.

Customizable Settings ⚙️

  • Deviation Threshold: Adjusts sensitivity to price moves (ATR-based).
  • Pivot Depth: Defines the bar range for pivot detection (affects signal frequency).
  • Historical Reference: Sets how far back the initial pivot is selected for the TrendFan.
  • Visibility: Toggles TrendFan/Fibonacci display and selects specific levels to show.

Conclusion 🏆

The Fibonacci Pitchfan is a powerful all-in-one tool for traders seeking a clear, dynamic view of market structure. By merging pivots, trendlines, and Fibonacci levels, it provides actionable insights to anticipate price movements and make informed decisions. 🚀


0.0
Reviews: 0
Customer reviews
No reviews for this product yet. Already tried it? Be the first to tell others!
More from this author
Indicator
RSI
Breakout
XAUUSD
+6
ZigZag
ZigZag filters noise, spots trends, patterns, pivots, aiding analysis, trade management, and confirmations. 📉📈
Indicator
RSI
Breakout
XAUUSD
+6
Order Block
Identify bullish and bearish Order Blocks to spot key support/resistance levels and potential trend reversals! 📈🔄
Indicator
RSI
Breakout
XAUUSD
+5
Auto-Trend Channel
Adaptive trend channel using linear regression and Pearson correlation for dynamic support, resistance, and trends.
Indicator
RSI
XAUUSD
Breakout
+5
BOS & CHOCH
Market structural patterns , specifically the concepts of Change of Character (ChoCH) 🔄 and Break of Structure (BoS) 💥
Indicator
RSI
Breakout
XAUUSD
+5
Zones Supply Demand
📊Zones Supply & Demand: Identifies key price levels with high volume concentration, marking Supply/Demand Zones & Marke
Indicator
RSI
Breakout
Supertrend
All Support and Resistance Levels
"Identify key market zones and visualize support/resistance from multiple timeframes on a single chart.
Indicator
RSI
Breakout
XAUUSD
+6
Volume POC Heatmap
📊 Shows volume by price levels, highlights POC, and key zones. Identifies dynamic support/resistance and imbalances.
Indicator
RSI
Breakout
XAUUSD
+5
Supertrend
💹 Define a price channel 📈 and determine trend direction (bullish 🟢 or bearish 🔴).
Indicator
RSI
Breakout
XAUUSD
+6
Fair Value Gap Sessions
identify and highlight temporary market inefficiencies known as "fair value gaps" 🚨 within specific trading Sessions.
Indicator
RSI
Breakout
XAUUSD
+4
Dynamic Market Structure Analysis of Turning Points
Identify market structure effortlessly with swing highs, lows, CHoCH, and BOS levels for smart trading decisions! 📊🔍"
Indicator
Indices
RSI
XAUUSD
+7
RSI Divergence
Detects bullish and bearish divergences
Indicator
RSI
Breakout
Supertrend
Trend Heikin Multi MA
🚀 TrendHeikinMultiMA: Advanced trend detection using Heikin-Ashi smoothing & MAs! Eliminates noise, confirms real trend
Indicator
RSI
Breakout
XAUUSD
+4
Multi-Level Candle Bias Tracker
Price direction by calculating the probability of reaching new highs/lows. Shows levels & stats📈
Indicator
RSI
Breakout
Supertrend
Leverage Liquidation Map
📊 Liquidation Map: Potential areas where highly leveraged investors might face liquidations.
Indicator
RSI
Breakout
Supertrend
Market Trend OB
Price action to detect when the market changes trend (MSB) and defines, order blocks , ZigZag etc.📊
Advanced Market Structure Bos,Choch,SwinLevels, Order Blog
Advanced price action tool that combines multiple technical analysis concepts
Indicator
RSI
Breakout
Supertrend
+3
Fibonacci Linear Regression Multi-timeframe
Combining Fibonacci levels and regression to analyze multidimensional market trends across multiple timeframes¡
Indicator
RSI
Breakout
Supertrend
Zig-Zag Extremity Tracker
Dynamically adjusts regression channels based on ZigZag extremes, resetting when price breaks bands to track real trends
You may also like
Order Block Detector SmartTrading
🎯 Order Block Detector - Smart Trading: Identifica bloques de órdenes clave en cTrader para un trading más inteligente.
BLOCK LIQUIDITY PRO
Block Liquidity,indicator.Block Order, Liquids Stops, Signal Sentiment,signal correctio.
Indicator
RSI
Breakout
Supertrend
TrendMaster Pro MultiMA
Connects each moving average value from candle to candle, forming a fan-like structure of trendlines.
FVG
The Indicator is a powerful tool for price-action traders seeking to identify and exploit short-term imbalances.
Session Highlight Framer
Frame the sessions
Renko Reversal
Renko Reversal catches powerful wick rejections on cTrader.
renko super scalping
Renko scalping indicator
Market Entropy
Market entropy + DC. Spot crystallization/chaos shifts with an optional on-chart overlay.
Supertrend TV
REAL Supertrend because default Ctrader Supertrend gives different signals
IR CheckList
you could put your check list in your chart you could split your test with “,” you could put your checklist in indicat
Indicator
NAS100
NZDUSD
XAUUSD
+13
MACD Crossover PRO
Customize the MACD! Choose colors, get real-time tick updates, and see crossover points for enhanced trading precision.
Risk Reward Guardian Scalping Swing Intraday Assistant
Trade fearlessly: auto-adjusts order blocks, manages risks, and ensures precision.
Smart Floating Risk Pro
📊 Smart Floating Risk Pro – Advanced Risk Management for cTrader
HeatMap Candle
HeatMap Candle
Indicator
VWAP
RSI
XAUUSD
+9
Turtle Soup ICT Strategy
Turtle Soup ICT Strategy – Detect liquidity traps & trade smart money moves with precision on cTrader.
xhobaniFX_ADR-Lines
xhobaniFX_ADR-Lines: Average Daily Range Horizontal Lines
Indicator
RSI
Indices
ATR
+3
Divergency 1.1_withSourceCode
🔍 Divergence Indicator for cTrader (Update v1.1)
MM-Symbol Info (free)
Enhance the trading experience with real-time Spread, Time To Close, rPNL, uPNL, PNL and minimalistic Bid / Ask lines