ADX and ADI
"ADX and ADI" logo
5.0
19/08/2025
48
Desktop
Since 21/02/2025
Traded volume
454.45M
Pips won
174.76K
Sales
3
Free installs
2906
"ADX and ADI" uploaded image"ADX and ADI" uploaded image

Key Features:

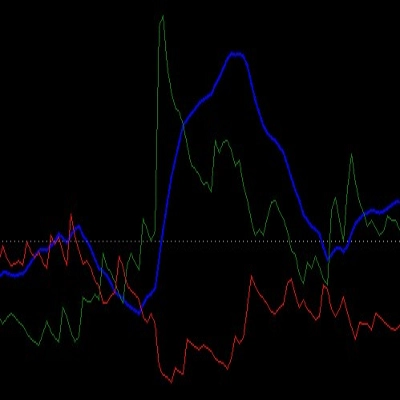
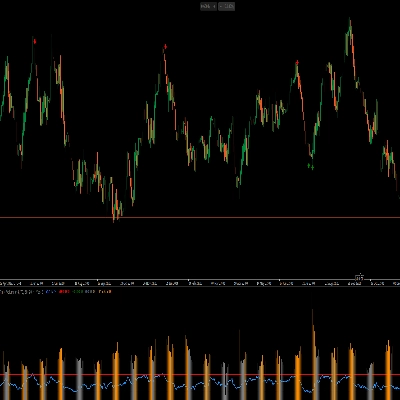
  • ADX and ADI Line (Blue): Shows the smoothed strength of the current trend, regardless of direction.
  • +DI Line (Green): Indicates the strength of upward movements.
  • -DI Line (Red): Indicates the strength of downward movements.
  • Threshold Line (Gray): A horizontal reference level (default 25) to help identify whether the trend strength is significant.

How It Works:

  1. The indicator calculates True Range (TR), Positive Directional Movement (+DM), and Negative Directional Movement (-DM).
  2. It applies Wilder’s smoothing technique to compute the smoothed values of TR, +DM, and -DM.
  3. From these, the Directional Indicators (+DI and -DI) are derived, showing which side (bullish or bearish) has stronger momentum.
  4. The DX (Directional Index) is calculated from the relative difference between +DI and -DI.
  5. Finally, the ADX (Average Directional Index) is computed as a smoothed version of DX, providing a measure of overall trend strength.

Interpretation:

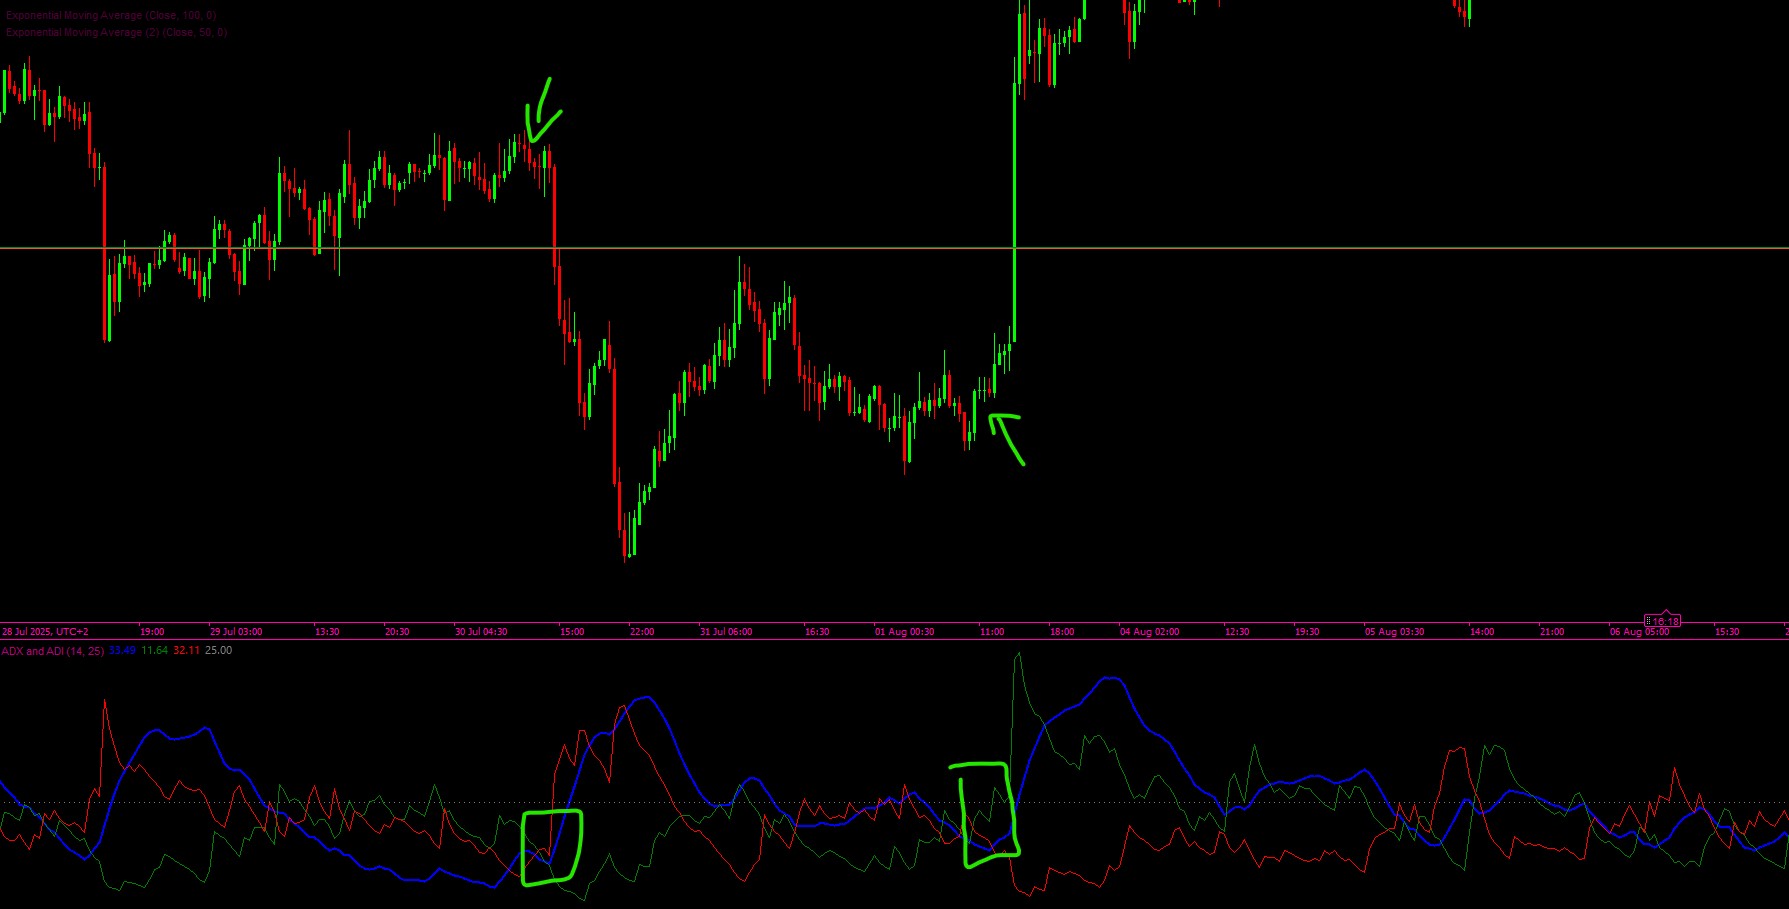
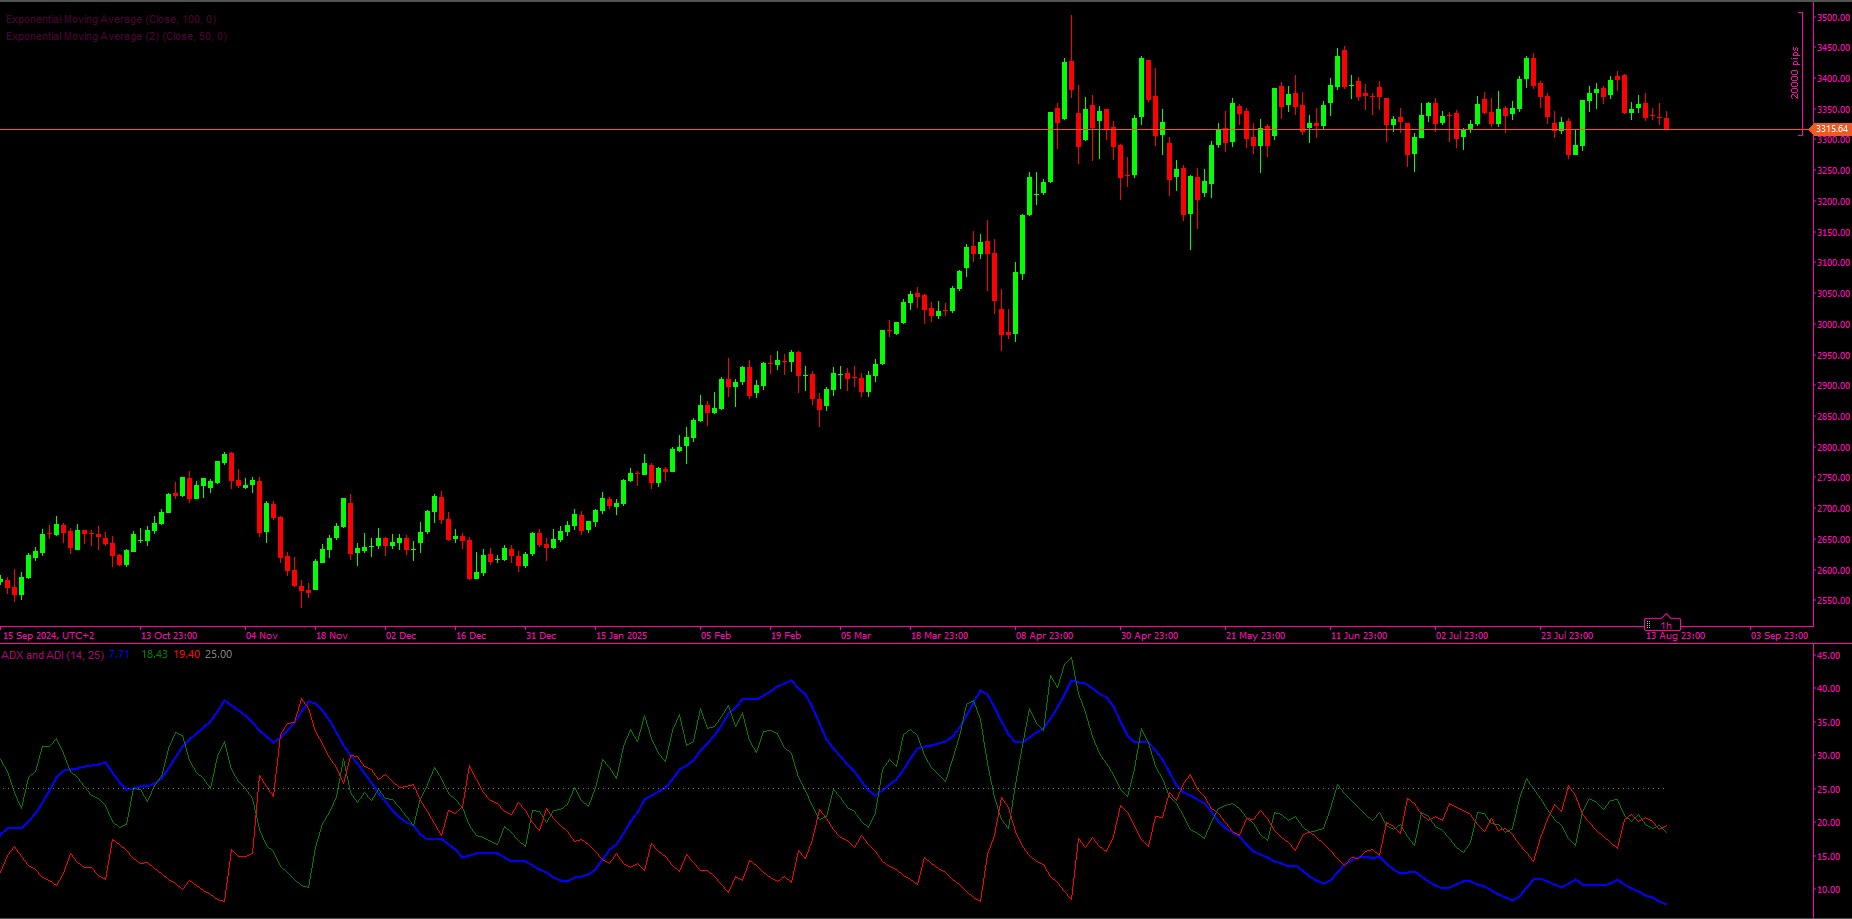
  • When ADX is above the threshold (e.g., 25), the market is considered to be trending strongly.
  • When +DI > -DI, bulls are in control (uptrend).
  • When -DI > +DI, bears are in control (downtrend).
  • When ADX is below the threshold, the market is considered to be ranging (weak or no trend).
5.0
Reviews: 1
5
100 %
4
0 %
3
0 %
2
0 %
1
0 %
Customer reviews
September 12, 2025
More from this author
Indicator
RSI
Indices
Forex
+3
ScalpingSignals9000
High-probability trading signals in the fast-paced world of forex and CFD trading.
Indicator
Indices
Prop
ATR
+4
TrendPulse
BrickAlgo TrendPulse is an advanced technical analysis tool that combines multiple indicators with filterin mechanisms.
Indicator
RSI
Indices
Signal
Rsi + Volume
This indicator combines RSI (Relative Strength Index) with volume analysis to generate more reliable trading signals.
SmartArrows AI V2
High-Performance Renko Chart Indicator with Advanced AI Filtering.
Indicator
Signal
Scalping
9-5-3 Trading Strat
Enhance Your Trading Strategy with the Larry Williams 9-5-3 Indicator
Indicator
Stocks
Forex
Signal
+1
Engulfing Pattern Indicator
EURUSD Breakout Indicator
Breakout Multi-Timeframe Strategy Indicator
Indicator
RSI
Signal
MA-RSI HTF Confirmation
MA-RSI HTF Confirmation: Eliminate false signals and trade with confidence!
Indicator
Stocks
Forex
Crypto
PinBarCandlestickPattern
PinBarCandlestickPattern Indicator
Indicator
Signal
Hammer Pattern Indicator
Indicator
Prop
Commodities
Stocks
+2
Light-Version BrickAlgo TrendPulse
🚀 Simplify Your Trading Decisions With Powerful Technical Analysis.
Renko Moving Average Cross Indicator
The Renko Moving Average Cross indicator combines classic EMA crossover signals with Renko-filtered prices.
Indicator
Signal
MACD
USDJPY
PulseTracker
Version 1.2: Advanced Trend Detection & Visualization System
cBot
Forex
Signal
MACD
SwingStratH6
Smart Trend cBot - Swing6h
Indicator
Forex
Signal
MACD
swingh6
Swing-Trading Indicaotr for pairs like EUR/USD, AUD/USD, and USD/JPY. Most effective on higher time frames H4,H6,H12...
You may also like
Indicator
RSI
XAUUSD
ATR
+3
RSI NextGen
The RSI NextGen is an advanced and modernized version of the classic Relative Strength Index (RSI)
Indicator
Stocks
Forex
MACD
+1
SmartBot-Volume MACD
a revolutionary indicator that integrates volume into MACD.
Indicator
Indices
RSI
StochasticRSI
Stochastic RSI (StochRSI) is a technical indicator used to measure the strength and weakness of the RSI.
Indicator
Indices
Prop
Commodities
+4
Pivot Point Smart Money Concept
Transform your approach to trading with our innovative Pivot Point Indicator.
Indicator
XAUUSD
Commodities
Forex
+5
BullBear Dynamics
BullBear Dynamics helps traders detect and interpret the balance between bullish and bearish momentum
mIntrinsicRecursiveValue
Intrinsic Recursive Value Indicator
ictkillzonesfromnovem
ICT ALL KİLL ZONES, LONDON , ASİA, NY AM, NY LUNCH, NY PM
Indicator
Signal
MACD
MacD Custom Indicator Multi Time Frame
MacD Custom Indicator-Multiple Time Frame+All Available Options!
Indicator
NAS100
NZDUSD
XAUUSD
+11
ADXVMA Aurora Trend Filter
⚡ ADXVMA Aurora Trend Filter combines ADX trend strength with an adaptive EMA blend ⚡
Indicator
Indices
Commodities
Stocks
+2
XY Bar Info Panel v1.5
Overlay panel showing bar date/time, OHLC, tick Volume, percent change, and market session - fully customizable.
period seperate
daily period separate indicator.
Indicator
NAS100
NZDUSD
XAUUSD
+14
Order Block Scanner by PrimeQuant
Smart institutional order block & FVG scanner with alerts, zone merging, and HTF confluence.
SmartArrows AI V2
High-Performance Renko Chart Indicator with Advanced AI Filtering.
Indicator
NAS100
NZDUSD
Martingale
+26
ICT Killzones
ICT Killzones plots Asian, London & New York trading sessions on your cTrader charts with clear zones & labels.
Momentum Trend Analyzer
Provides comprehensive trend and momentum analysis by combining EMAs, RoC, normalized ATR, RSI, and volume..
Indicator
Breakout
BreakOut_Probability_Expo
Break Out Probability Experimental indicator. Credits for this indicator goes to Zeiierman !!!
Blocks Liquidity MGC
BlocksLiquidity Indicator Analysis!