VolumeThermometer
"VolumeThermometer" logo
22/08/2025
63
Desktop
Since 26/05/2025
Sales
3
Free installs
108

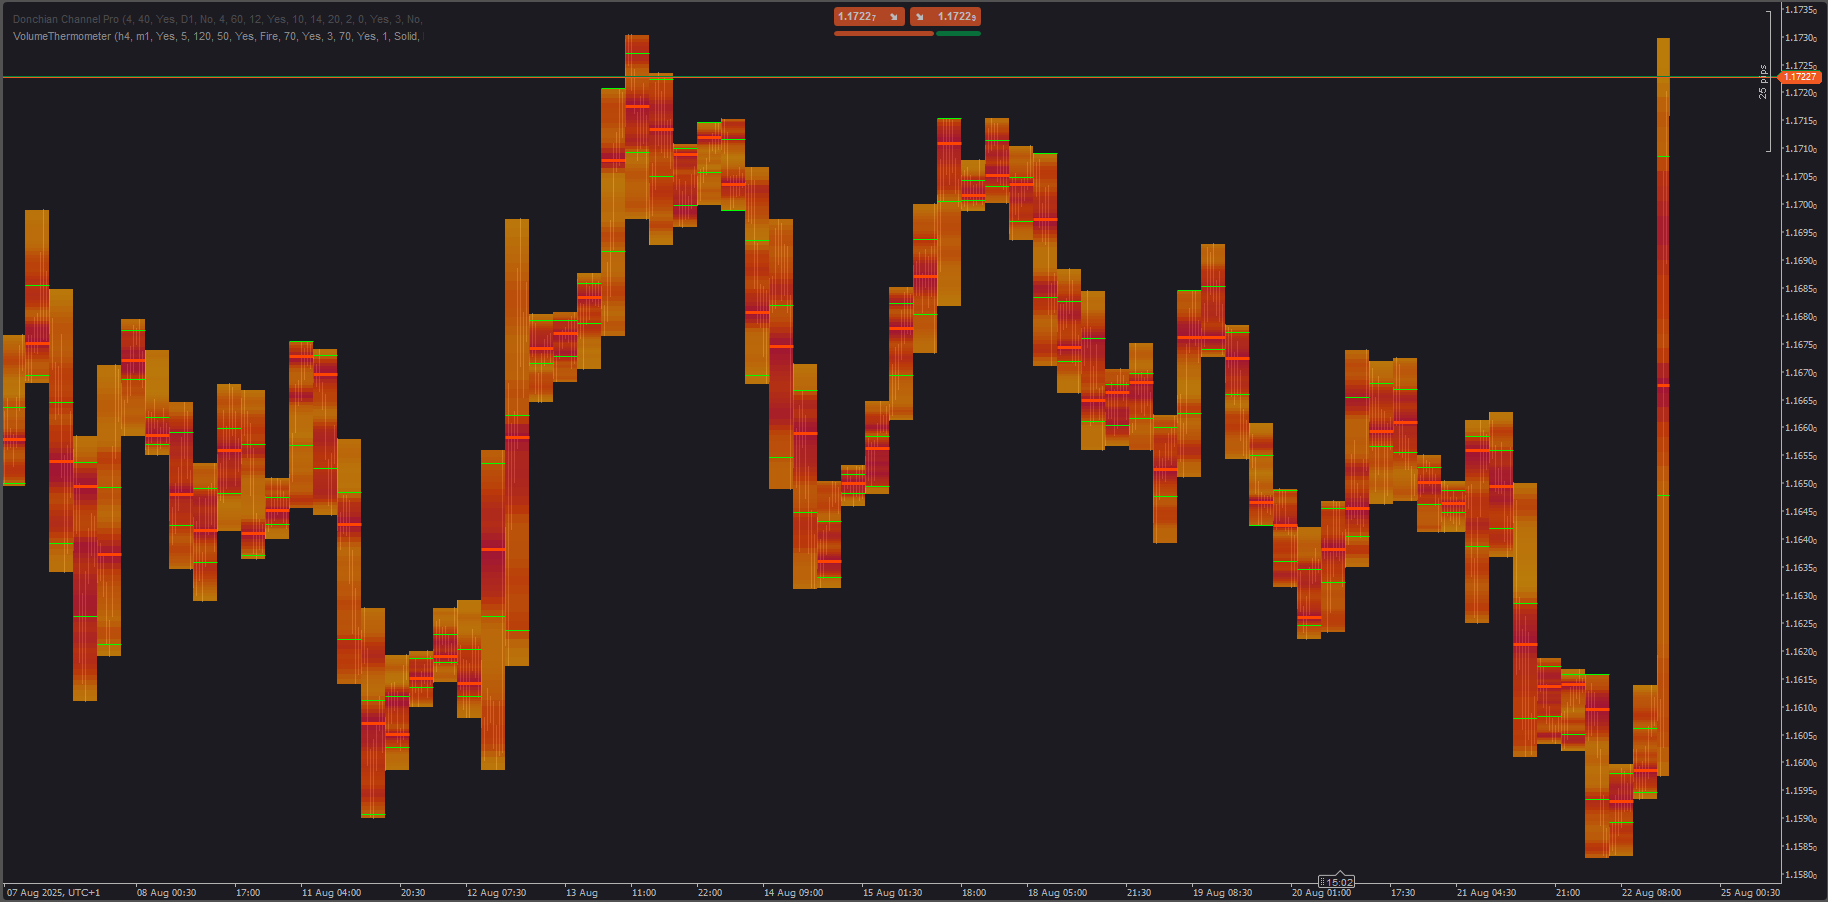
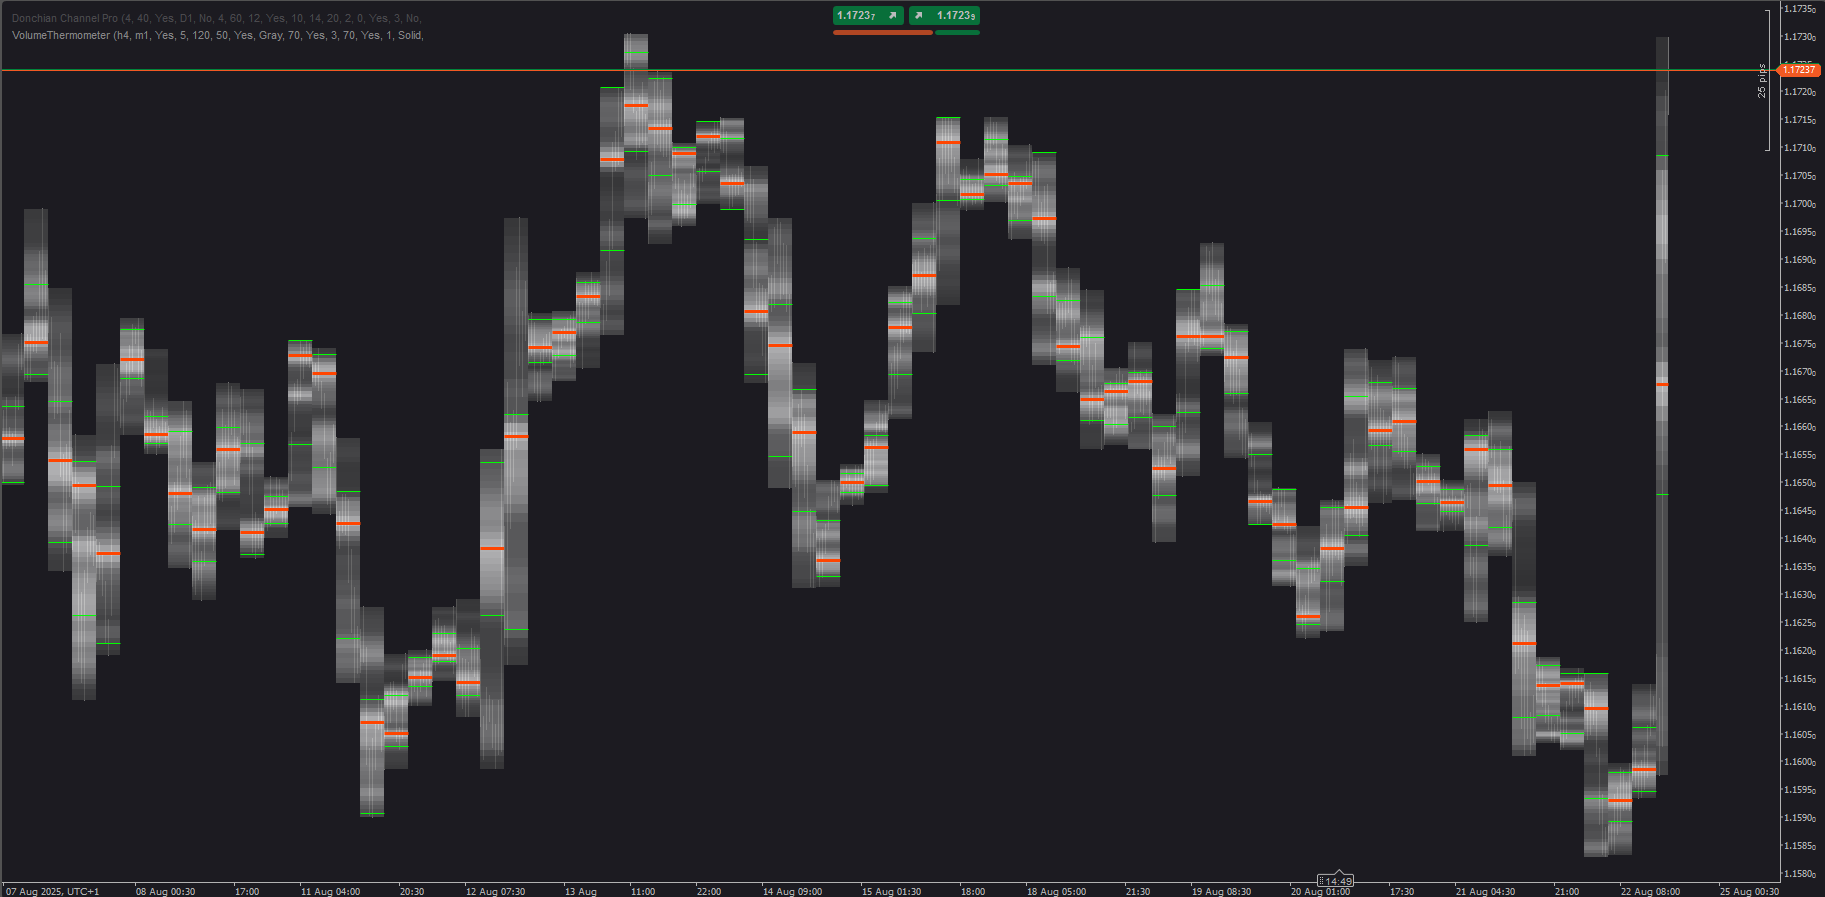
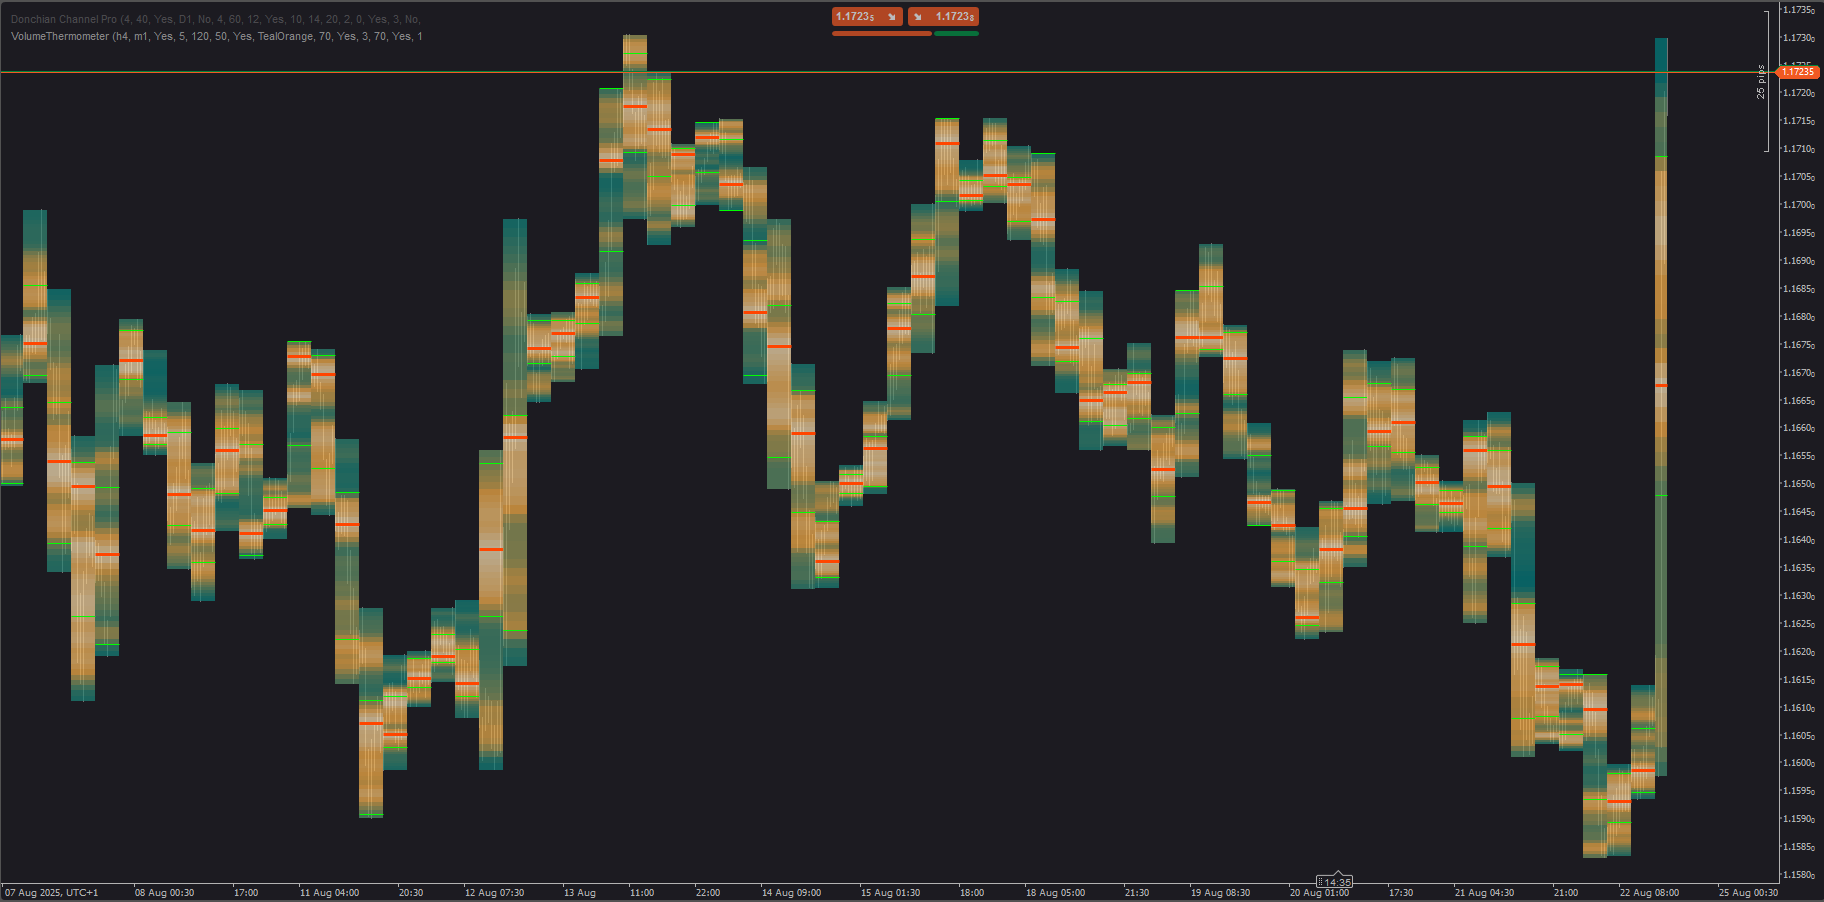
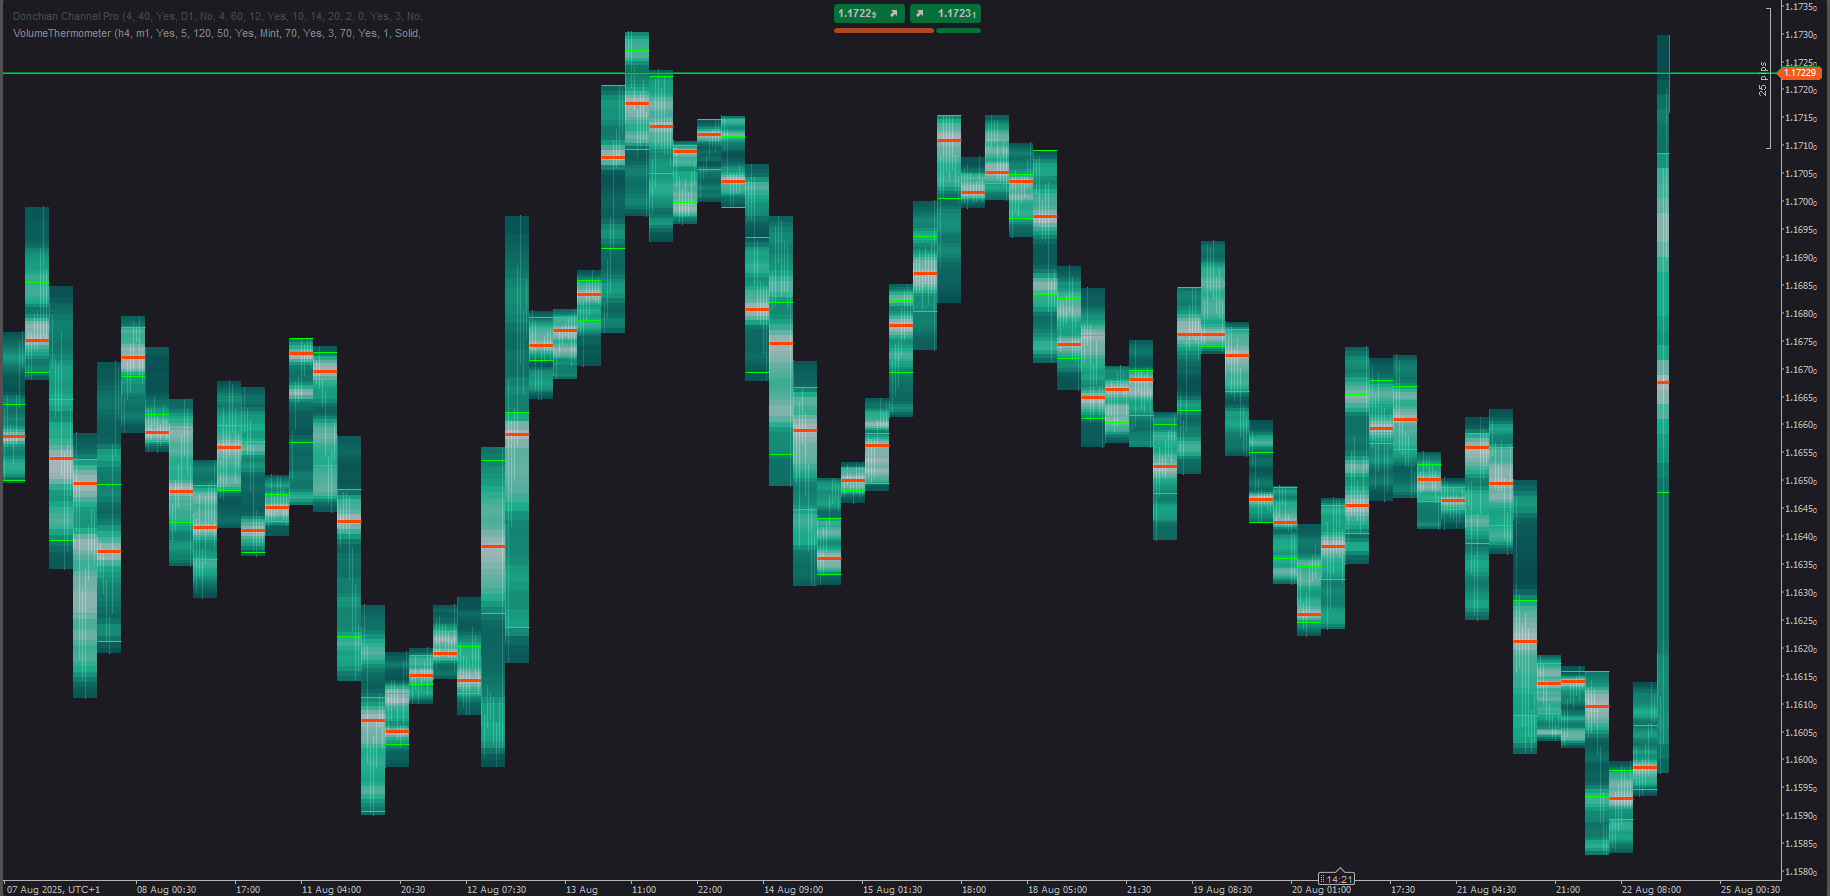
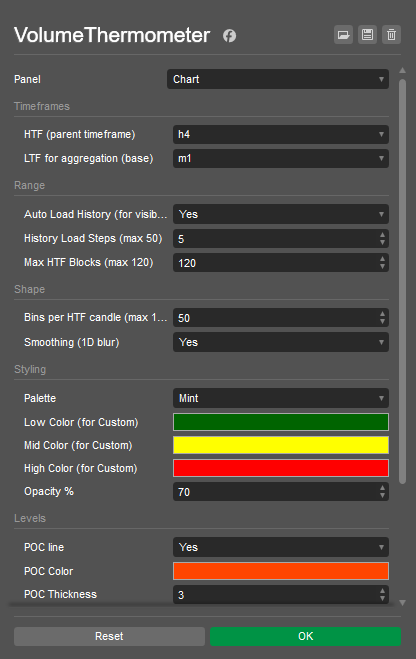
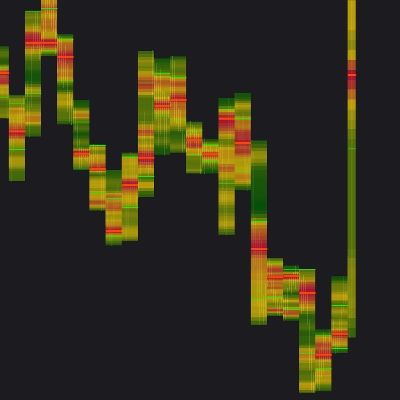
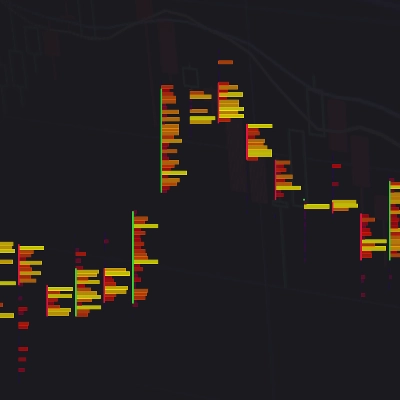
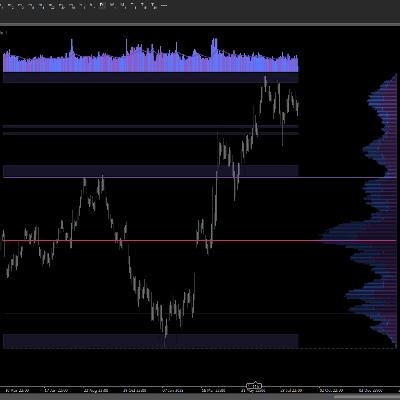
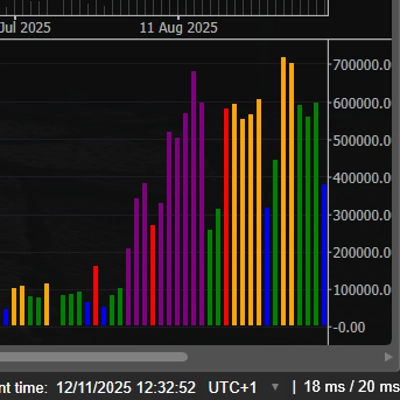
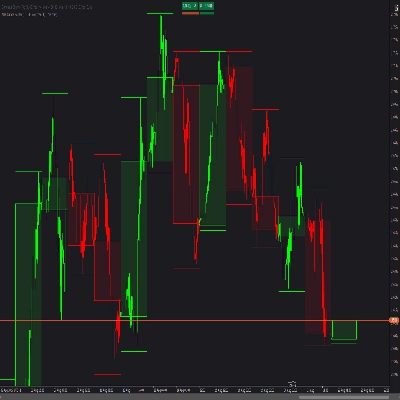
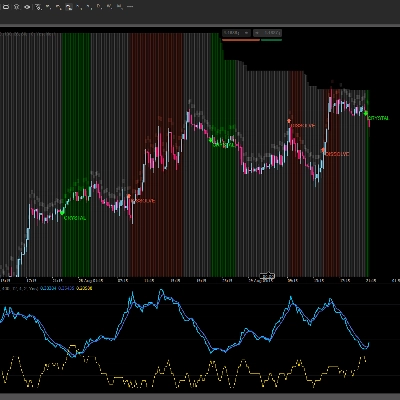
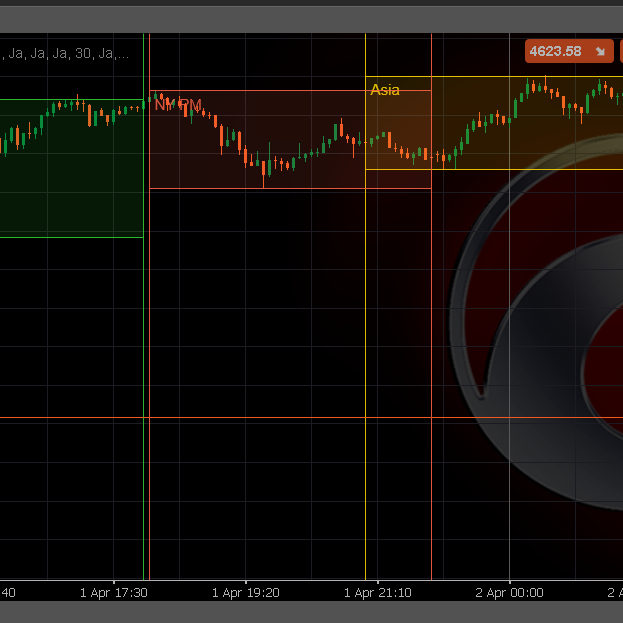
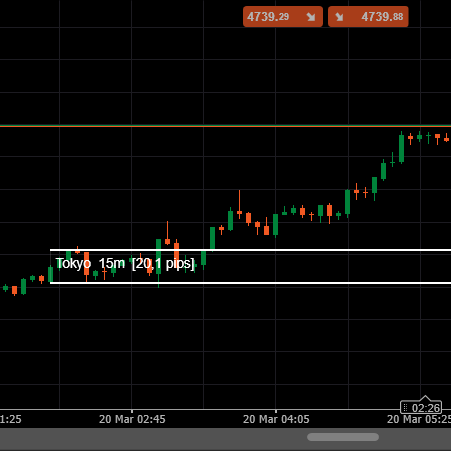
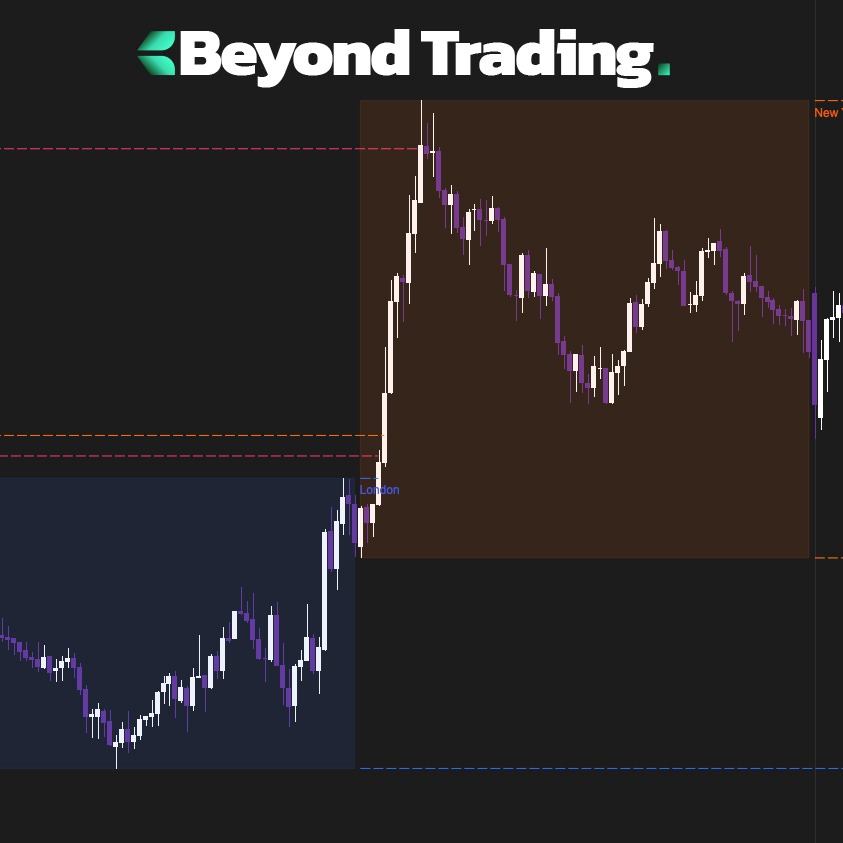
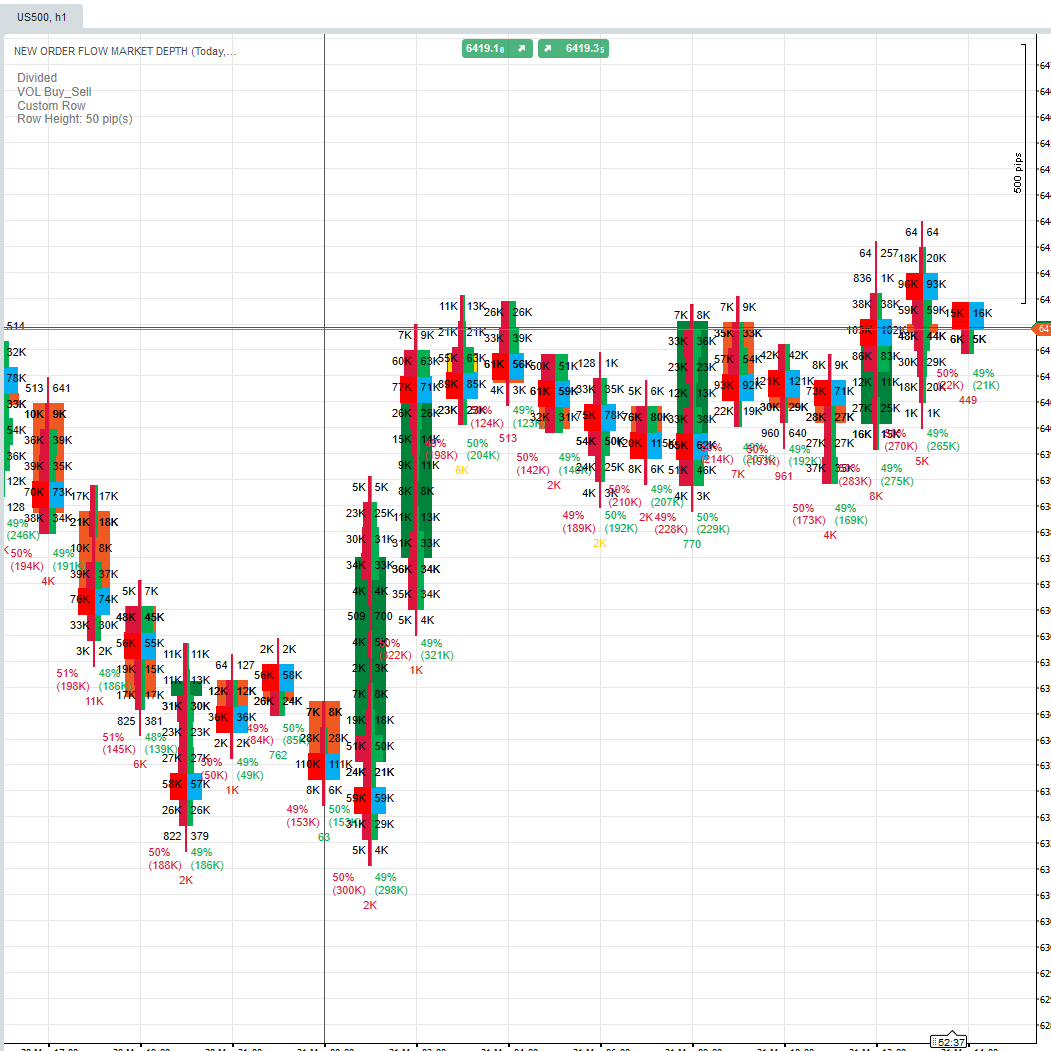
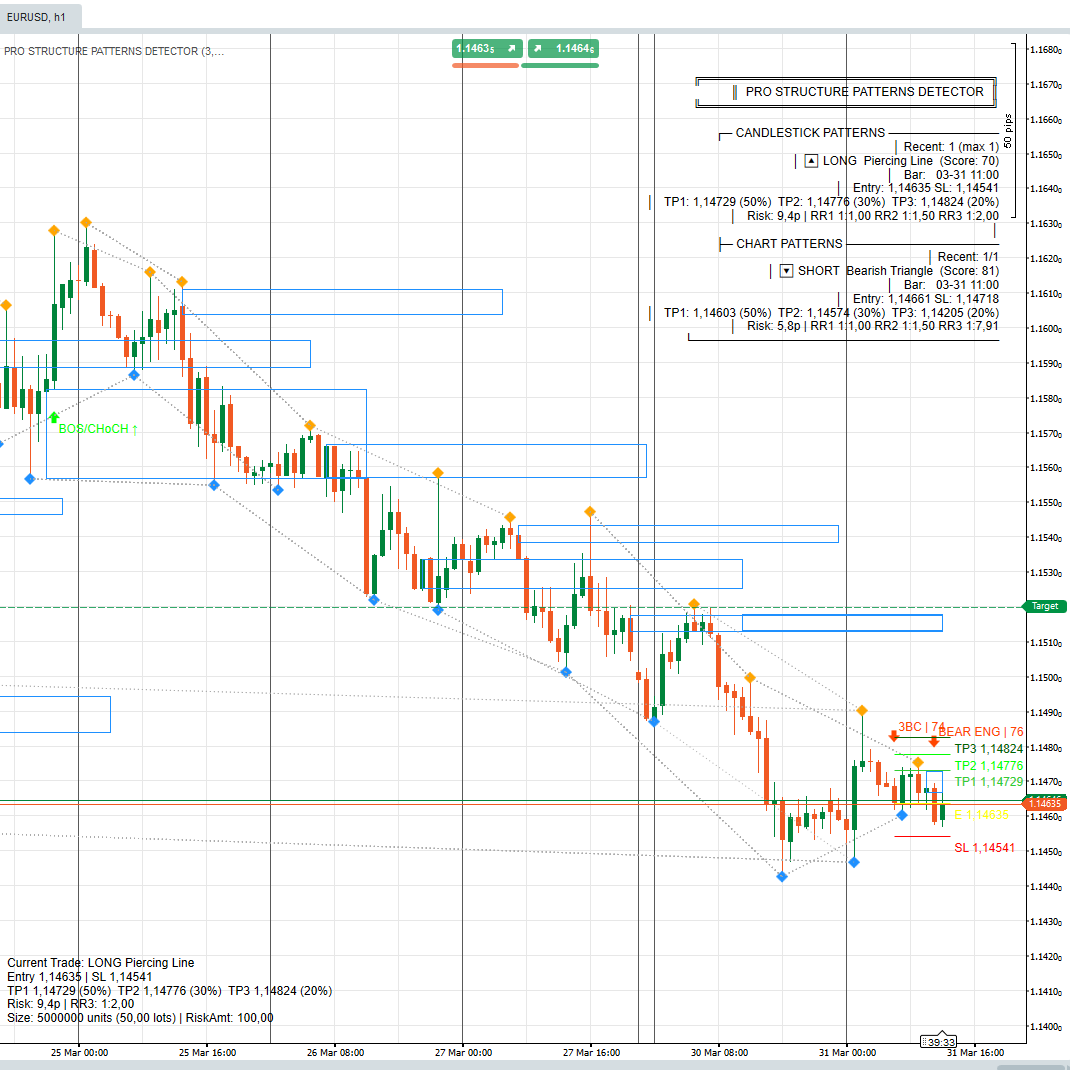
A cTrader heatmap that shows how volume is distributed inside each HTF candle. It uses LTF bars (e.g., M1) to build vertical volume bins, then draws POC and Value Area (VA) lines. The current (unfinished) HTF candle is painted in real time.

How it works

  • Aggregates tick volume from LTF bars.
  • Splits each HTF candle into
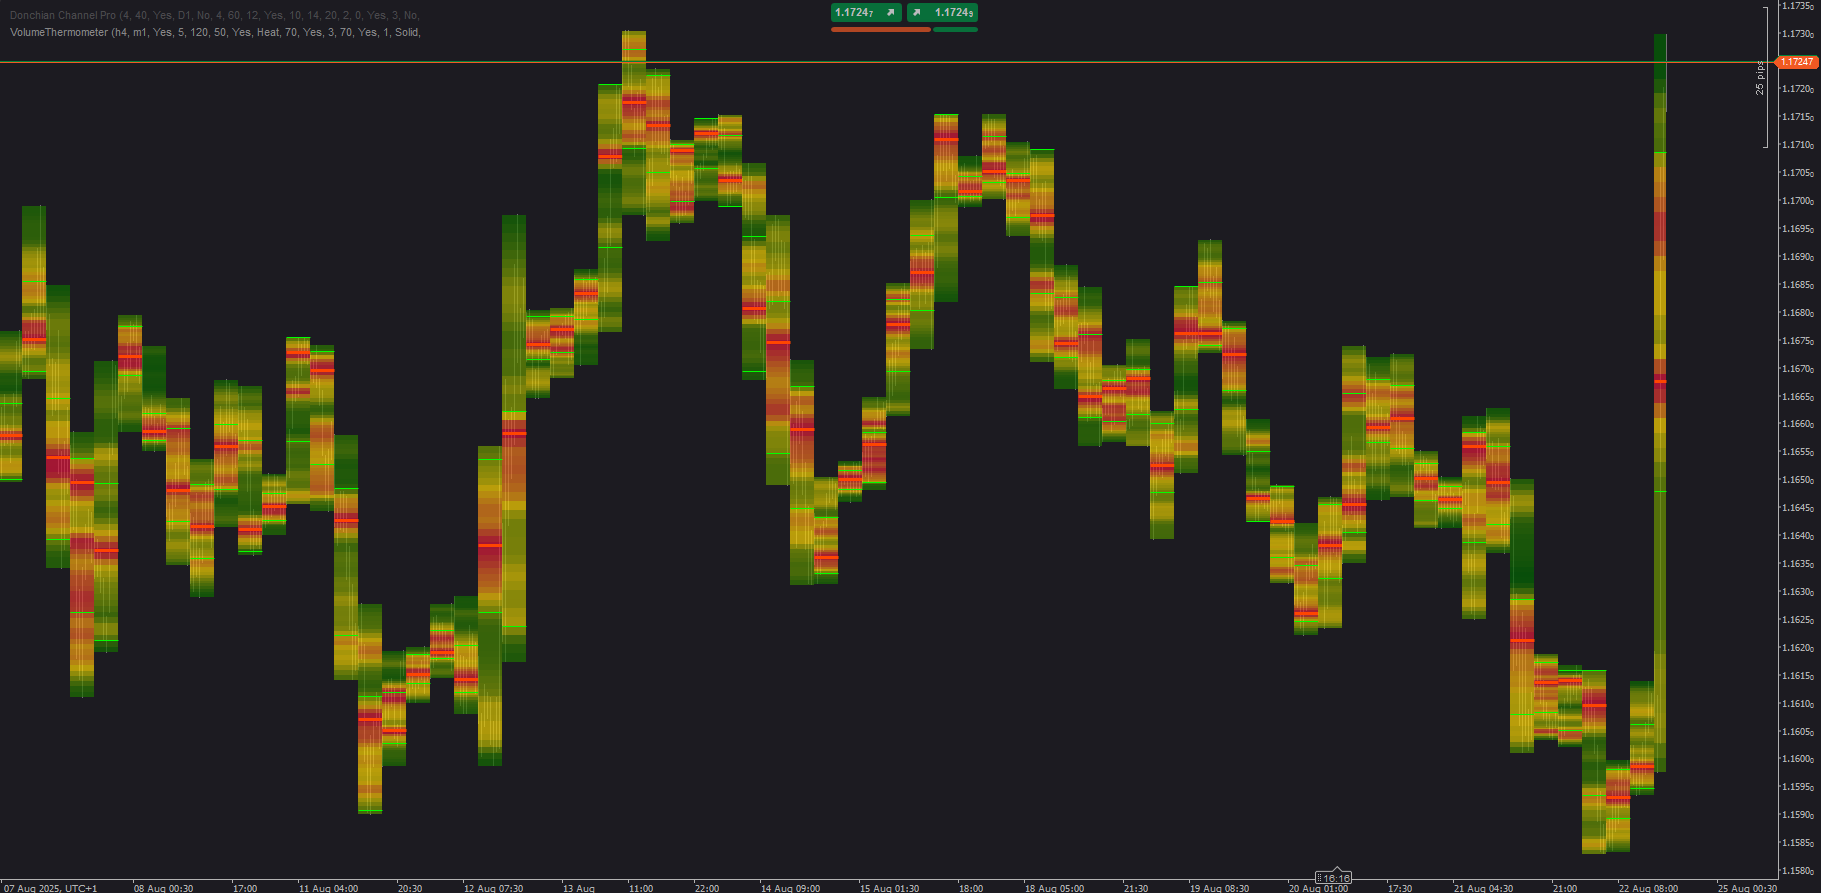
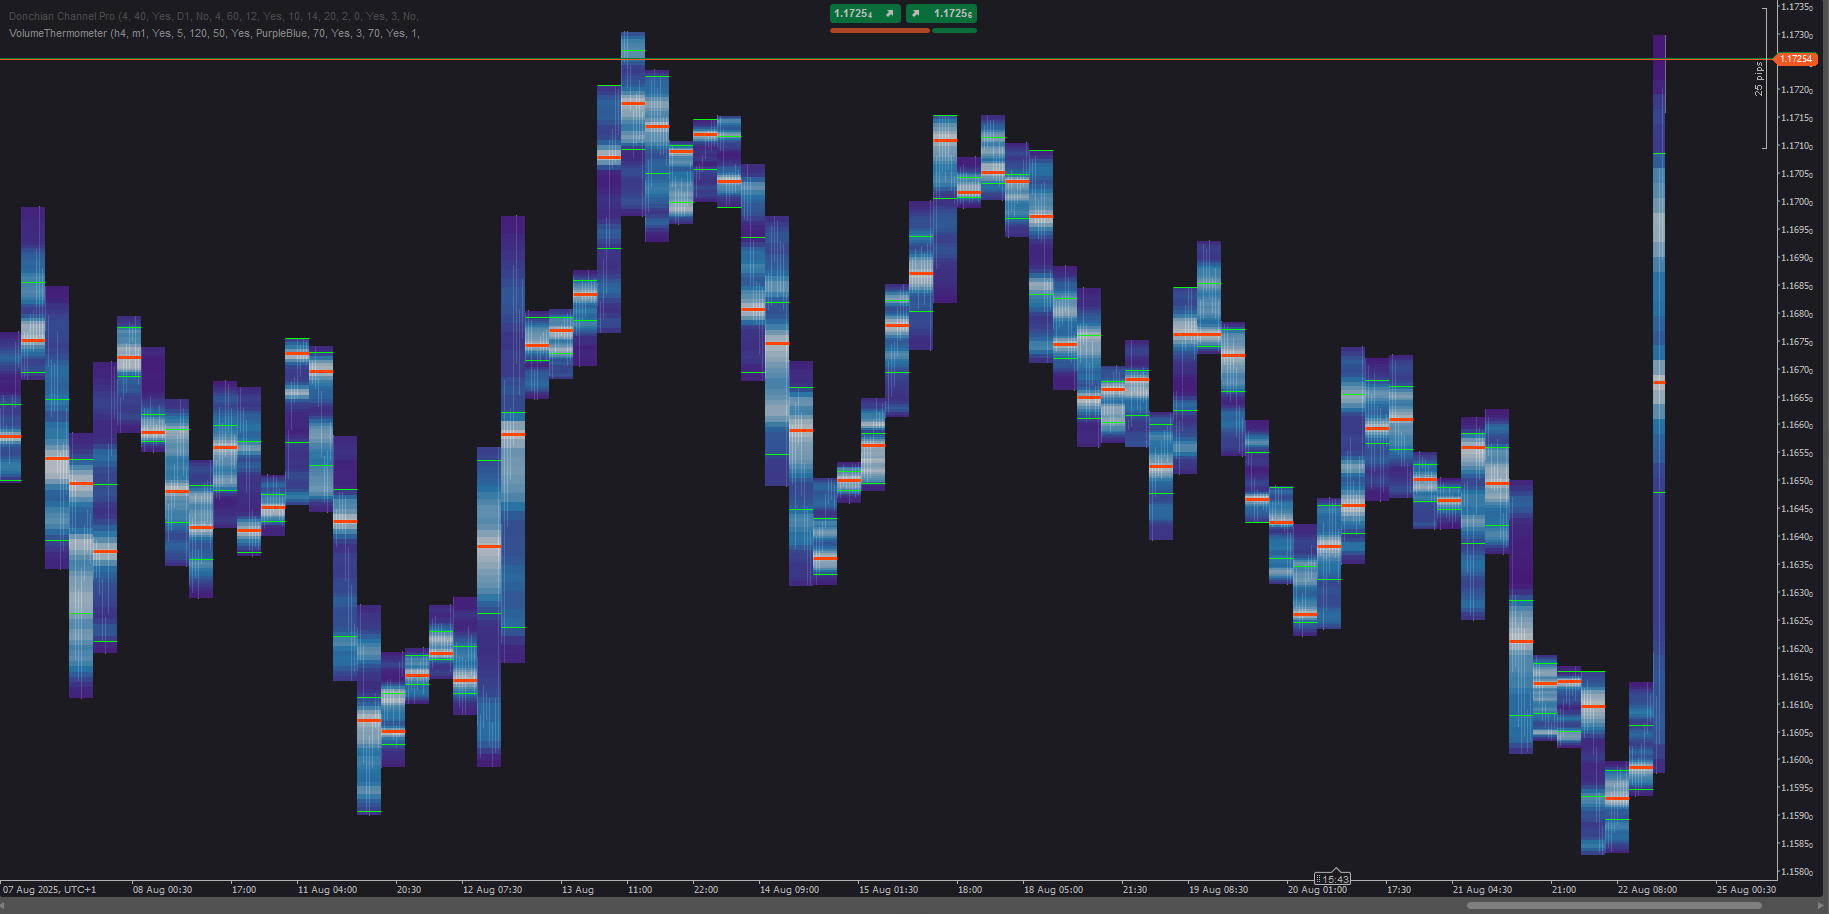
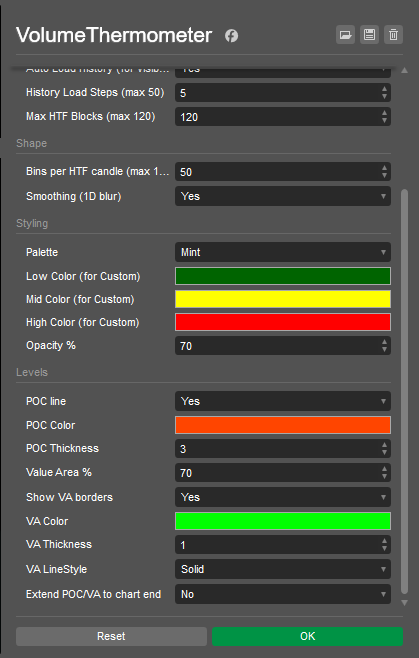
 Bins price slices and assigns volume by price overlap.
  • Colors bins by relative volume; draws POC, optional VA lines, and can extend them to the right.
  • Auto-loads older history for the visible range only (small batches).

Use it

  1. Pick HTF (e.g., H4) and LTF (e.g., M1).
  2. Enable Auto Load History; scroll/zoom to the range you want.
  3. Tune Bins (detail), Max HTF Blocks (how many candles to show), Smoothing, Opacity, and colors.
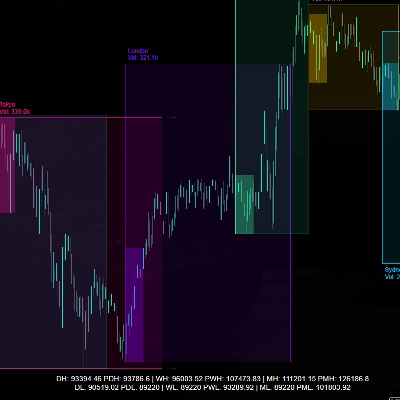
  4. Watch POC/VA reactions and how POC migrates candle to candle.

Quick ideas

  • POC retest: first touch of prior POC with LTF confirmation.
  • VA rotation: re-entry into VA often targets POC/other VA edge.
  • LVN pass-through: thin (cold) areas tend to move fast to the next node.

Notes

  • Uses tick volume (good proxy on FX/CFD, not exchange volume).
  • For performance, reduce Bins or Max HTF Blocks if needed.
More from this author
Market Entropy
Market entropy + DC. Spot crystallization/chaos shifts with an optional on-chart overlay.
Candles_Painter
Overlay HTF context on any chart: color bars by HTF and draw filled HTF bodies with optional High/Low lines.
Moving Average Plus
10 configurable moving averages: choose type, period, color per line; single price source for all.
Side Volume Profile
Right-anchored cTrader Volume Profile with VAH/VAL/POC, LVZ, top volume+EMA, themes, and fast, readable visuals.
Donchian Channel Pro
Tracks N-period highs/lows, HTF overlay, HUDs with ADX, RSI, session clocks. Customizable for precise trading.
TrendStrengthSignals
Edge-aware clouds + Pro HUD: better entries, calmer exits, adaptive risk.
You may also like
Indicator
NAS100
NZDUSD
XAUUSD
+13
ORDERFLOW_SKIA_Plynuly
This Indicator will show you Direction, Distance, and Time;
IR Macd + MacdLine
some user add moving average to macd to see better. in ctrader 4.3.11 there is a problem with this . I make a macd tha
Candle Timer & Strength Demo
Candle Timer & Strength DEMO for cTrader This is a DEMO version of the Candle Timer & Strength indicator. You can use al
Indicator
Indices
Prop
Stocks
+3
Smooth Heiken Ashi
The Smooth Heiken Ashi indicator is a refined charting tool designed to filter out market noise and highlight true price
Indicator
RSI
Breakout
Supertrend
Leverage Liquidation Map
📊 Liquidation Map: Potential areas where highly leveraged investors might face liquidations.
ICT Killzones & Macros
KILLZONES AND MACRO SESSIONS
Indicator
NAS100
Indices
Breakout
+6
cAlgoBuddy - Boxify
The purpose of the algorithm of the Boxify indicator is to try to put price action into zones, or better, boxes.
Block Order Rreversal
Order BlockIndicator reversal
IR Moving Average
 this moving include everything that a trader needs from Moving Average.
Supertrend Indicator v1.1
SUPERTREND INDICATOR v1.1
Indicator
Breakout
Forex
support and resistance
Support and Resistance Line Indicator with Higher Timeframe Filter
IR Slowing Moving
Add Slowing to IR Moving Average.
Indicator
Forex
Signal
MACD
swingh6
Swing-Trading Indicaotr for pairs like EUR/USD, AUD/USD, and USD/JPY. Most effective on higher time frames H4,H6,H12...
Indicator
RSI
ATR
Signal
+1
Trading Fusion Bars 2
This indicator works best as a trend-confirmation tool—wait for multiple signals!
Indicator
Bollinger
E7 Indicators Free Studies
ADXR, KDJ, SineWave, Bollinger Band Volatility and AEOscillator.
Indicator
Breakout
Pivot Points Daily Session
Pivot Point with base zone daily Asia-London-New york Session.
Indicator
Indices
Stocks
Forex
+2
HorizontalSupportResistance
This extraordinary multi-timeframe support and resistance indicator is nothing short of market wizardry.
VWAP Tank Btn
Custom Vwap Indicator