Indicator
Indices
Breakout
XAUUSD
Commodities
Stocks
Forex
Signal
Supertrend
GBPUSD
Crypto
BTCUSD
Scalping
Daily Weekly Monthly - Highs & Lows
"Daily Weekly Monthly - Highs & Lows" logo
21/09/2025
2
Desktop
"Daily Weekly Monthly - Highs & Lows" uploaded image"Daily Weekly Monthly - Highs & Lows" uploaded image"Daily Weekly Monthly - Highs & Lows" uploaded image

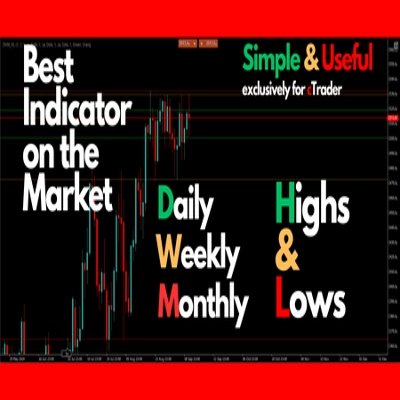
Daily/Weekly/Monthly - Highs & Lows Indicator:
This user-friendly indicator shows the high and low points of the last days, weeks, and months on your chart. In addition to the regular lines for the most recent period, you can add optional lines for previous days, weeks, and months, with full customization of colors and styles to suit your preference. It offers a clear visual representation of crucial support and resistance levels, helping you make informed trading decisions.

Features:

  • Displays the highs and lows of previous days, weeks, and months.
  • Customizable line colors and styles for additional periods.
  • Simple, clean design perfect for traders who prefer an uncluttered chart layout.
  • Supports multiple time frames and provides valuable insights into historical price levels.

This indicator is ideal for traders looking to quickly identify important market levels while maintaining a clean and organized chart view.

More from this author
Indicator
Indices
XAUUSD
Breakout
+9
Cross EMA Pro
Cross EMA Pro – Trend Reversal Indicator
You may also like
Indicator
Indices
Stocks
Forex
+1
Bullet Chart Trend
Unique Pyramid Design , Clear Price Action Trend
Indicator
NAS100
NZDUSD
XAUUSD
+11
RT Consolidation Zones
Identify and trade breakouts with Consolidation Zones! Visualize price consolidation areas for trading opportunities.
Indicator
NAS100
NZDUSD
XAUUSD
+11
Samurai Breakout Lite
⚔️Limited version. Draws clean session box (Tokyo / London / New York / Overlap) and optional breakout plan (EP/TP/SL)⚔️
Session Highlight Framer
Frame the sessions
Indicator
Breakout
ATR
Signal
UT Bot
ATR-based trend following tool with trailing stop logic. Highlights crossovers using clean up/down bands and bar colour.
Anchored VWAP Buttons
Price Speed or Acceleration v1
This Indicator will display either the speed or the acceleration of the current symbol.
IR Close MTF
this indicator show other time frame close in lower time frame. for ex: show daily close in m 15.
Automatic Fibonatti - Renko
Automatically plots Fibonacci retracement levels using the highest and lowest points of a customizable time range.
VegaXLR - Market Sessions Alerts
The cTrader Market Sessions Alerts Indicator marks global sessions, highlights key levels, and sends real-time alerts.
Vsamarth Indi
One‑click RSI robot for consistent rapid‑fire trades.
Indicator
Breakout
Stocks
Signal
Darvas Box
The Darvas Box involves identifying "boxes" or trading ranges where a stock's price consolidates before breaking out.
Parabolic SAR Alert
Parabolic SAR Alert - Trend reversal alerts with smart signals & custom alerts.
Indicator
RSI
Breakout
Supertrend
Leverage Liquidation Map
📊 Liquidation Map: Potential areas where highly leveraged investors might face liquidations.
Indicator
NAS100
NZDUSD
Martingale
+26
Info Dashboard_noSourceCode
Read the market with AI: live sentiment, news impact, equity, spread & neural net signals in one dashboard.
Cumulative Delta Candles + VolumeProfile
Cumulative delta candles + volume profile
Indicator
Indices
Forex
EURUSD
+2
US Dollar Index
US Dollar Index
Indicator
RSI
Breakout
XAUUSD
+5
Zones Supply Demand
📊Zones Supply & Demand: Identifies key price levels with high volume concentration, marking Supply/Demand Zones & Marke