
Pivot Points Indicator
The Pivot Points is a technical indicator for the cTrader platform that automatically calculates and displays pivot points as trendlines on the chart.
Key Features:
🎯 Pivot Types:
- Standard Pivot Points
- Fibonacci Pivot Points
- Woodie Pivot Points
- Camarilla Pivot Points
📊 Levels:
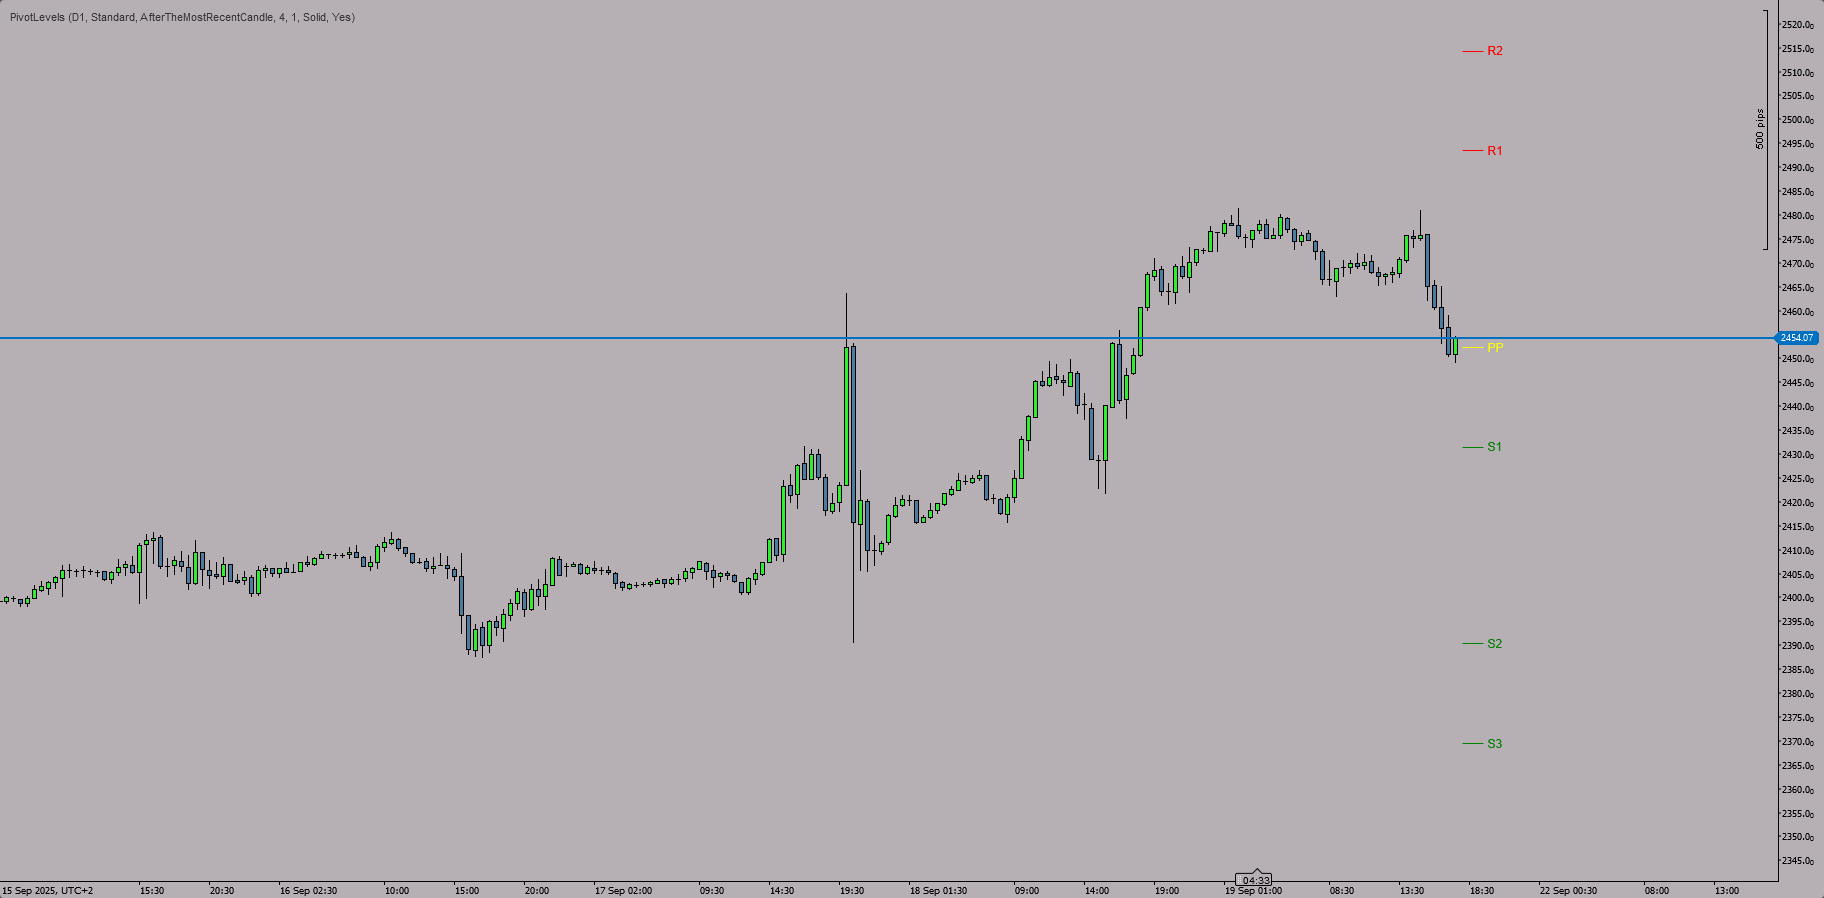
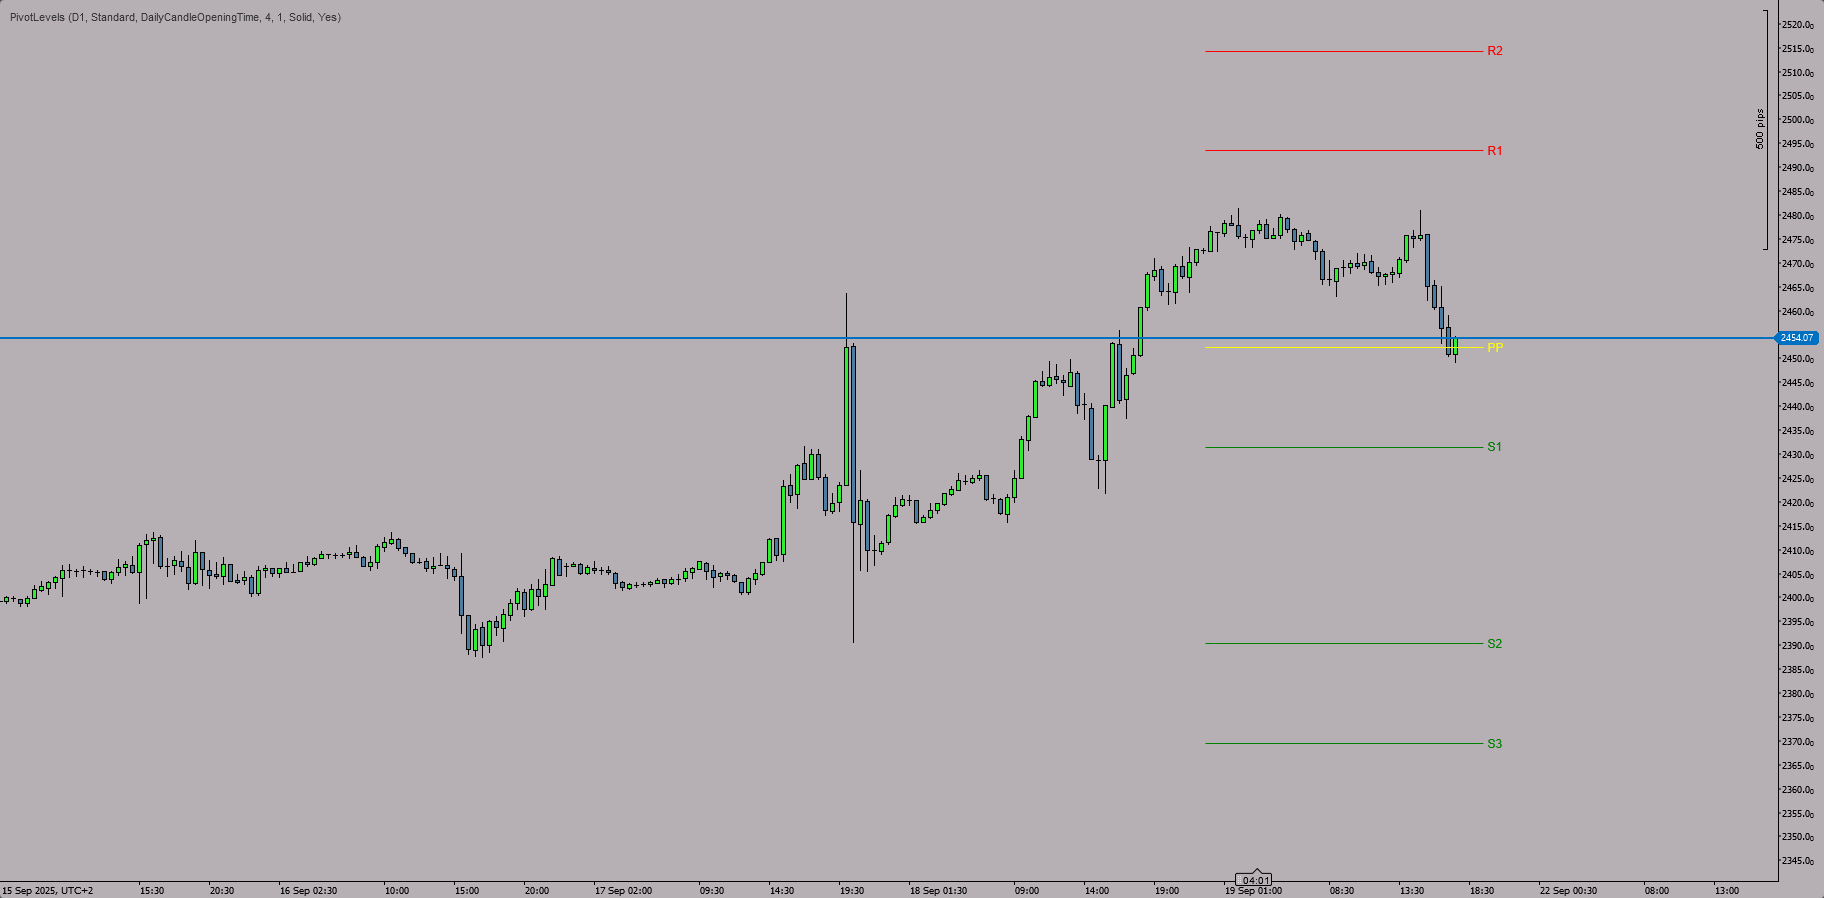
- Central Pivot Point (PP) - yellow
- Resistance levels (R1, R2, R3) - red
- Support levels (S1, S2, S3) - green
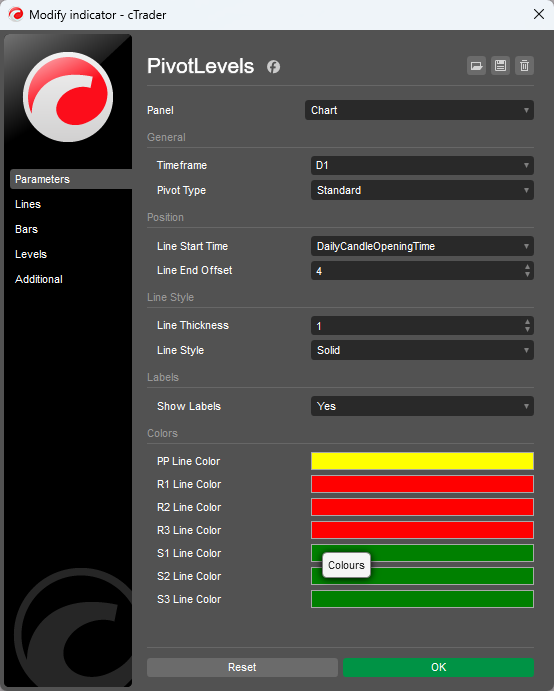
⚙️ Customizable Settings:
- Timeframe: Daily, weekly, or other timeframe selection
- Line style: Thickness (1-5) and type (solid, dashed, etc.)
- Positioning: Line start time and length
- Colors: Each level's color individually adjustable
- Labels: Toggle text labels on/off
💡 Usage:
The indicator calculates pivot levels based on the previous period's (day/week) high, low, close (and open) values, which identify key support and resistance areas for the next trading period.
Ideal for swing and day traders who apply strategies based on technical levels.
Indicator profile
0.0
Reviews: 0
Customer reviews
No reviews for this product yet. Already tried it? Be the first to tell others!
Indices
Prop
Commodities
Stocks
Forex
Crypto
Products available through cTrader Store, including indicators, plugins and cBots, are provided by third-party developers and made available for informational and technical access purposes only. cTrader Store is not a broker and does not provide investment advice, personal recommendations or any guarantee of future performance.
More from this author


You may also like


Since 05/01/2025
11
Sales