Indicator
RSI
Indices
Forex
Crypto
Candle Pro
"Candle Pro" logo
04/10/2025
51
Desktop
"Candle Pro" uploaded image"Candle Pro" uploaded image"Candle Pro" uploaded image"Candle Pro" uploaded image"Candle Pro" uploaded image

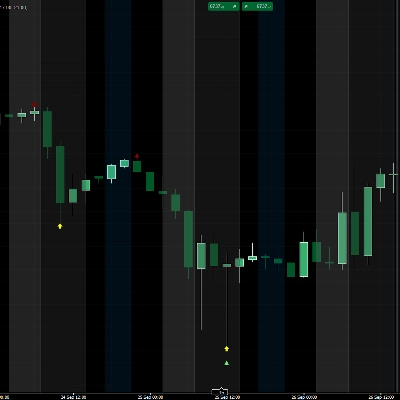
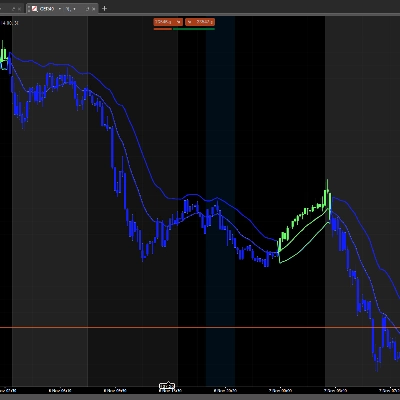
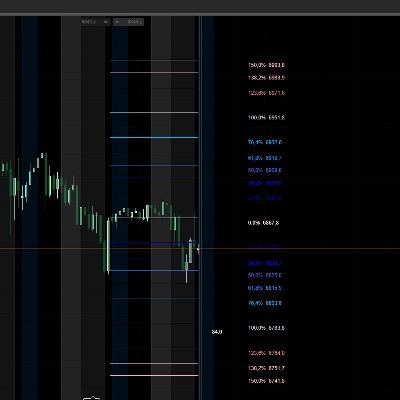
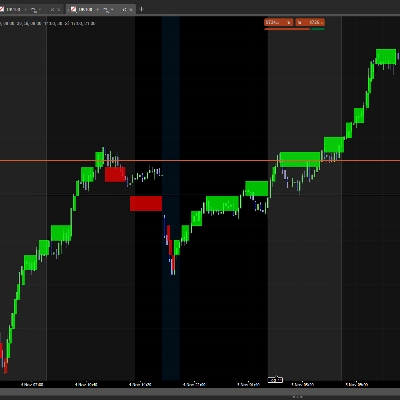
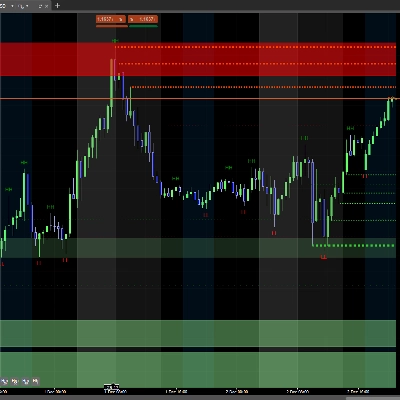
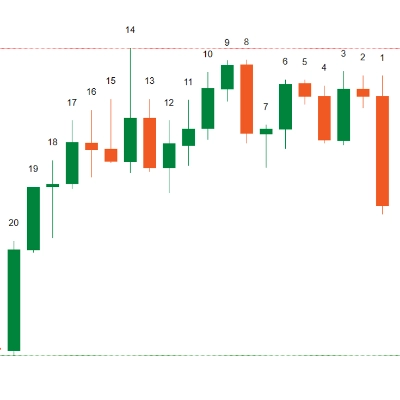
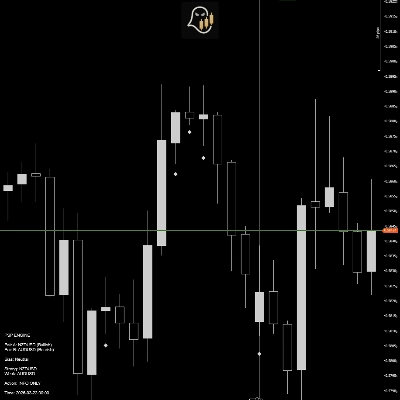
Candle Pro – Visual RSI signals on candles

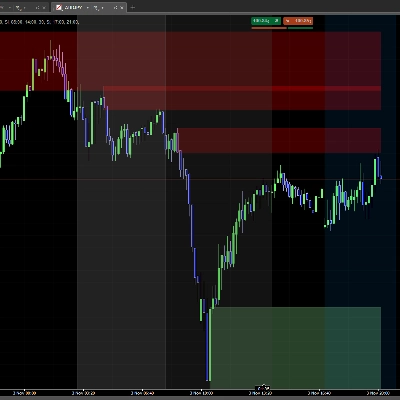
Candle Pro is an indicator that highlights candles directly on the chart when RSI reaches overbought or oversold levels, keeping your focus on price action and avoiding extra sub-charts.

🧭 How to use

  1. Add the indicator to your chart.
  2. Adjust the RSI parameters to fit your trading style.
  3. Watch how candles change color at extreme levels, marking potential reversal or momentum zones.

⚙️ Suggested settings

For a fast and precise response:

  • RSI Period: 3
  • Overbought: 32
  • Oversold: 44
  • Candle Width: 3
  • Bar Width: 1

Benefits

  • Clean visual signals directly on price.
  • Works with any symbol and timeframe.
  • Fully customizable colors and line widths.
  • Perfect for scalping, intraday, and swing trading.

Note: This is the free version of Candle Pro. A premium version is coming soon, packed with exclusive features to take your trading to the next level.

0.0
Reviews: 0
Customer reviews
No reviews for this product yet. Already tried it? Be the first to tell others!
More from this author
Indicator
Indices
Breakout
Forex
+2
Time zone pro
FREE Global Trading Sessions Indicator
Indicator
Indices
Stocks
Forex
+2
Super EMA
Super EMA the best EMA indicator
Indicator
Indices
Forex
Crypto
Super Arrows
Super Arrows
You may also like
Indicator
Signal
USDJPY
On Balance Volume USD - Combined
See USD demand in one line—Composite OBV fuses six major FX pairs into a clear momentum gauge.
IR Coral
Coral indicator
Indicator
RSI
Indices
Signal
+2
[Stellar Strategies] Ultimate Trend & Momentum Dashboard
A comprehensive cTrader indicator designed to give you a quick, at-a-glance understanding of market sentiment 📈📉
Zero Lag Exponential Moving Average
ZLEMA (Zero Lag EMA) is a faster, smoother version of EMA, ideal for capturing quick market shifts and trends.
[Hamster-Coder] Moving Average
Universal Moving Average indicator with extended features
Indicator
RSI
XAUUSD
Breakout
+6
PREMIUM SSL CHANNEL
SSL Channel: Tracks trends 📈 measures volatility ⚡filters noise via ATR+SSL. Clear signals for precise entries/exit...
VegaXLR - cTrader Multi-Timeframe Pivot Pro
Customizable multi-timeframe pivot point indicator for cTrader with alerts, Fibonacci, CPR, and more!
VegaXLR - RSI and StochRSI Alerts
VegaXLR's cTrader StochRSI identifies overbought/oversold RSI levels for precise trade entries.
Indicator
NAS100
RSI
NZDUSD
+15
RSI + EMA Crossover Signals
Dual confirmation RSI + EMA crossover signals with visual alerts and dynamic ATR offsets.
Indicator
Signal
MACD
USDJPY
PulseTracker
Version 1.2: Advanced Trend Detection & Visualization System
Indicator
Signal
Scalping
Major Tops and Bottoms
Average accuracy of around 60% to 70% on 45min timeframes it is highly recommended to use stop losses
Buy and sell indicator
Buy and Sell Signals
MMXM Structure by Ludwig
MMXM Structure by LudwigICT – Professional Market Structure Mapping Tool
Renko Wicks
Renko Wicks
Top-rated
Free
FairValueGap
This Fair Value Gap (FVG) indicator is a technical analysis tool used to identify potential price imbalances.
Indicator
NAS100
NZDUSD
Breakout
+12
Samurai Breakout Pro II
⚔️Full breakout trading workstation: session box, EP/TP/SL levels, on-chart ✓/✗ outcomes, pro-level analytics and more⚔️
Indicator
Bollinger
E7 Indicators Free Studies
ADXR, KDJ, SineWave, Bollinger Band Volatility and AEOscillator.
Cumulative Delta_noSourceCode
Demo of my main indcator.