QQE_MTF
Indicator
84 downloads
Version 1.0, Mar 2026
Windows, Mac
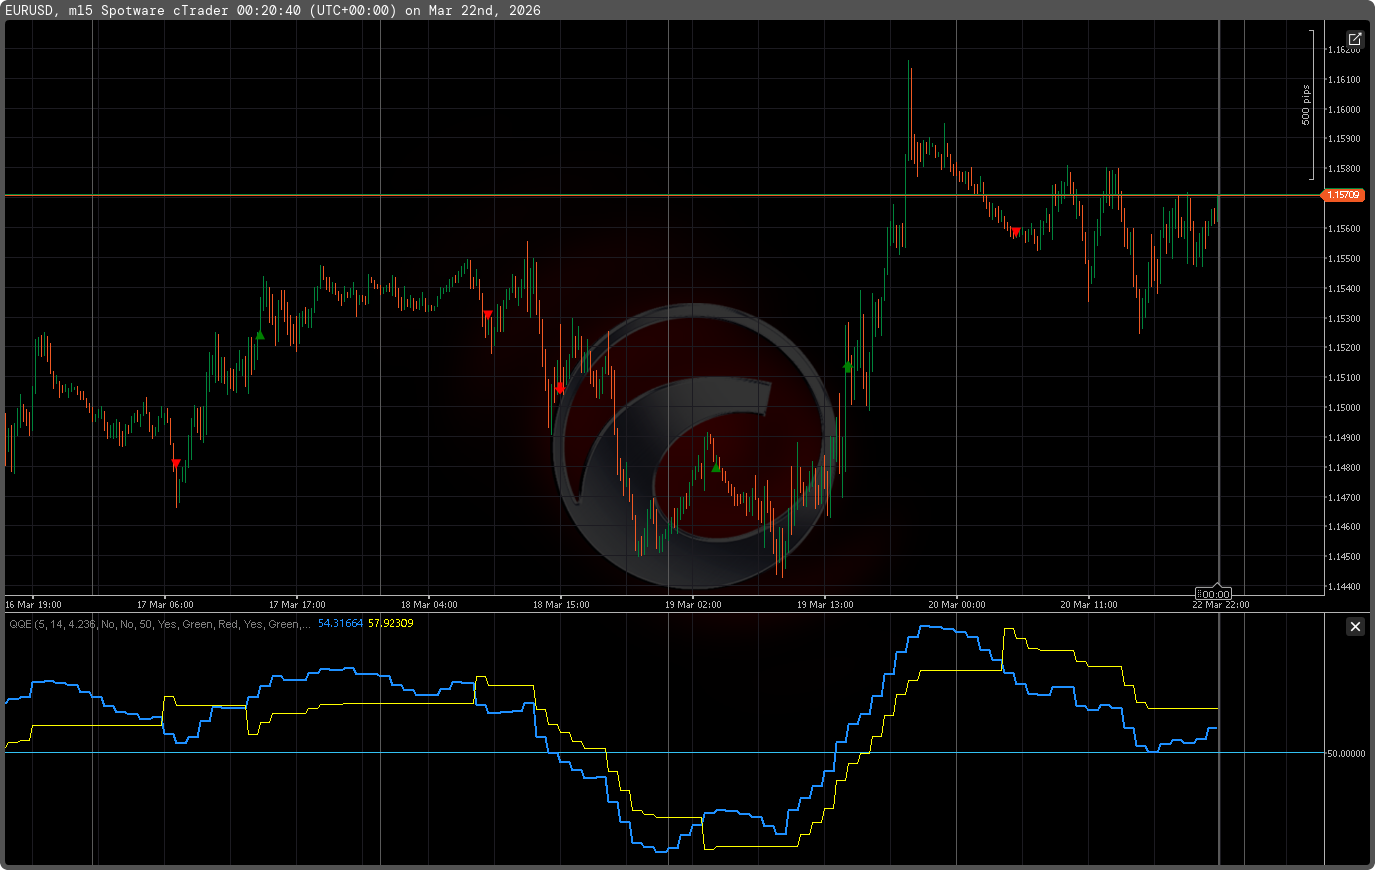
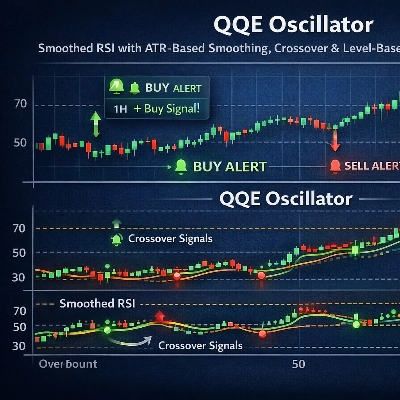
QQE (Qualitative Quantitative Estimation) is an oscillator-style indicator that combines a moving average of RSI with an ATR-based smoothing of RSI changes to produce a smoothed signal line and a trend filter. It is implemented for cTrader and supports multi-timeframe operation, visual arrows, and email alerts. The indicator is intended for traders who use momentum/oscillator signals for entries and exits.
How it works (technical summary)
- Core components:
- RSI calculated on price (configurable period).
- Exponential moving average (MA) applied to RSI (FastFactor smoothing).
- ATR-like measurement of absolute changes in the RSI MA, smoothed using Wilder’s-type smoothing and scaled by SlowFactor.
- A smoothed “level” (TrLevelSlow) derived from the RSI MA and the ATR-of-RSI smoothing.
- Signals:
- Buy: the RSI MA (blue) crosses the 50 level from below after having crossed above the smoothed line (yellow).
- Sell: the RSI MA crosses the 50 level from above after having crossed below the smoothed line.
- Multi-timeframe: you can choose an upper timeframe to calculate the QQE on higher-timeframe bars while displaying results on the current chart timeframe.
- Alerts & visuals: configurable chart arrows on crossovers and level crosses; optional email alerts.
Inputs / Default parameters
- FastFactor (RSI MA smoothing): default 5
- RSI Period: default 14
- Slow Factor (ATR-of-RSI multiplier): default 4.236
- AlertOnCrossover, AlertOnLevel: booleans to enable notifications
- AlertLevel: default 50
- ArrowsOnCrossover / ArrowsOnLevel and colors for up/down icons
- EnableEmailAlerts + AlertEmailFrom / AlertEmailTo
- UpperTimeframe: optional MTF setting
- ObjectPrefix: prefix used for drawn icons
Recommended use & settings
- Timeframes: works on any timeframe; common choices are 15-min to daily depending on your trading horizon. Multi-timeframe mode works well for aligning lower-timeframe entries with higher-timeframe momentum.
- Markets: works with FX, metals, indices, crypto and stocks — any liquid market where RSI-type oscillators apply.
- Typical default starting settings: RSI Period = 14, FastFactor = 5, SlowFactor = 4.236. Adjust FastFactor for faster/slower smoothing and SlowFactor to change sensitivity to RSI volatility.
- Signals should be used with risk management and confirmation (price structure, support/resistance, trend context). Consider using the higher timeframe trend or filter before acting on lower-timeframe crossovers.
Visuals & alerts
- Drawn icons for:
- Crossover up / down (configurable colors)
- Level up / down at AlertLevel (default 50)
- Optional email alerts when crosses or level events occur.
Limitations & notes
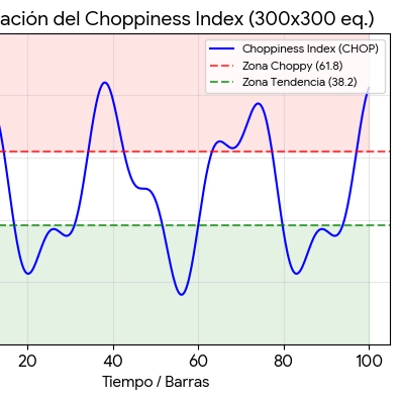
- Like all indicators, QQE is a lagging/momentum-based tool; false signals occur in choppy, non-trending markets.
- Backtest and forward-test on a demo account before using with real capital.
- Ensure email alert settings are configured correctly in cTrader and your mail provider to receive emails.
Installation / usage tips
- Add the indicator to a chart, optionally set an UpperTimeframe for MTF operation.
- Enable/disable arrows and alerts to suit your workflow.
- Use the ObjectPrefix to avoid collisions with other indicators.
Indicator profile
0.0
Reviews: 0
Customer reviews
No reviews for this product yet. Already tried it? Be the first to tell others!
Indices
Commodities
Stocks
Forex
Signal
Crypto
Scalping
Products available through cTrader Store, including indicators, plugins and cBots, are provided by third-party developers and made available for informational and technical access purposes only. cTrader Store is not a broker and does not provide investment advice, personal recommendations or any guarantee of future performance.
You may also like


Since 16/01/2025
2.43M
Traded volume
1.94K
Pips won
137
Free installs