Indicator
Signal
Master Dragom SR
"Master Dragom SR" logo
5.0
05/08/2025
193
Desktop
"Master Dragom SR" uploaded image"Master Dragom SR" uploaded image

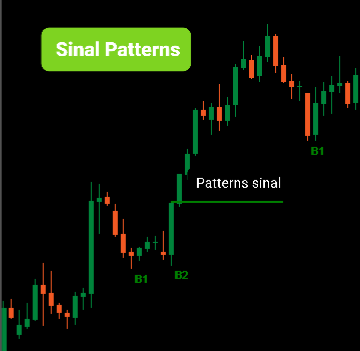
Complete your strategies with this signal indicator👇🏻

https://ctrader.com/pt/products/1560?u=Goulart


✔Indicator Features

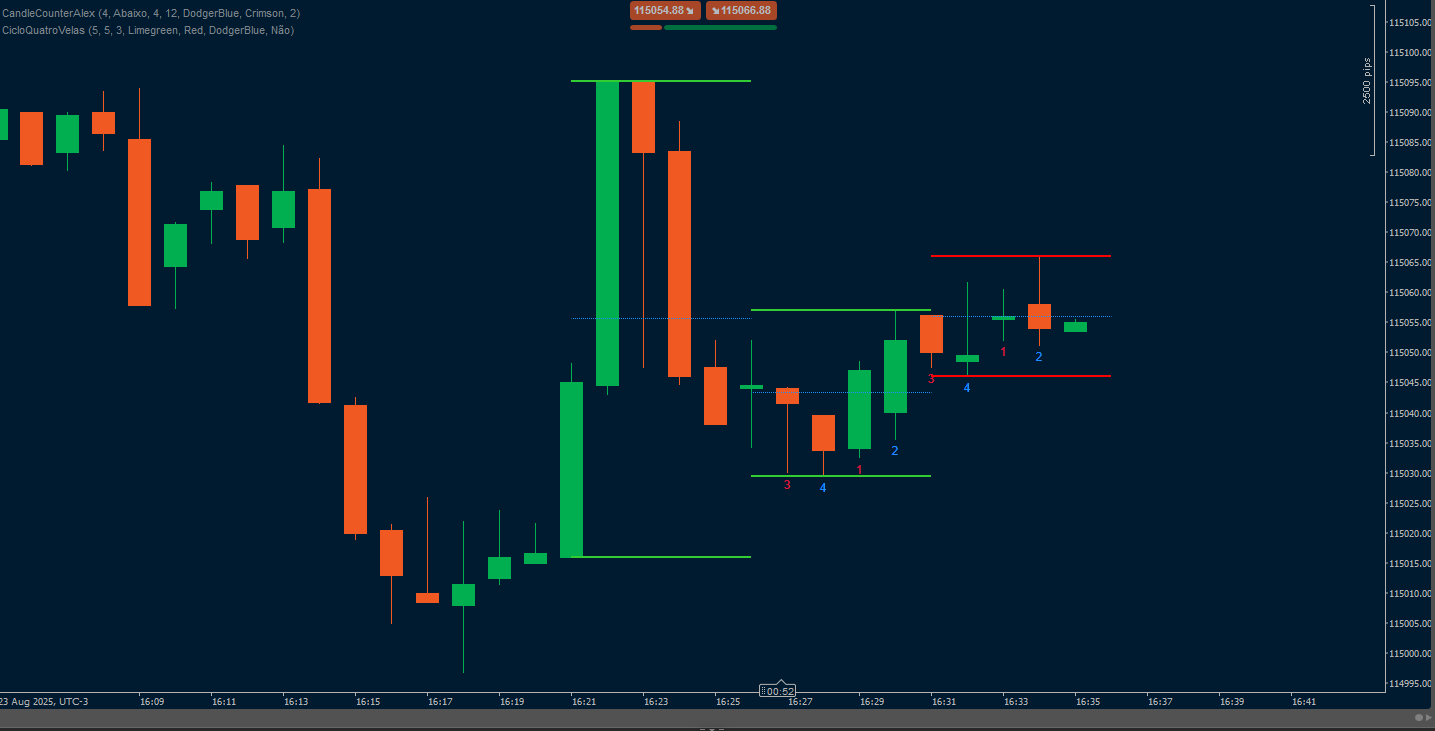
Support and Resistance (SR):

The indicator draws horizontal lines for daily, weekly, and monthly support and resistance levels.

You can enable or disable each level (open, close, high, and low) as needed.

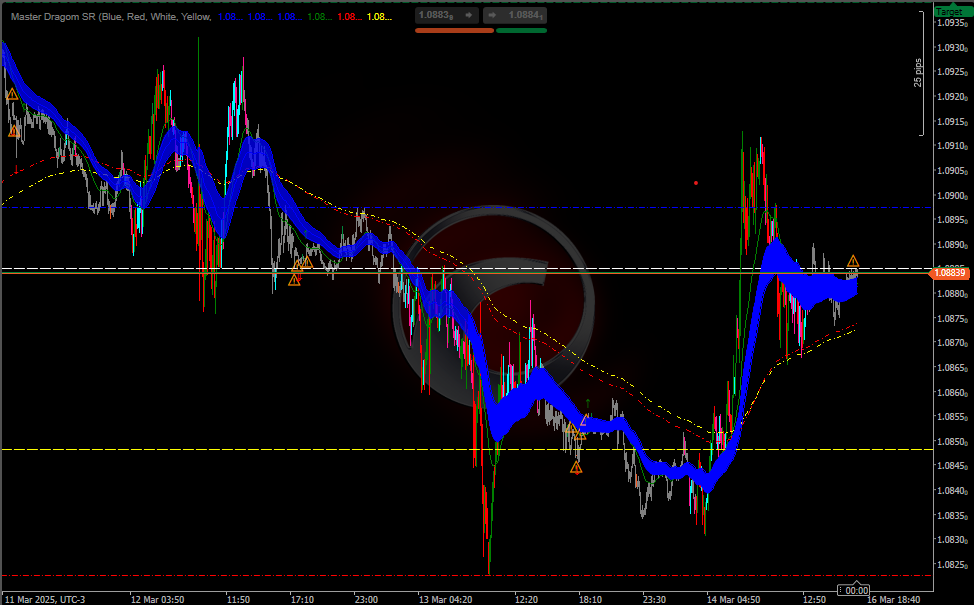
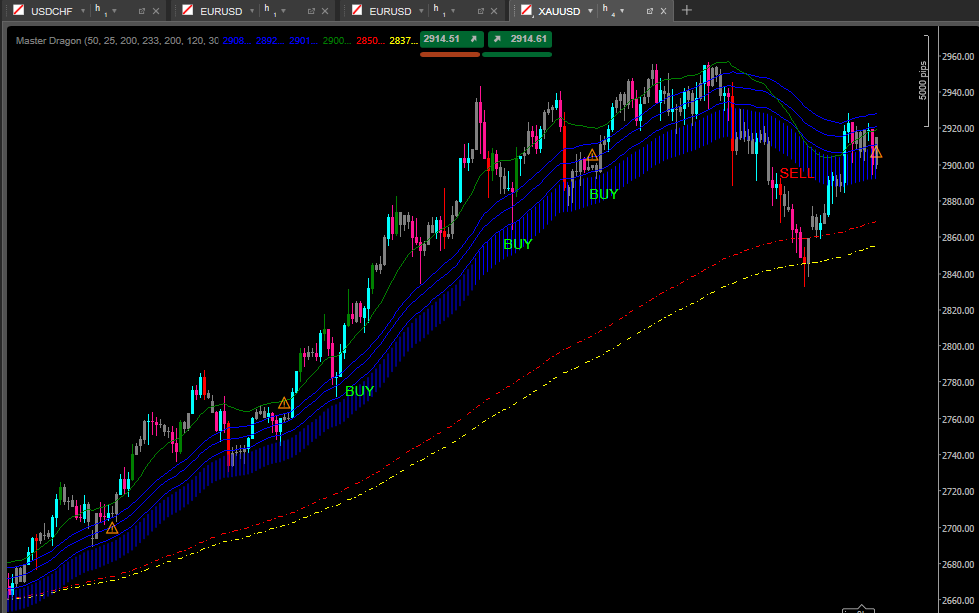
Exponential Moving Averages (EMA):

The indicator calculates multiple EMAs (50, 25, 200, and 233 periods) to help identify trends and potential dynamic support/resistance areas.

The EMAs are plotted on the chart in different colors for easy viewing.

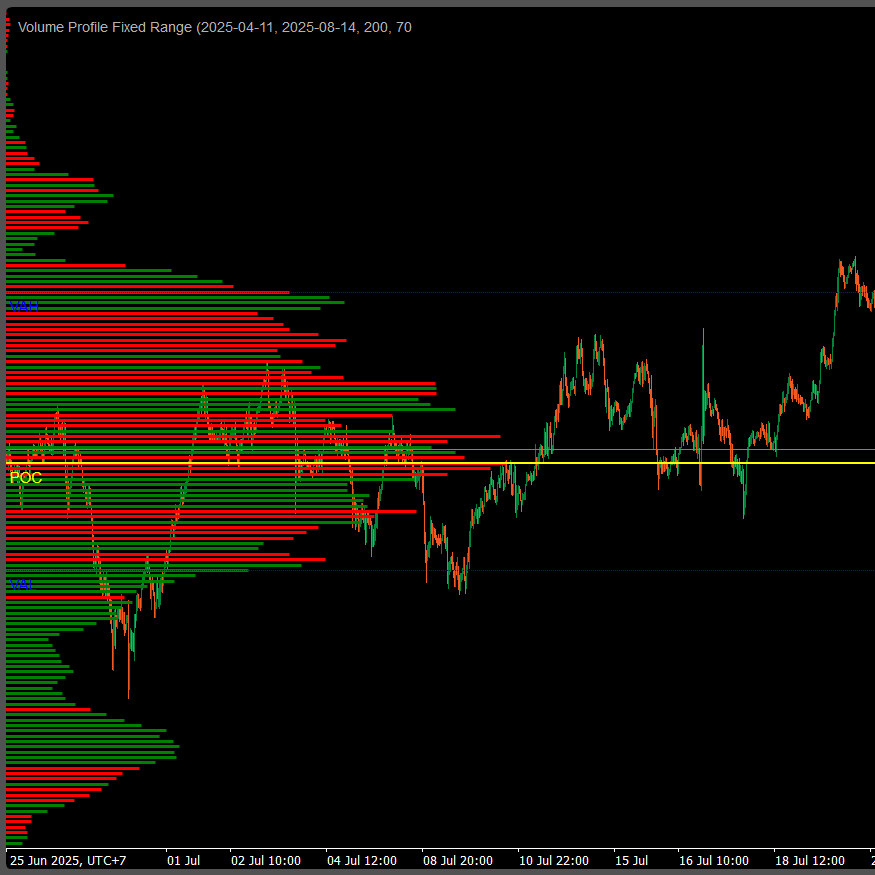
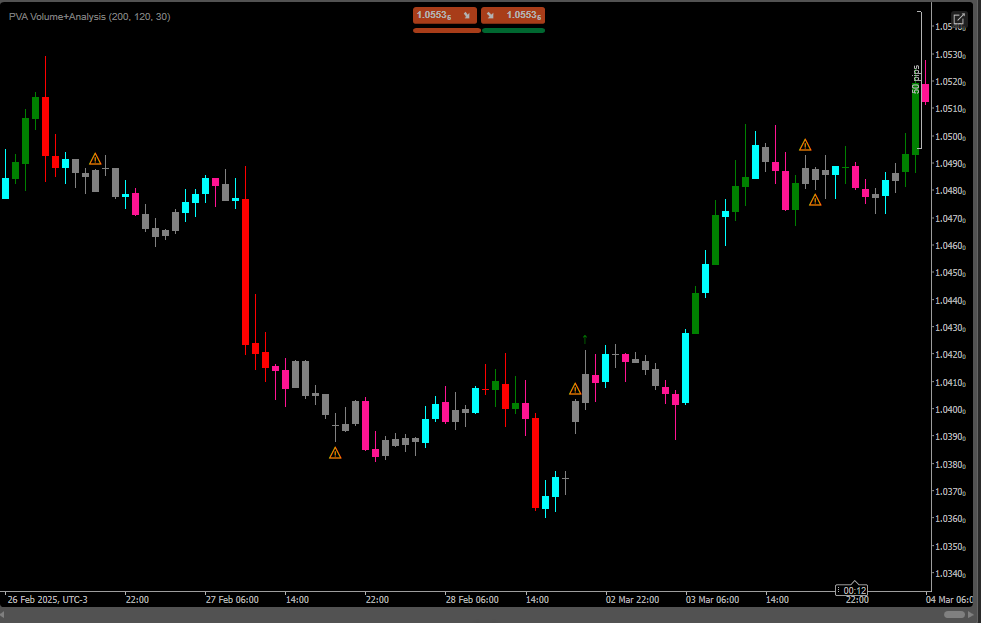
Volume Analysis (PVAVolumeAnalysis):

The indicator analyzes volume to identify potential trend reversals or continuations.

It highlights bars with above-average volume and signals significant changes in volume with icons (↑, ↓, ⚠️).

Bar Coloring:

Bars are colored based on volume and price direction (up or down), which helps identify the strength of the trend.


Trend Analysis with EMAs:

Use EMAs to identify the direction of the trend:

If the price is above the EMAs (especially the 200 and 233 EMAs), the trend is up.

If the price is below the EMAs, the trend is down.

The area between the 50 EMA High and Low can be used as a zone of interest for potential reversals or continuations.

Volume Analysis:

Observe the icons and bar colors to identify changes in volume:

High volume with price rising (↑): Confirmation of an uptrend.

High volume with price falling (↓): Confirmation of a downtrend.

Low volume with price rising or falling (⚠️): Possible reversal.

Combining Signals:

Combine the signals of volume, EMAs, and SR levels to make entry or exit decisions.

For example, if the price is close to a resistance level and the volume is decreasing, it could be a reversal signal.

Suggested Strategy

Trend Strategy with Volume Confirmation

Identify the Trend:

Use the EMAs (200 and 233) to determine the main trend.

If the price is above the EMAs, consider only buys.

If the price is below the EMAs, consider only sells.

Wait for a Pullback:

Wait for the price to return to a shorter period EMA (50 or 25) or to an SR level.

Confirm with Volume:

Check if the volume is increasing in the direction of the trend (↑ for buys, ↓ for sells).

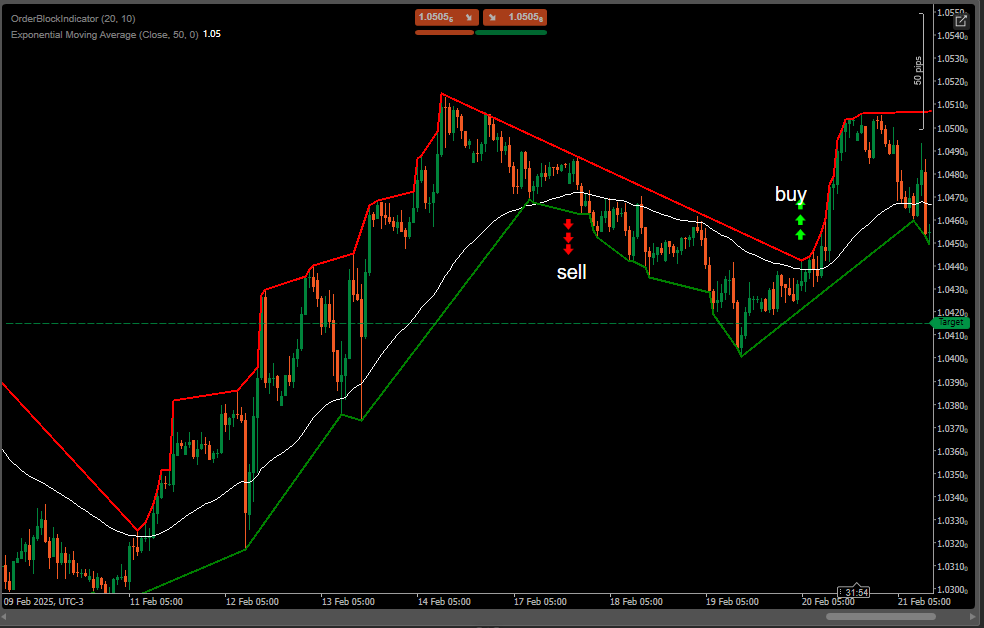
MA locate trends, pullback, signal volumes, reversals, support and resistance.

If the volume is decreasing (⚠️), avoid entering or consider a reversal.

Entry:

Buy when the price is above the EMAs and close to a support level, with volume confirming the uptrend.

Sell ​​when the price is below the EMAs and near a resistance level, with volume confirming the downtrend.

Exit:

Use the SR levels or EMAs as targets or exit points.

For example, closl or the sell when it hits a support level.


5.0
Reviews: 1
5
100 %
4
0 %
3
0 %
2
0 %
1
0 %
Customer reviews
August 18, 2025
Pros: Automatically identifies support and resistance zones based on price swings. Clean visualization and lightweight. Cons: No tooltips or alerts. Lacks template saving and zone metadata on hover.
More from this author
Block Order Rreversal
Order BlockIndicator reversal
cBot
Indices
RSI
Breakout
+1
CHART PATTERN BOT
Chart Patterns Algo Bot
PVA Volume+Analysis_noSourceCode
PVA Volume Analysis Indicator:Price volume over trend strength and direction
cBot
Indices
RSI
ATR
+3
NEXUS PRIME V3
Intelligent system, Available any instrument. Profit 12. Drawdown 1%
Indicator
Breakout
Commodities
Forex
+3
MAGIC BLOCK STRATEGY
Block Liquidity,indicator.Block Order, Liquids Stops, Signal Sentiment,signal correction
cBot
Forex
EURUSD
AI
+1
GRADIENTE LINEAR FOREX_noSourceCode
Sophisticated GRADIENTE algorithm , performance 11% per day drawdown 4%
Blocks Liquidity MGC
BlocksLiquidity Indicator Analysis!
BLOCK LIQUIDITY PRO
Block Liquidity,indicator.Block Order, Liquids Stops, Signal Sentiment,signal correctio.
cBot
XAUUSD
Scalping
Precision Scalper v1.1
Precision Scalper,XAUUSD ,Averages that functions like a multidimensional radar:
Indicator
Signal
DARK POLL SIGNAL_noSourceCode
Dark Poll Signal Indicator.liquidity leakage,precedes the great movement, accumulation, distribution
Indicator
Forex
EURUSD
EconomicForex
ECONOMIC FOREX:provides insights into inflation, nominal interest rates and real interest rates, in the line chart
Indicator
NAS100
NZDUSD
RSI
+11
Pattern Signal Forex
Indicator pattern signal moment
Indicator
NAS100
Indices
RSI
+9
LIQUIDITY POOLS SIGNAL FREE
INDICATOR,LIQUIDITY POOLS,ACCURATE SIGNAL, NO DELAY,80% PROBABILITY
cBot
Stocks
Forex
Quark Forex Paid 1
Quark automatic system Three Strategies
cBot
Stocks
Forex
Linear Gradiente v3
GRADIENTE LINEAR algorithm , performance 11% per day drawdown 4%
cBot
Stocks
Commodities
Forex
Resolver Range Pro 2.3
Resolver PRO 2.3 Bot,Sophisticated, Perfect algorithm! Daily ROI 5 to 24%.Maximum drawdown 4%.
cBot
Grid
Indices
RSI
+8
NEXUS STARTER 1.3
Intelligent system, Available any instrument. Profit 9. Drawdown 2%
cBot
Grid
RSI
ATR
+3
NEBULA EDGE IA
Adaptive decision-making AI ROBOT that evolves with the market, dynamic risk management and ML optimization.
You may also like
Indicator
NZDUSD
Forex
USDJPY
+1
8 Currencies_NSC
RCS: 8 majors! AUD,USD,EUR,JPY,GBP,CAD,CHF,NZD. Find how strong each currency is relatively and trade smarter!
Indicator
RSI
Breakout
XAUUSD
+5
Supertrend
💹 Define a price channel 📈 and determine trend direction (bullish 🟢 or bearish 🔴).
Indicator
Grid
RSI
Breakout
+6
Final Stochastic Oscillator
Final Stochastic Oscillator is a next-generation upgrade of the classic stochastic indicator
Indicator
NAS100
NZDUSD
Martingale
+22
Zigzag Trend
The ZigZag Trend is a market structure tool that filters out small price fluctuations and highlights major swing.
Indicator
Indices
Commodities
Forex
Smart Floating Risk - Premium version
The Floating Risk Indicator is an essential tool for traders who prioritize risk management.
Indicator
RSI
Breakout
Supertrend
Market Trend OB
Price action to detect when the market changes trend (MSB) and defines, order blocks , ZigZag etc.📊
Indicator
RSI
ATR
Signal
+1
Trading Fusion Bars 2
This indicator works best as a trend-confirmation tool—wait for multiple signals!
Indicator
NAS100
NZDUSD
XAUUSD
+14
Order Block Scanner by PrimeQuant
Smart institutional order block & FVG scanner with alerts, zone merging, and HTF confluence.
Indicator
RSI
Breakout
XAUUSD
+1
ZigzagSR
Automatic ZigZag swings with dynamic support & resistance levels, labeling highs/lows for clear trend signals.
E7 Volume Profile
E7 Volume Profile, more modern look and feel.
CicloQuatroVelas
Ciclo4Velas com marcação de 50% da amplitude e muito mais ! veja na descrição e bons trades.
Indicator
Indices
RSI
Stocks
+5
REDGREENZONEREVERSAL
The Red & Green Zone Reversal Indicator detects overbought and oversold market conditions using Bollinger Bands and RSI.
Zig zag v.1 Demo
ZigZag Pro DEMO – Multi-Swing Indicator for cTrader DEMO VERSION – 24 hours free trial! This is a DEMO version of the Z
Indicator
Breakout
VIX - volatility indicator - Renko
Volatility indicator for Renko.
MA Sabres
Conquer the markets with MA Sabres! This indicator spots trend flips with MAs and cool Sabre shapes & alerts.
Indicator
XAUUSD
Commodities
ATR
+1
[Stellar Strategies] Visual Trend Momentum
Visual Trend Momentum is a MA/ATR/Volume trend tool. Visual signals for strong trends & reversals. Customizable. 📈📉
Volume Profile Fixed Range
Professional Volume Profile Indicator - Shows volume distribution, POC, Value Areas & Buy/Sell pressure.
Candle Timer & Strength Demo
Candle Timer & Strength DEMO for cTrader This is a DEMO version of the Candle Timer & Strength indicator. You can use al