Indicator
RSI
Signal
Wyckoff Toolkit [Iridio Capital]
"Wyckoff Toolkit [Iridio Capital]" logo
03/09/2025
1
Desktop
"Wyckoff Toolkit [Iridio Capital]" uploaded image

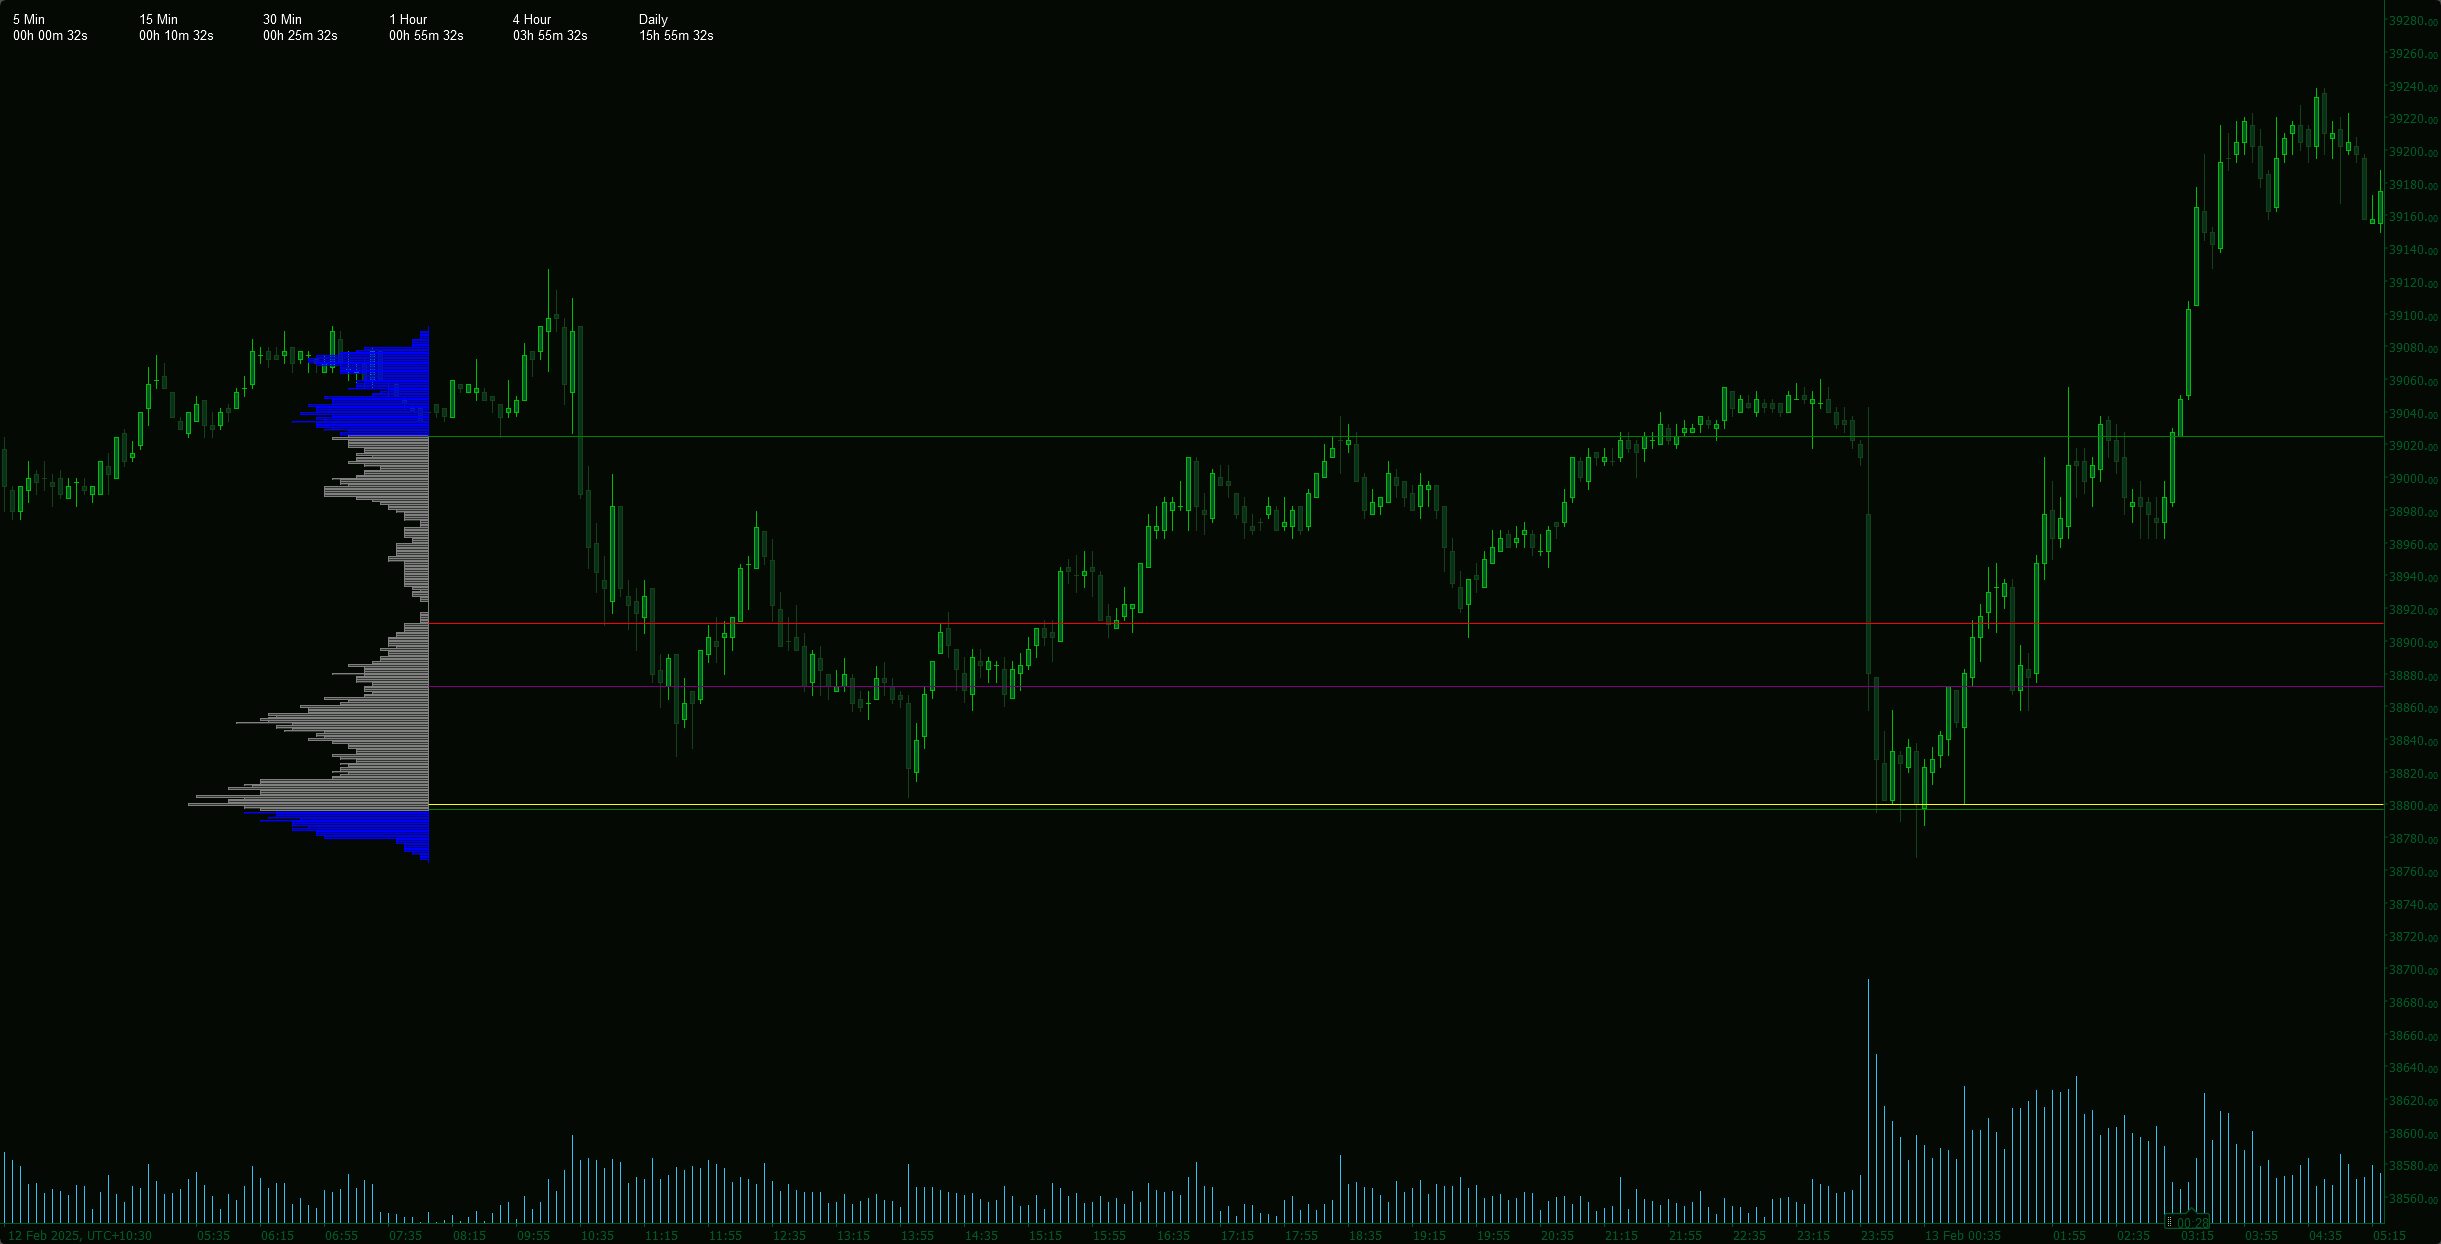
Spot Reversals with Institutional Precision

The Wyckoff Toolkit is the ultimate ally for traders seeking to decode the market through the lens of "smart money." Blending classical technical analysis principles with a modern approach to liquidity and volatility, this tool equips you with three key elements to trade confidently in chaotic markets:

What’s Inside?

  1. Asian Session Range
    Pinpoint the "liquidity map" of the Asian session — a critical zone where institutions and market makers often set volatility traps. This range is vital for anticipating breakouts or fakeouts in later trading hours.
  2. Previous Daily High/Low
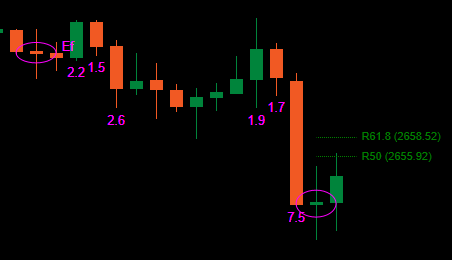
    Never lose sight of the prior day’s key levels. These extremes act as magnets for liquidity, offering clear signals on where price might test orders (liquidity grabs) before reversing or accelerating.
  3. Price/RSI Velocity Divergence
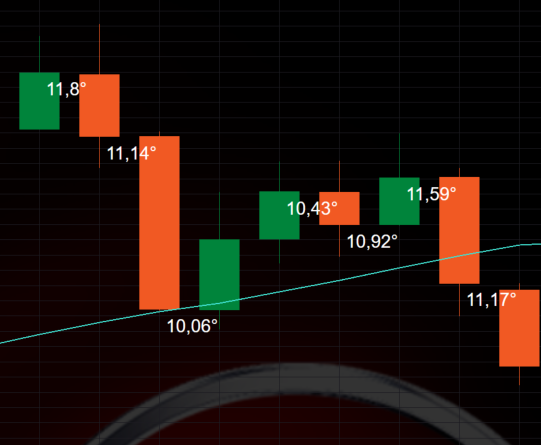
    Uncover whether a trend is backed by genuine strength or hints at an impending reversal. Our advanced divergence measures the speed of price movement (a proxy for volatility), exposing when rallies or sell-offs lose momentum despite price action. A systematic way to detect manipulations and stop hunts.

Why It Works?

  • Instant Confluence: Daily highs/lows, Asian Range, and divergences converge into institutional interest zones. When price touches these levels with divergence in play, you get a high-probability signal—this is where big players enter or exit.
  • Wyckoff Logic Reimagined: Beyond "accumulation" and "distribution," this toolkit offers a dynamic view of liquidity pools. It helps distinguish genuine breakouts from fakeouts by revealing who truly controls the market.
  • Adapts to Any Style: Scalper, day trader, or swing trader—the insights are delivered intuitively. No data overload, just actionable signals.

Who Is This For?

  • Traders who want to anticipate reversals instead of chasing price.
  • Those seeking an edge rooted in liquidity, not lagging indicators.
  • Anyone who views markets as a battle between buyers and sellers—and wants to join the winning side.
More from this author
Indicator
Stocks
Forex
Crypto
Trend Angle Indicator [Iridio Capital]
The Trend Angle Indicator provides a clear and intuitive way to visualize market trends.
You may also like
Indicator
XAUUSD
Martingale
Commodities
+2
cAlgoBuddy - Zone Recovery
The Zone Recovery indicator is used in an advanced hedging strategy, opening traders in the opposite direction.
Indicator
XAUUSD
Commodities
Forex
+2
IM_AngleIndicator
Indicator that calculates the slope of a moving average (SMA) and displays the value of the slope in degrees
Parabolic RSI Alert  V1
Master RSI reversals with Parabolic SAR precision! Get real-time alerts for high-probability trend changes.
Indicator
NAS100
NZDUSD
Martingale
+22
Indicators Volume Profile 1
Taiz Pro Volume Profile مؤشر احترافي لتحليل الحجم (Volume Profile) يكشف عن مناطق الدعم والمقاومة الحقيقية التي يركز عليه
Indicator
NAS100
NZDUSD
XAUUSD
+14
WVAP-Bands Indicator_noSourceCode
VWAP with standard deviation bands. Fully customizable colors, periods, and multipliers for precise trading signals
zh-cn Variety Period time panel(multilanguage)
This indicator can be used to: change color, shape size, position, change font, increase or decrease, and other function
Indicator
Indices
XAUUSD
Commodities
+5
cAlgoBuddy - Chaos Reversals
The cTrader Chaos Reversals indicator brings high-quality reversal signals to traders.
[Hamster-Coder] Pivot Points
[Hamster-Coder] Pivot Points (Standard)
MAMA CANDLES
This code implements the MESA Adaptive Moving Average (MAMA) indicator, it creates candles based on MAMA calculations.
Indicator
Breakout
ORB v1.1
Opening Range Breakout v1.1 - Visuals + Stats
Indicator
Indices
XAUUSD
Breakout
+3
AnchoredVWAP
A precision overlay tool that combines session-aware VWAP logic and standard deviations.
Indicator
RSI
Commodities
Signal
+1
Dot Momentum %BB Indicator
Dynamic circles visualize price's volatility position. Like RSI for market overextension & stretch. Quantify context.
DMI 3 bar v2
Shows BUY & SELL signals for 3 & 4 BAR PATTERN (Morning star/ Evening star). It is adjustable and it will SHOW ARROWS.
Buy and sell indicator
Buy and Sell Signals
Volume Profile Triple Line - POC Median Mode
The Advanced Volume Profile Indicator calculates POC, Median, and Mode, revealing key price levels for smarter trading.
Indicator
XAUUSD
Commodities
Forex
+3
Silver Bullet by LudwigICT
Indicator
VWAP
Indices
RSI
+4
ProVWAP
Advanced Anchored VWAP for cTrader: volatility bands, real‑time alerts & customizable session resets.
LT_Ind_Candles
Most used candle patterns. (1 candle, 2 candles and 3 candles patterns) and Marubozu. Bonus Fibo Risk control.