Indicator
Breakout
BreakOut_Probability_Expo
"BreakOut_Probability_Expo" logo
4.0
03/09/2025
148
Desktop
"BreakOut_Probability_Expo" uploaded image"BreakOut_Probability_Expo" uploaded image"BreakOut_Probability_Expo" uploaded image"BreakOut_Probability_Expo" uploaded image

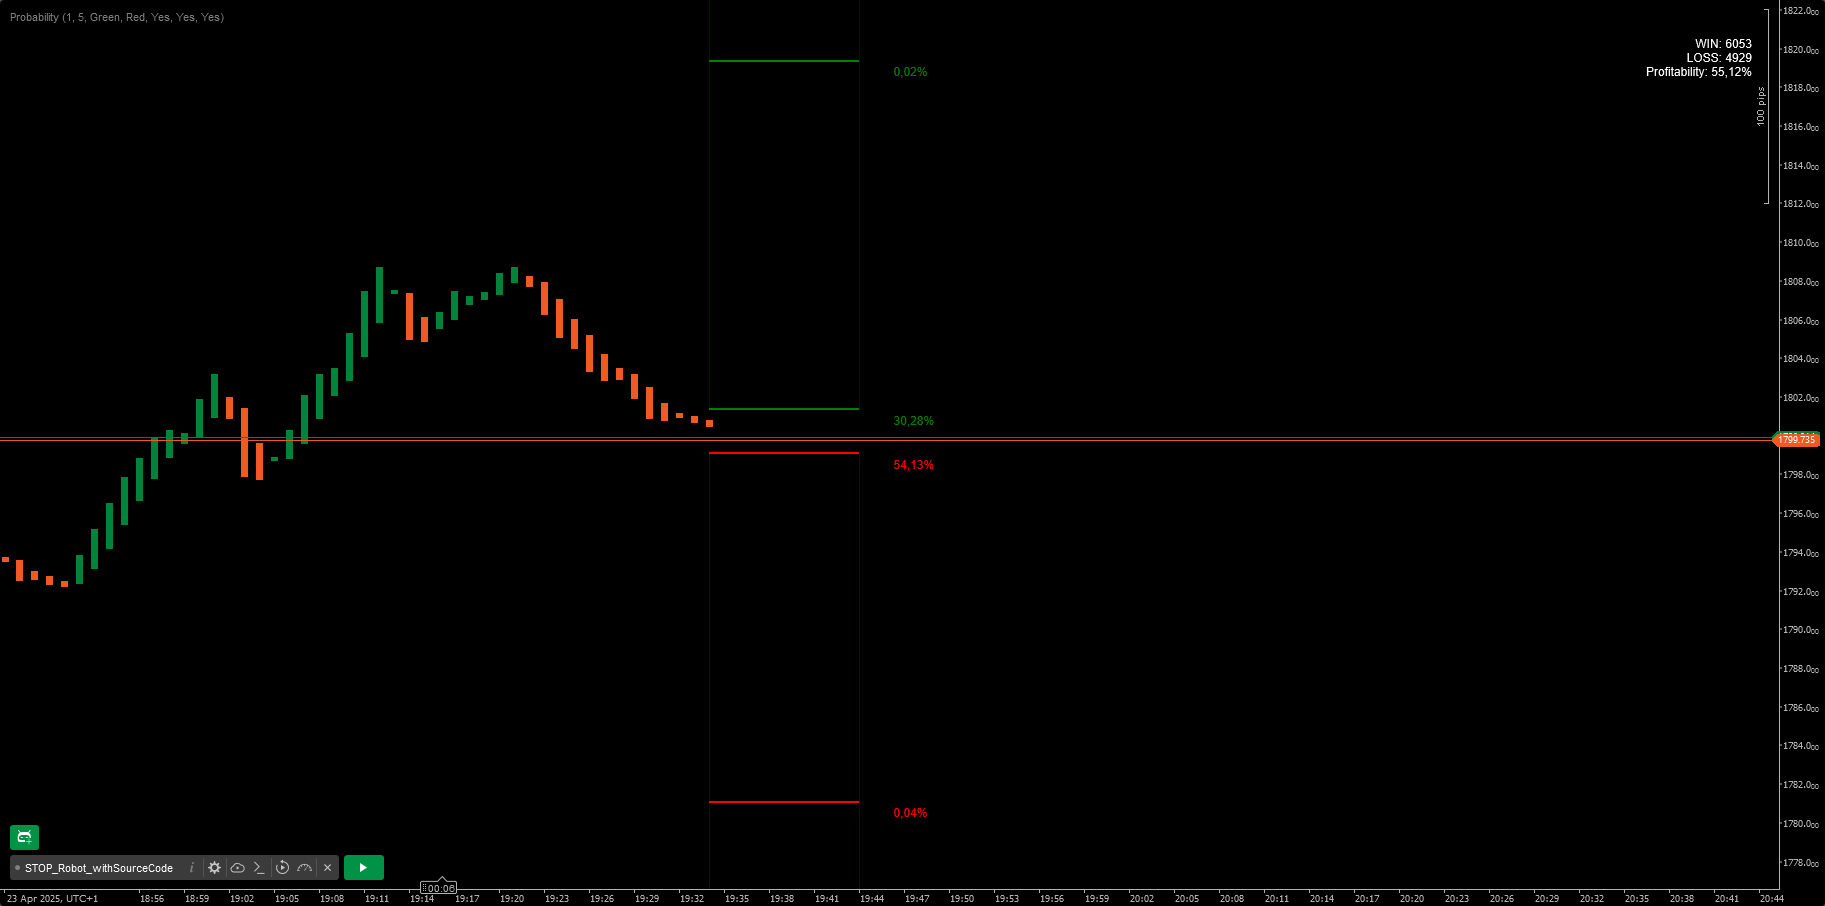
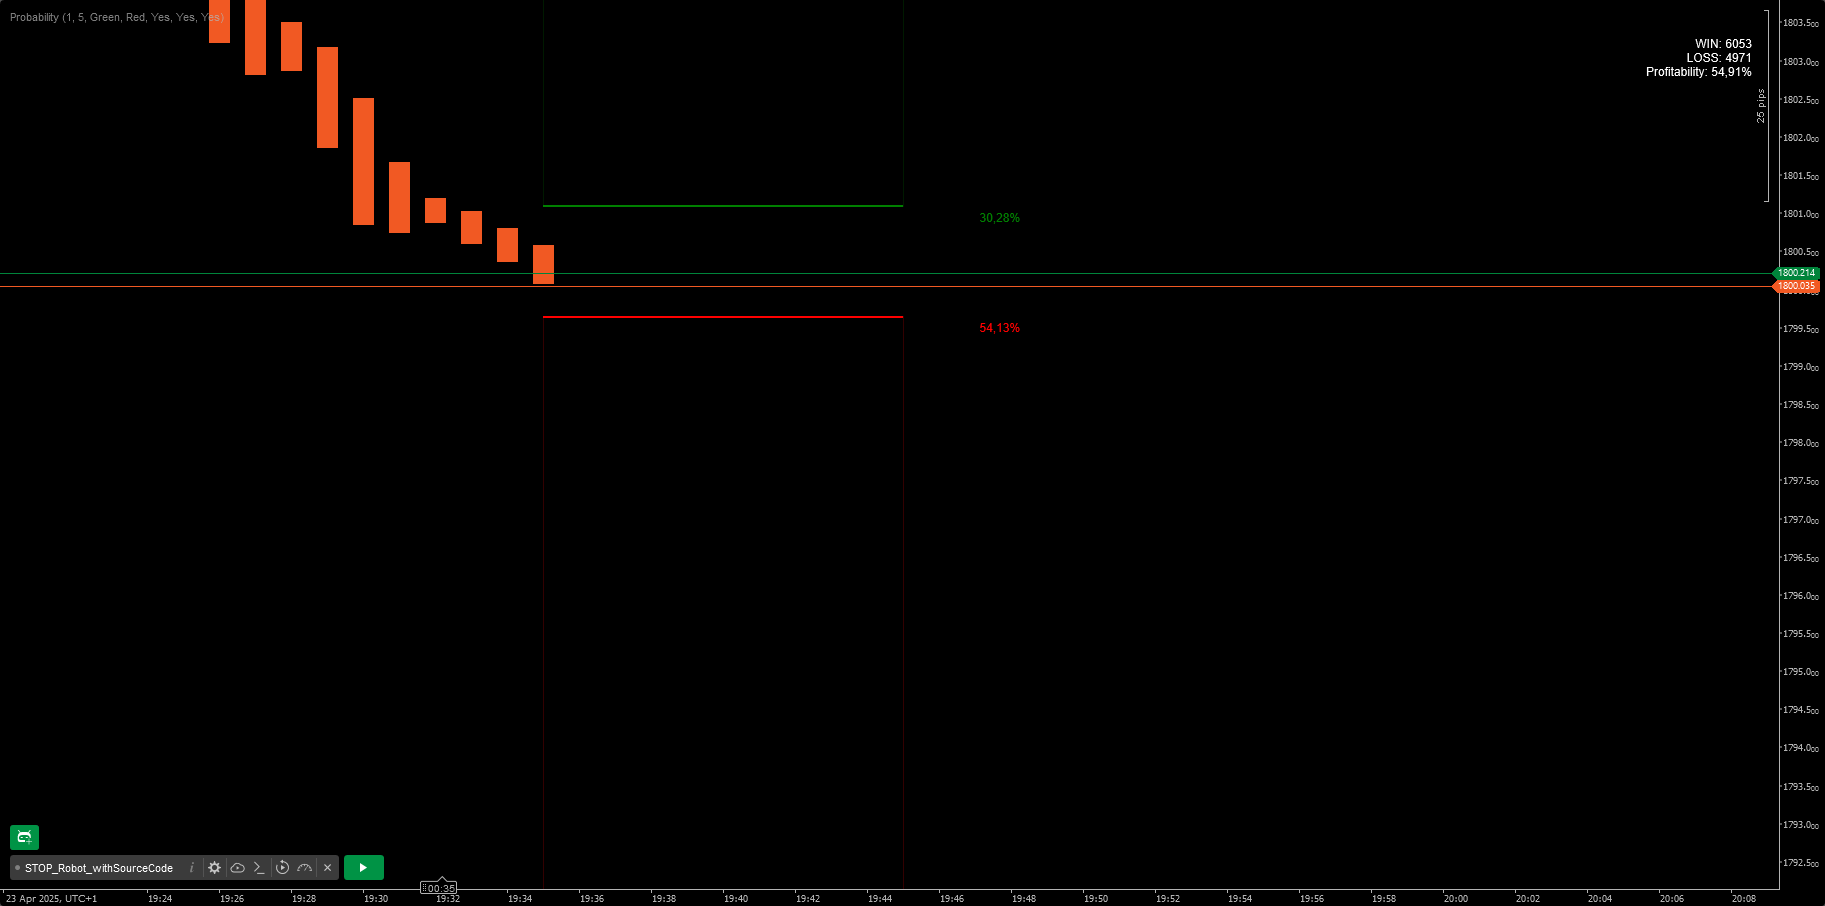
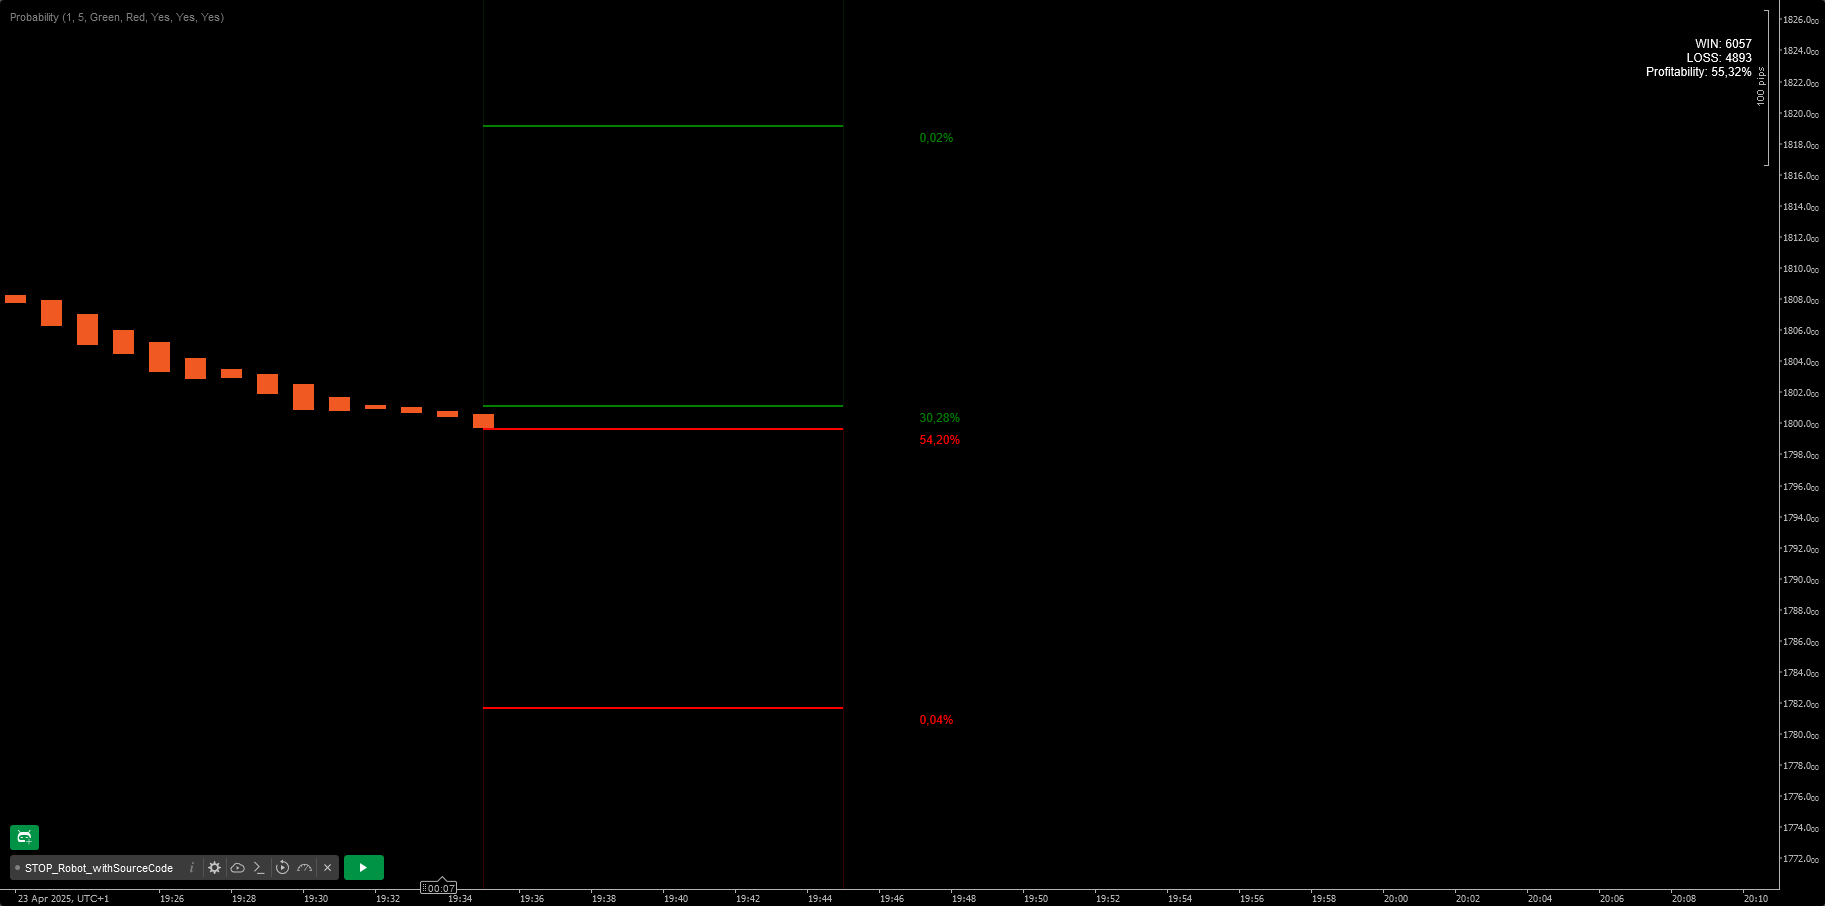
Breakout Probability is a valuable indicator that calculates the probability of a new high or low and displays it as a level with its percentage. The probability of a new high and low is backtested, and the results are shown in a table— a simple way to understand the next candle's likelihood of a new high or low. In addition, the indicator displays an additional four levels above and under the candle with the probability of hitting these levels.

The indicator helps traders to understand the likelihood of the next candle's direction, which can be used to set your trading bias.


█ Calculations

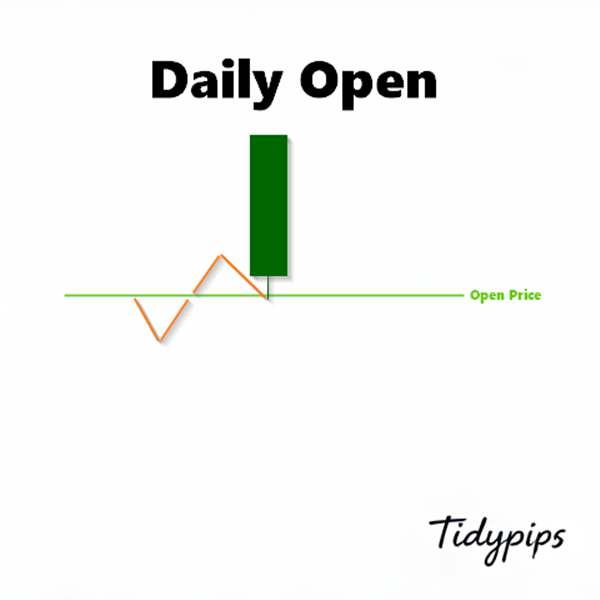
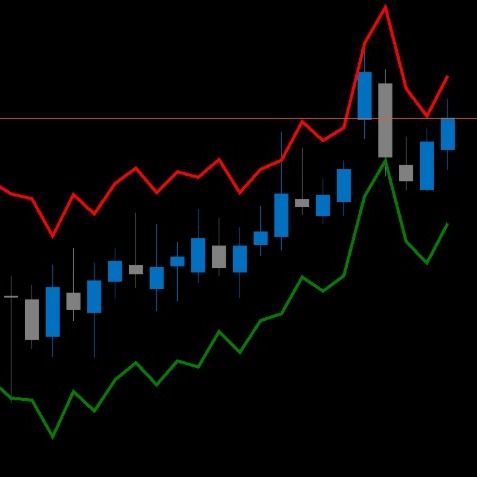
The algorithm calculates all the green and red candles separately depending on whether the previous candle was red or green and assigns scores if one or more lines were reached. The algorithm then calculates how many candles reached those levels in history and displays it as a percentage value on each line.


█ Example

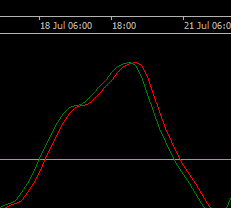
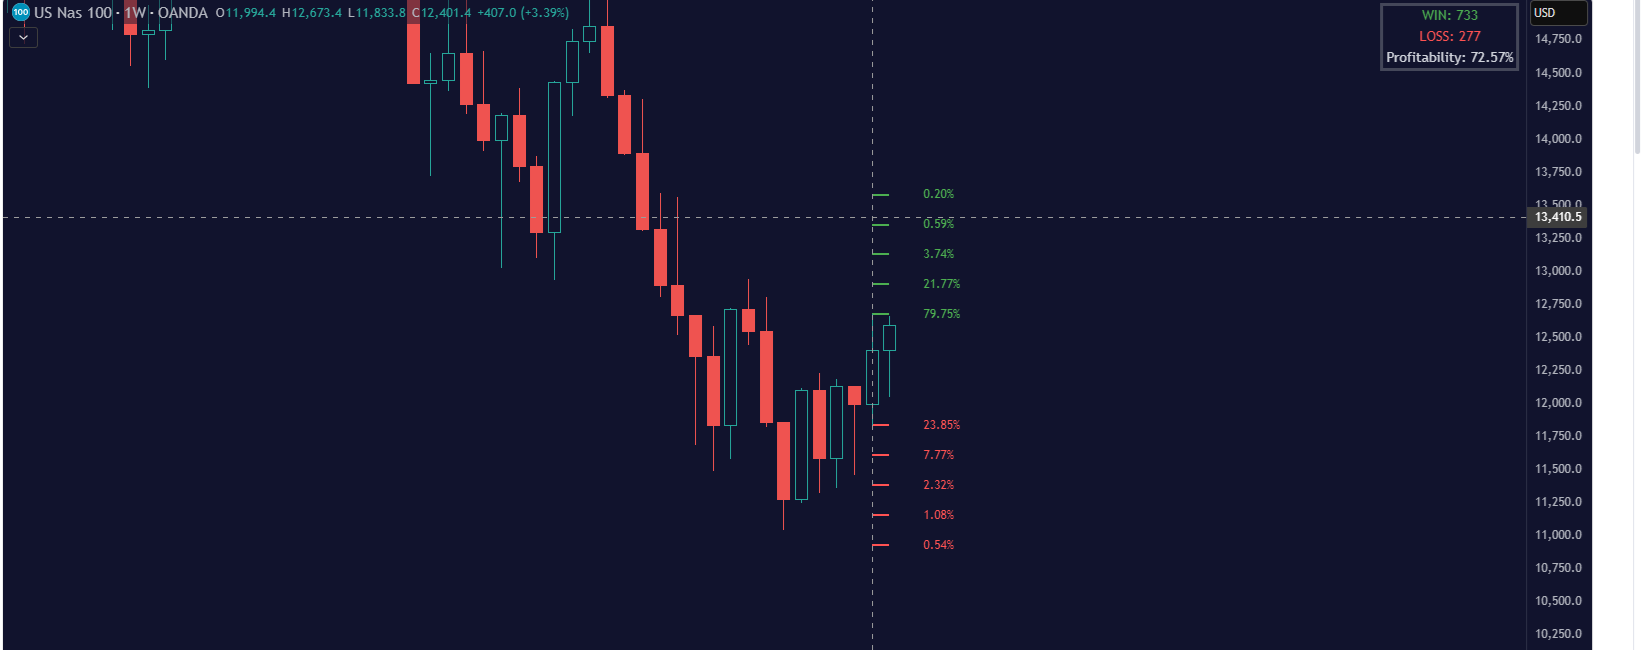
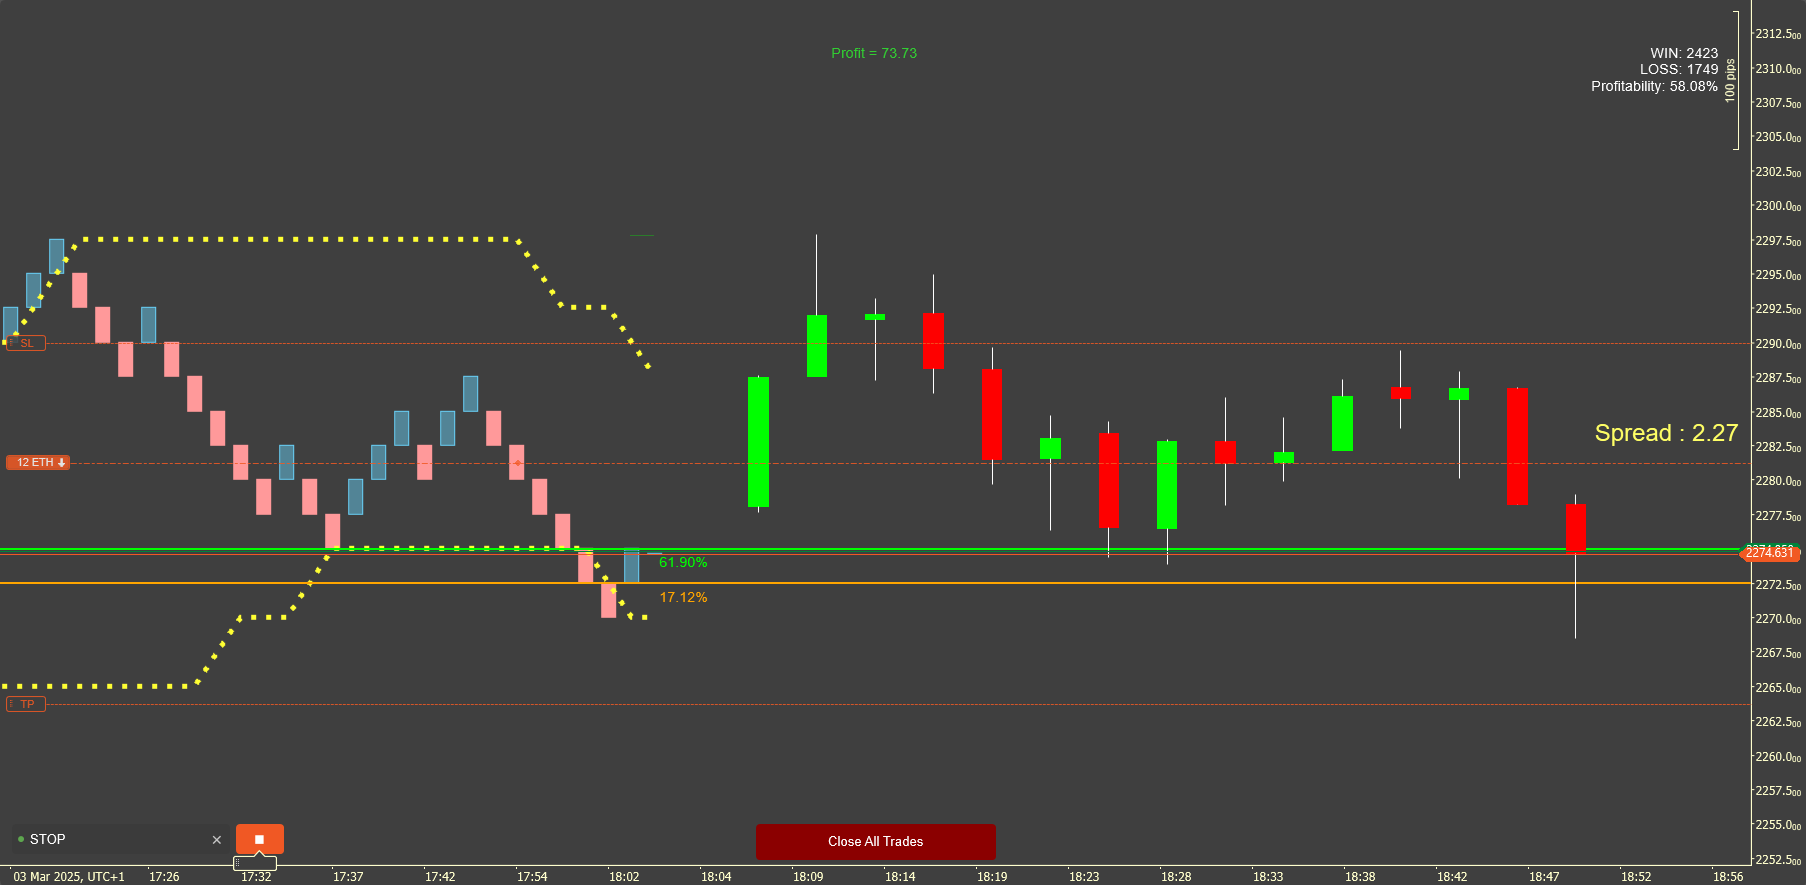
In this example, the previous candlestick was green; we can see that a new high has been hit 72.82% of the time and the low only 28.29%. In this case, a new high was made.

More from this author
Cumulative Delta Candles + VolumeProfile
Cumulative delta candles + volume profile
DynamicVolumeSupplyDemand
Supply and Demand Zones
Support Resistance Zones
Support and Resistance.
VolumeProfile_8
Scalpers Volume Profile
Tape reader
TAPE READER :-)
Insider_CumulativeDelta
Robust Cumulative delta,Atr and imbalance indicator.
MTF Candles
Multi Timeframe Candle drawing. Draw Any candles from any timeframe on your chart :-)
Indicator
NAS100
NZDUSD
XAUUSD
+13
ORDERFLOW_SKIA_Plynuly
This Indicator will show you Direction, Distance, and Time;
Indicator
Grid
NAS100
NZDUSD
+17
Institutional Volume Supply Demand
Volume Profile Supply Demand
Cumulative Delta_noSourceCode
Demo of my main indcator.
You may also like
Parabolic RSI Alert  V1
Master RSI reversals with Parabolic SAR precision! Get real-time alerts for high-probability trend changes.
Donchian Channel Pro
Tracks N-period highs/lows, HTF overlay, HUDs with ADX, RSI, session clocks. Customizable for precise trading.
[Hamster-Coder] Pivot Points MTF
[Hamster-Coder] Pivot Points (Multi Time Frame)
Indicator
Signal
Hammer Pattern Indicator
[Hamster-Coder] Pivot Points (Demo)
[Hamster-Coder] Pivot Points (Demo)
Fisher_m11
Fisher Transform with smoothing. Spot reversals and cycles with precision. Great for any market, any timeframe.
Daily Open Pivot Level
This indicator is a valuable tool for traders looking to identify significant opening price level of any asset.
Daily Sessions HighLow Helper
Shows daily and sessions highs / lows and session boxes, everything configurable
Indicator
Stocks
Commodities
Forex
buy sell
SmartSignal Pro: Precise BUY/SELL signals to profit in any market. Trade like a pro! 🚀
Indicator
NAS100
NZDUSD
Martingale
+22
Zigzag Trend
The ZigZag Trend is a market structure tool that filters out small price fluctuations and highlights major swing.
Fibonacci Prediction Channel
Designed to plot a future prediction channel based on Fibonacci retracement levels 📊
Vishal Volume Profile v2.0
Volume Profile plots traded volume at each price level, highlighting high activity zones of precise support & resistance
Indicator
Indices
XAUUSD
Breakout
+3
AnchoredVWAP
A precision overlay tool that combines session-aware VWAP logic and standard deviations.
Tape reader
TAPE READER :-)
Indicator
Indices
XAUUSD
Commodities
+8
ATR on Chart
Plots the ATR on the chart for easy visualization.
Indicator
NAS100
NZDUSD
XAUUSD
+11
RT VWAP
Unlock VWAP in cTrader! Choose anchor periods, price sources, and display deviation bands with real-time tick updates.
Tiny_Aim_Trainer
trading stress-relief “mini-game”
Pattern Signal Forex
Indicator pattern signal moment