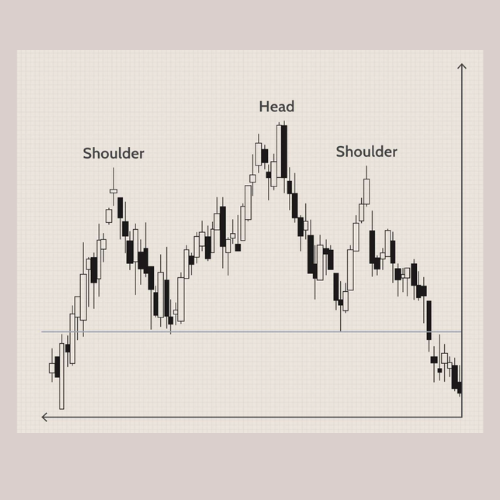
Head Shoulders Finder
5.0
03/09/2025
191
Desktop
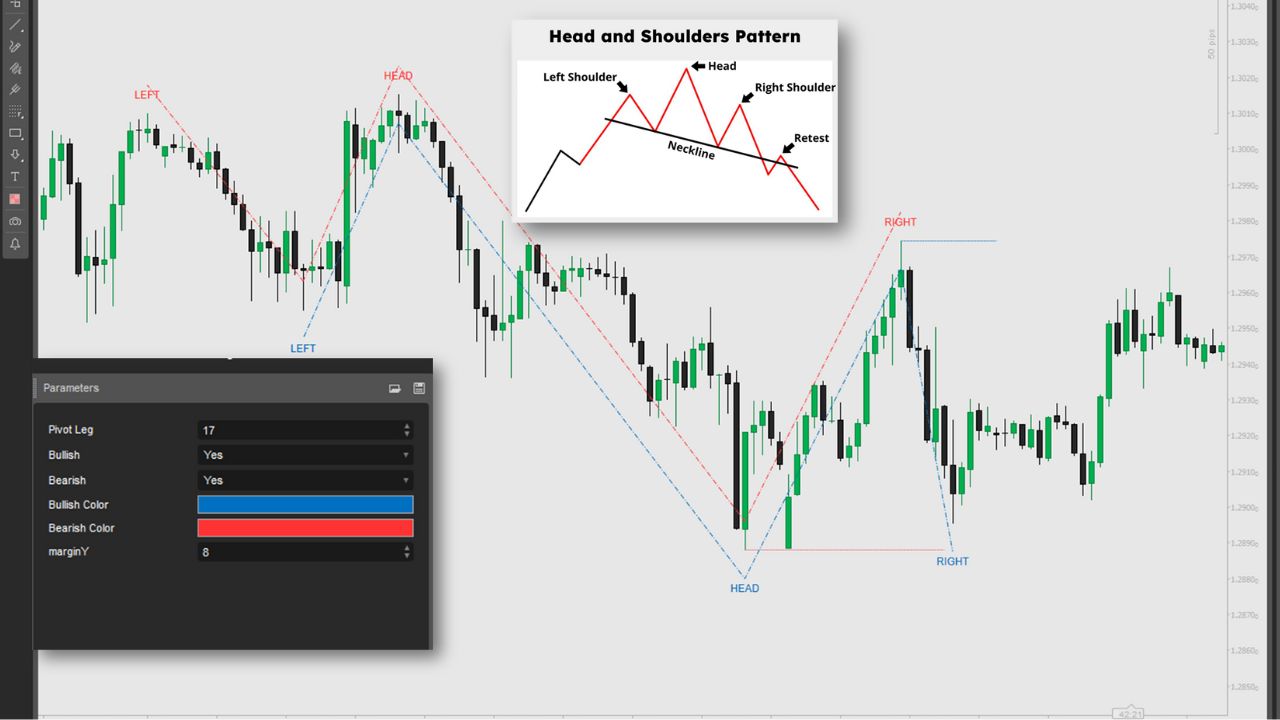
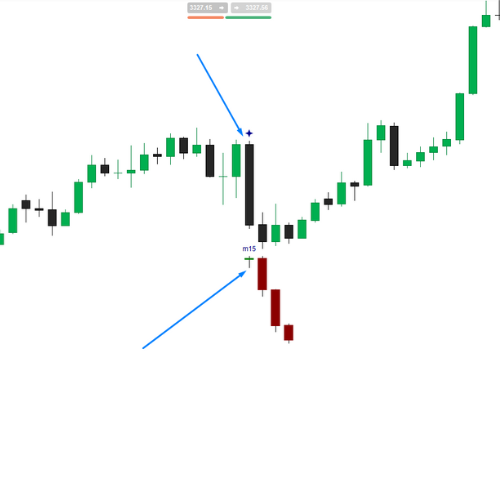
This indicator identifies Head and Shoulders and Inverted Head and Shoulders patterns by analyzing pivot highs and lows in price data. It plots lines, labels, and signals for potential trend reversals, triggering short conditions when the price crosses below the neckline (bearish) or long conditions when above (bullish). Traders can use these signals to enter short or long positions, combining with other analyses and risk management to optimize trading strategies.
5.0
Reviews: 1
5 | 100 % | |
4 | 0 % | |
3 | 0 % | |
2 | 0 % | |
1 | 0 % |
Customer reviews
August 18, 2025
Automatically detects Head & Shoulders patterns, customizable visuals. Cons: No pattern reliability filter, no alerts, false signals on low TFs.
More from this author
You may also like


.jpg)
!["[Hamster-Coder] Price" logo](https://market-prod-23f4d22-e289.s3.amazonaws.com/b9c21584-bde2-4113-83c1-d6e5d82a9ca1_Icon300.jpg)