Indicator
Breakout
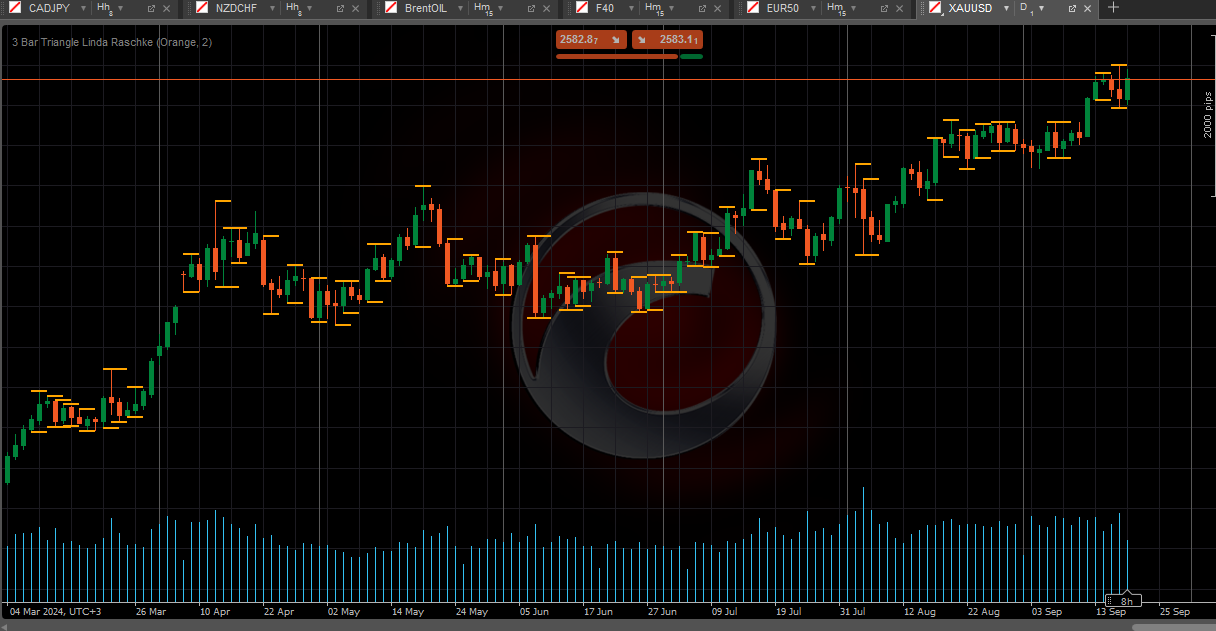
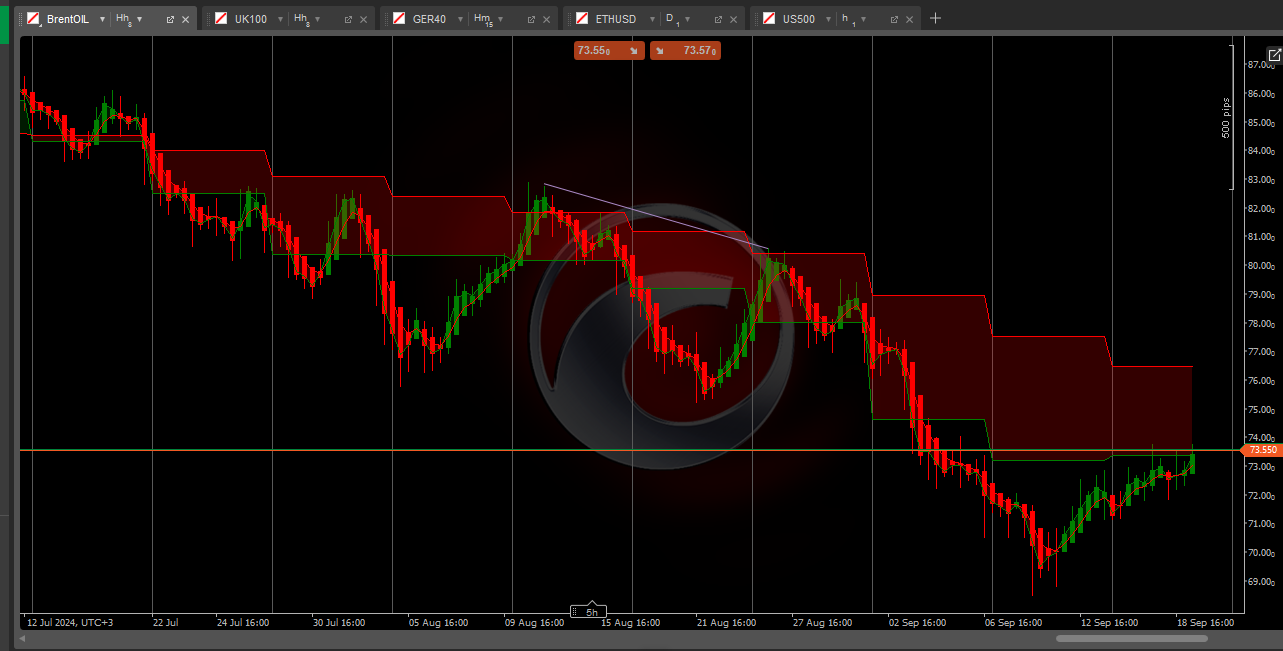
3 Bar Triangle by Linda Raschke
5.0
03/09/2025
428
Desktop
This pattern suggests consolidation or price squeezing, where price is contracting within a tighter range. The market is "coiling" up for a potential breakout in either direction, typically leading to a sharp movement once it breaks out of the triangle.
Trading the Breakout:
- Entry: Traders look for a breakout above the high of the pattern or below the low of the pattern, indicating the direction of the next move.
- Stop-loss: Placing a stop-loss outside the opposite side of the triangle (either above the high or below the low) helps manage risk.
- Targets: Some traders aim for a price move equal to the size of the triangle (the distance between the high and low of the first bar)
5.0
Reviews: 1
5 | 100 % | |
4 | 0 % | |
3 | 0 % | |
2 | 0 % | |
1 | 0 % |
Customer reviews
August 12, 2025
Pros: Identifies classic 3-bar triangle consolidation zones. Simple setup, visually clear. Stable across timeframes. Cons: No alerts or tooltips. Lacks volume filters and signal confirmation. Limited customization

You may also like
 (1).jpg)