Indicator
RSI
Breakout
XAUUSD
ATR
Commodities
Stocks
Forex
MACD
Crypto
Scalping
Candle Strength Oscillator
"Candle Strength Oscillator" logo
4.0
07/10/2025
20
Desktop
Since 13/09/2025
Sales
2
Free installs
422
"Candle Strength Oscillator" uploaded image"Candle Strength Oscillator" uploaded image"Candle Strength Oscillator" uploaded image"Candle Strength Oscillator" uploaded image"Candle Strength Oscillator" uploaded image

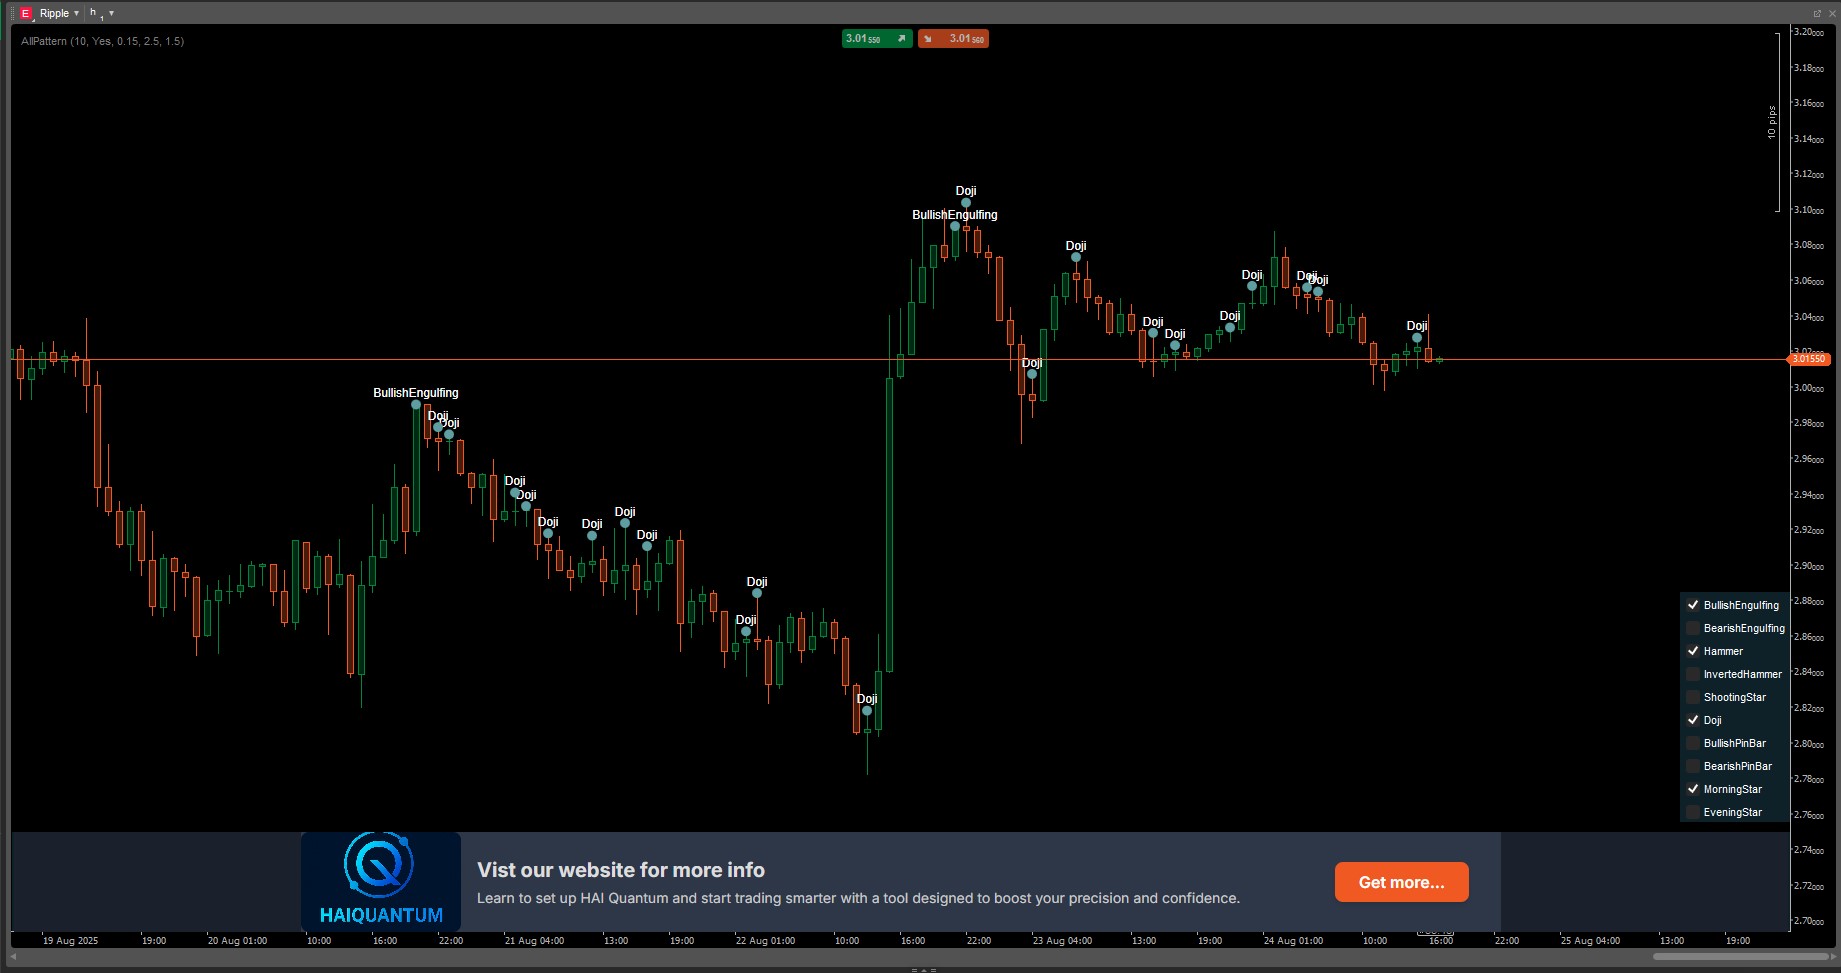
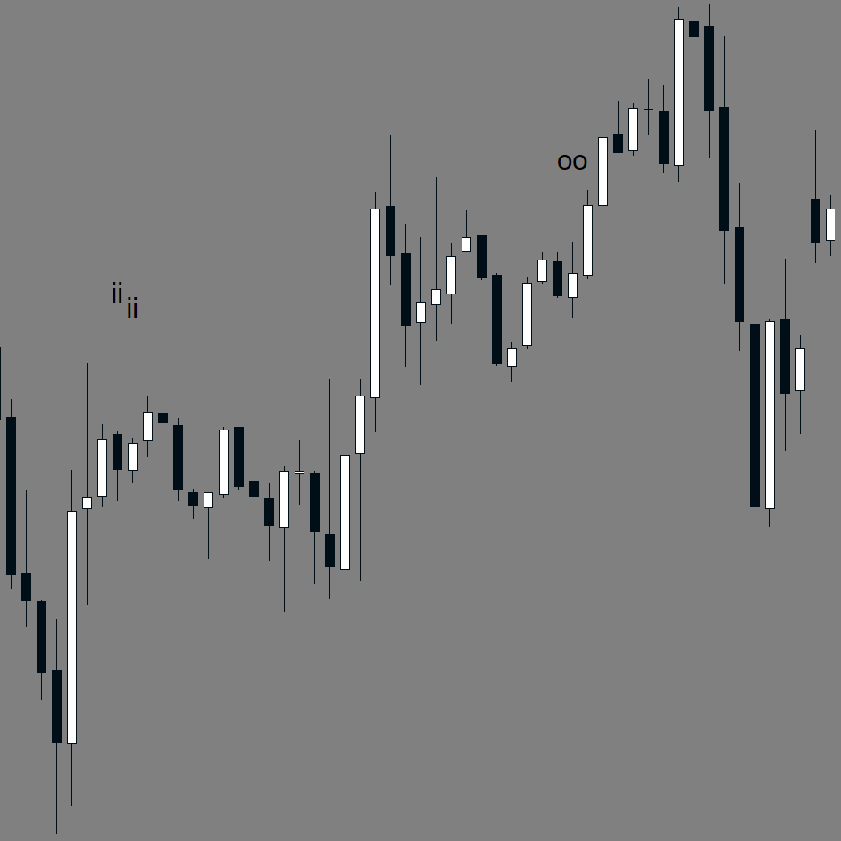
Candle Pressure Index (CPI) is a powerful yet easy-to-use indicator designed to reveal the hidden buying and selling pressure behind every candle. Instead of simply showing whether the price moved up or down, CPI digs deeper into how strongly buyers or sellers controlled the market within each candle. This makes it a unique tool for identifying trend strength, spotting reversals early, and confirming entry or exit points with higher accuracy.


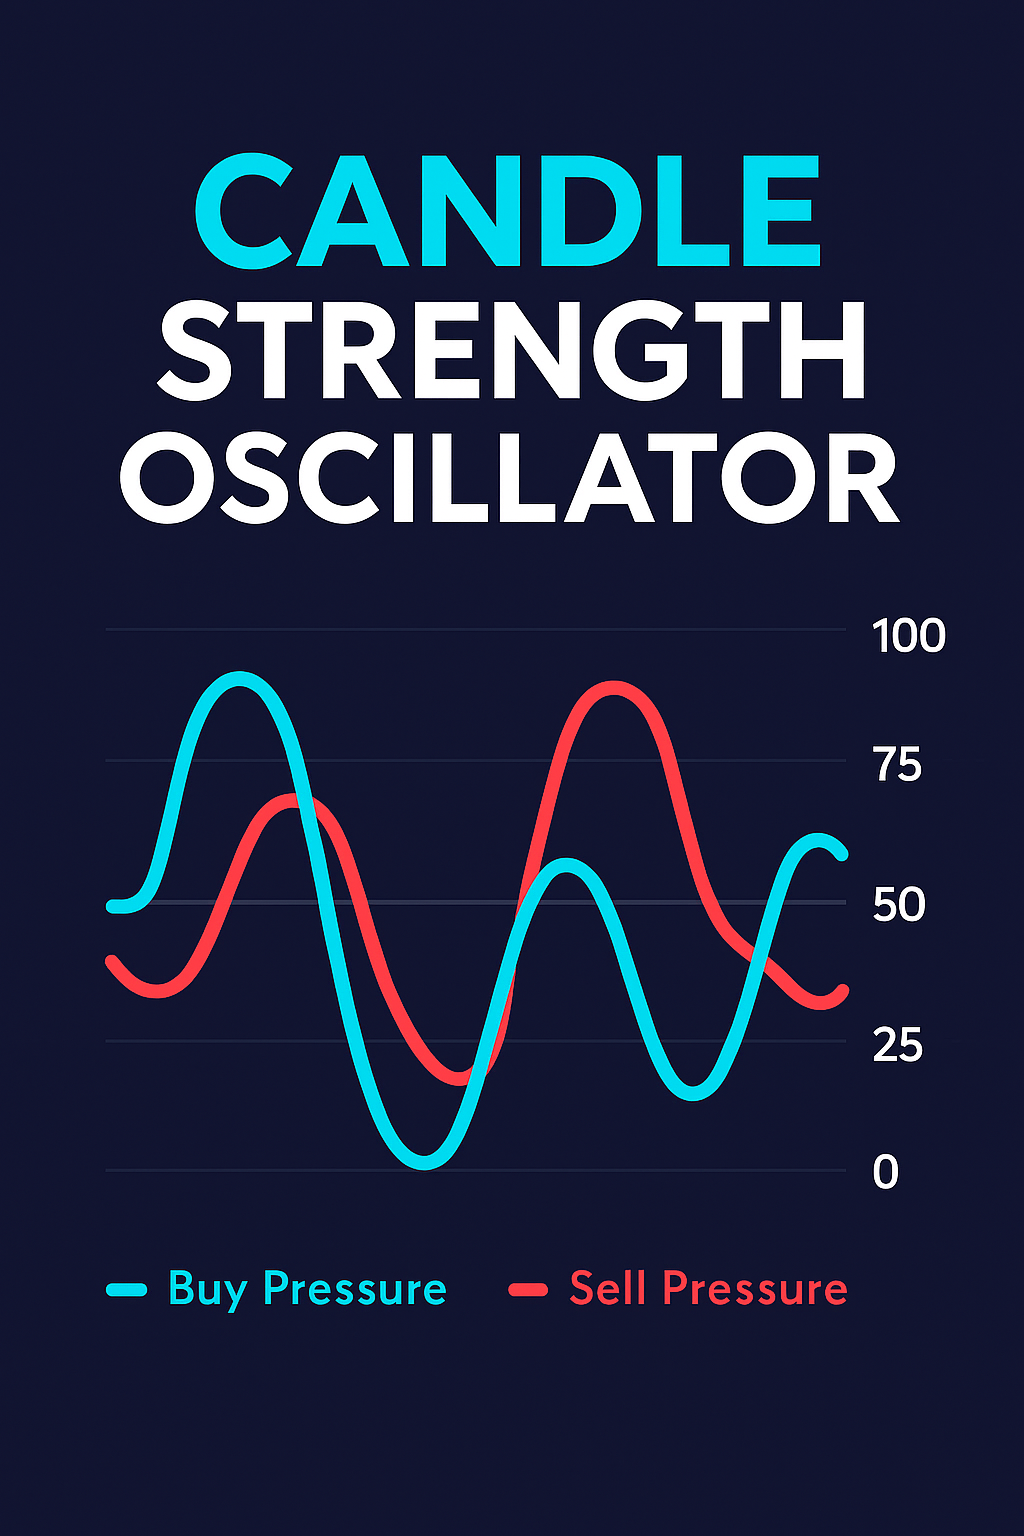
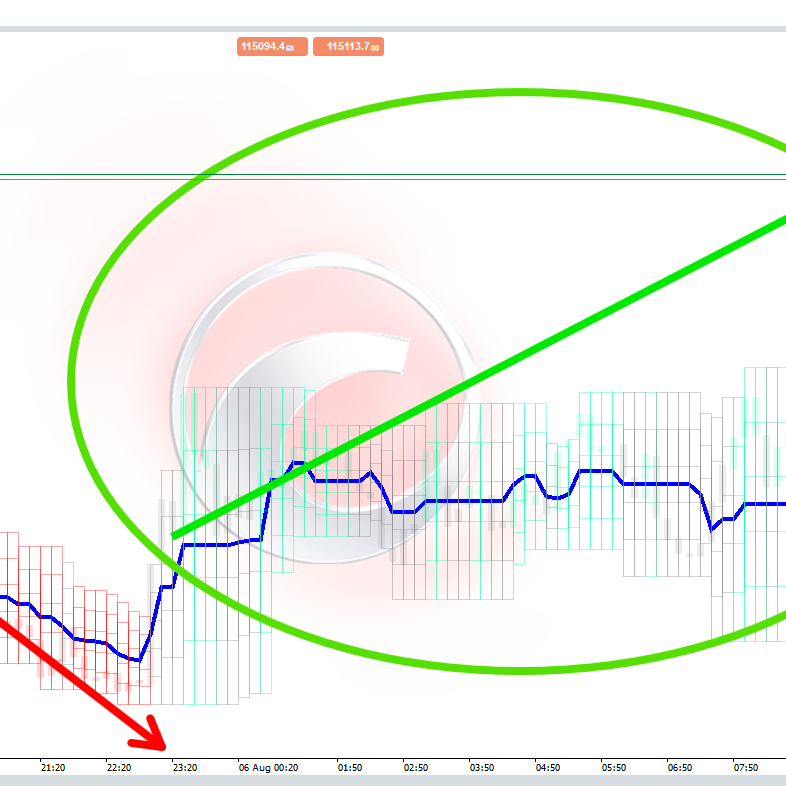
Unlike traditional oscillators that only react to price, CPI combines candle body dynamics, momentum, volume weighting, and trend analysis (ADX or EMA) to give you a comprehensive view of market pressure. With two smooth lines – Buy Pressure (cyan) and Sell Pressure (red) – traders can instantly see which side of the market is in control.


How to Read the Indicator


Buy Pressure (Cyan Line) – Represents the intensity of bullish control. A rising line shows increasing buyer dominance.


Sell Pressure (Red Line) – Represents the intensity of bearish control. A rising line shows stronger selling force.


Crossovers – When the Buy line crosses above the Sell line, it signals stronger bullish pressure (potential buying opportunity). When the Sell line crosses above, bearish pressure dominates (potential selling opportunity).


50-Level Zone – Readings around the middle (≈50) indicate balance between buyers and sellers, while extreme readings (above 75 or below 25) show strong directional pressure.


Trend Factor Boost – The indicator adapts its signals based on trend confirmation from ADX or EMA slope, reducing false signals during sideways markets.


How the Indicator Works


CPI calculates pressure using a weighted model that considers:


Candle structure: The body size and close position relative to the high/low.


Momentum: Price movement compared to the previous candle.


Volume: Tick volume weighting ensures that high-volume moves carry more significance.


Trend confirmation: Either ADX strength or EMA slope adds a boost factor to align signals with the prevailing trend.


Smoothing: A user-defined SMA filter ensures smooth and stable lines without losing responsiveness.


This advanced formula means that CPI not only reacts to price, but also understands why the price is moving – giving traders deeper insight into market behavior.


Key Features


Dual-Line Visualization – Instantly compare buy vs. sell pressure with color-coded lines (cyan for buyers, red for sellers).


Adaptive Trend Boost – Integrates ADX or EMA to confirm trend direction and reduce false signals.


Volume-Aware Calculation – Weighted by tick volume to highlight moves backed by real market participation.


Smoothed & Clean Display – Built-in SMA filter for smooth readings without laggy distortions.


Fully Customizable – Adjustable periods, weighting, and boost intensity to match any trading style.


Why Use Candle Pressure Index?


CPI is perfect for traders who want to go beyond simple price action and see the true battle between buyers and sellers. Whether you are a scalper, swing trader, or trend follower, this free indicator gives you the clarity needed to time entries, manage risk, and stay aligned with the market’s real direction.


Download the Candle Pressure Index (CPI) today – and trade with confidence by understanding the hidden forces driving every candle.

4.0
Reviews: 1
5
0 %
4
100 %
3
0 %
2
0 %
1
0 %
Customer reviews
October 20, 2025
Reads candle power like a charm 🔥 - Candle Strength Oscillator shows who’s really pushing the market. Great for timing reversals and confirming momentum!"
More from this author
Indicator
Grid
XAUUSD
Forex
+3
Daily Open Color Zones
indicator showing the Daily Open Line and instantly shading bullish and bearish zones.
Indicator
XAUUSD
Breakout
Stocks
+6
Signal Strike
Signal Strike is a professional trading indicator delivers clear, high‑confidence entry signals directly on your chart
cBot
RSI
XAUUSD
Breakout
+14
Super trend X
SuperTrend X cBot is a fully automated trading robot for cTrader built entirely on the power of the SuperTrend indicator
Indicator
Grid
XAUUSD
Commodities
+5
Trend Scope pro
Trend Scope Pro – Smarter Trend Analysis with Linear Regression Channels
Indicator
Indices
Breakout
XAUUSD
+9
Market Bias Gauge
Measure Market Strength at a Glance – Instantly
cBot
Breakout
XAUUSD
Commodities
+3
Gold Pulse Pro
Gold Pulse Pro – An automated trading system for gold (XAUUSD) precisely engineered and powered by advanced algorithms
Indicator
Grid
RSI
Breakout
+12
Trend Pulse X
is a trend-following indicator designed to provide a clear view of market direction, momentum, and strength
Indicator
XAUUSD
Breakout
Stocks
+6
Final Moving Average
Final Moving Average is an adaptive system designed to keep traders aligned with the true direction of the market
Indicator
RSI
XAUUSD
ATR
+3
RSI NextGen
The RSI NextGen is an advanced and modernized version of the classic Relative Strength Index (RSI)
Indicator
XAUUSD
Commodities
Forex
+10
Perfect Entry Price
Perfect Entry Price designed to help traders identify the most accurate and reliable price levels for market entries
Indicator
XAUUSD
Commodities
Forex
+5
BullBear Dynamics
BullBear Dynamics helps traders detect and interpret the balance between bullish and bearish momentum
cBot
RSI
Indices
Commodities
+7
Super trend RSI ADX
Supertrend RSI ADX is a trading system built for traders who demand precision, control, and steady performance.
Indicator
Grid
Breakout
XAUUSD
+10
Ultimate Trend ADX
Download Ultimate Trend ADX today and experience a smarter way to track market trends completely free on ctrader
cBot
RSI
XAUUSD
Commodities
+9
equilibrium Gravity USDJPY
Equilibrium Gravity USD/JPY works perfectly on USD/JPY on 1 minute and 5 minute time frames.
Indicator
Grid
RSI
Breakout
+6
Final Stochastic Oscillator
Final Stochastic Oscillator is a next-generation upgrade of the classic stochastic indicator
Indicator
RSI
Breakout
XAUUSD
+12
Liquidity Pressure Index
Liquidity Pressure Index is a tool that gives traders deeper insights into the hidden dynamics of market liquidity
cBot
RSI
Breakout
XAUUSD
+7
Spectral Frequency Engine
Spectral Frequency Engine — AI-Driven FFT cbot for EUR/USD (M5)
Indicator
Grid
RSI
XAUUSD
+12
PFO Price Flow Oscillator
technical analysis tool designed to provide traders with a structured view of market momentum and volatility
You may also like
Breakout Mode Patterns
Brooks price action breakout mode patterns
Indicator
RSI
Breakout
XAUUSD
+5
Prediction Based on Linreg & ATR
📊Predicts price movement by combining multi-timeframe trend analysis, market volatility 📉, and..
Indicator
RSI
Breakout
XAUUSD
+4
SmartTrend Support & Resistance Lines
🚀 Auto-detects support/resistance & trend channels! Saves time ⏳, spots key levels 🔍
Momentum Trend Analyzer
Provides comprehensive trend and momentum analysis by combining EMAs, RoC, normalized ATR, RSI, and volume..
Indicator
NAS100
NZDUSD
XAUUSD
+16
Swing AVWAP Pro
Adaptive Swing-Anchored VWAP that tracks market structure shifts with precision and clarity.
Indicator
XAUUSD
Commodities
ATR
+1
[Stellar Strategies] Visual Trend Momentum
Visual Trend Momentum is a MA/ATR/Volume trend tool. Visual signals for strong trends & reversals. Customizable. 📈📉
Indicator
Indices
RSI
Breakout
+9
Advanced HTF Trend Buy & Sell Trading System
Detects breakouts 📈 auto-draws levels 🚀 confirms trends 🐻 dynamic signals 🎨 customizable for any asset & timeframe.
SupertrendHTF
Overlay higher-timeframe SuperTrend to filter noise, follow real trends, and avoid lower-timeframe whipsaws. As
Smart Floating Risk Pro
📊 Smart Floating Risk Pro – Advanced Risk Management for cTrader
Indicator
Breakout
ATR
Signal
UT Bot
ATR-based trend following tool with trailing stop logic. Highlights crossovers using clean up/down bands and bar colour.
Indicator
Indices
Stocks
Forex
+4
MACD Pro Trader
🚀 MACD Pro Trader – Advanced MACD with buy/sell signals, custom MAs & color-coded histograms for smarter trading! 📈🔥
Order Block detector PRO
Order Block PRO — Smart Institutional Zone Detector
Indicator
Grid
NAS100
NZDUSD
+16
AllPattern
🔍 Discover All Candlestick Patterns… Absolutely Free!
VolumeRenkoRange
Volume for Renko/Range
Indicator
Grid
NAS100
NZDUSD
+16
3D Normal Candles bY Mohammad KHR
3D candles for Normal OHLC candles.
Indicator
Signal
Trend Bars Color
New Trend whit buy-sell signal
Indicator
NAS100
Indices
XAUUSD
+4
PrevDayProjection
Automatically calculates the previous day’s high and low, determines the range, and then projects Fibonacci levels.
Indicator
Forex
EURUSD
GBPUSD
AlgoCorner McGinley Dynamic
Designed to follow price more naturally, adjusting automatically to market speed, to reduce lag and false signals.