Indicator
forex
breakout
btcusd
xauusd
crypto
scalping
macd
"Market Bias Gauge" logo
Market Bias Gauge
4.0
15/09/2025
16
Desktop
"Market Bias Gauge" uploaded image"Market Bias Gauge" uploaded image"Market Bias Gauge" uploaded image"Market Bias Gauge" uploaded image"Market Bias Gauge" uploaded image

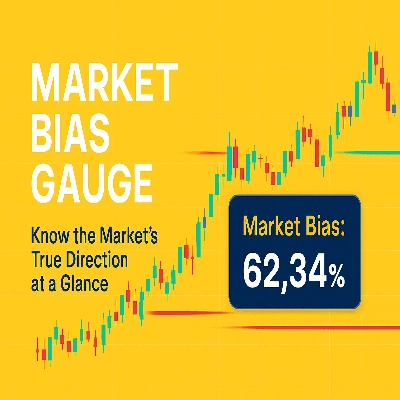
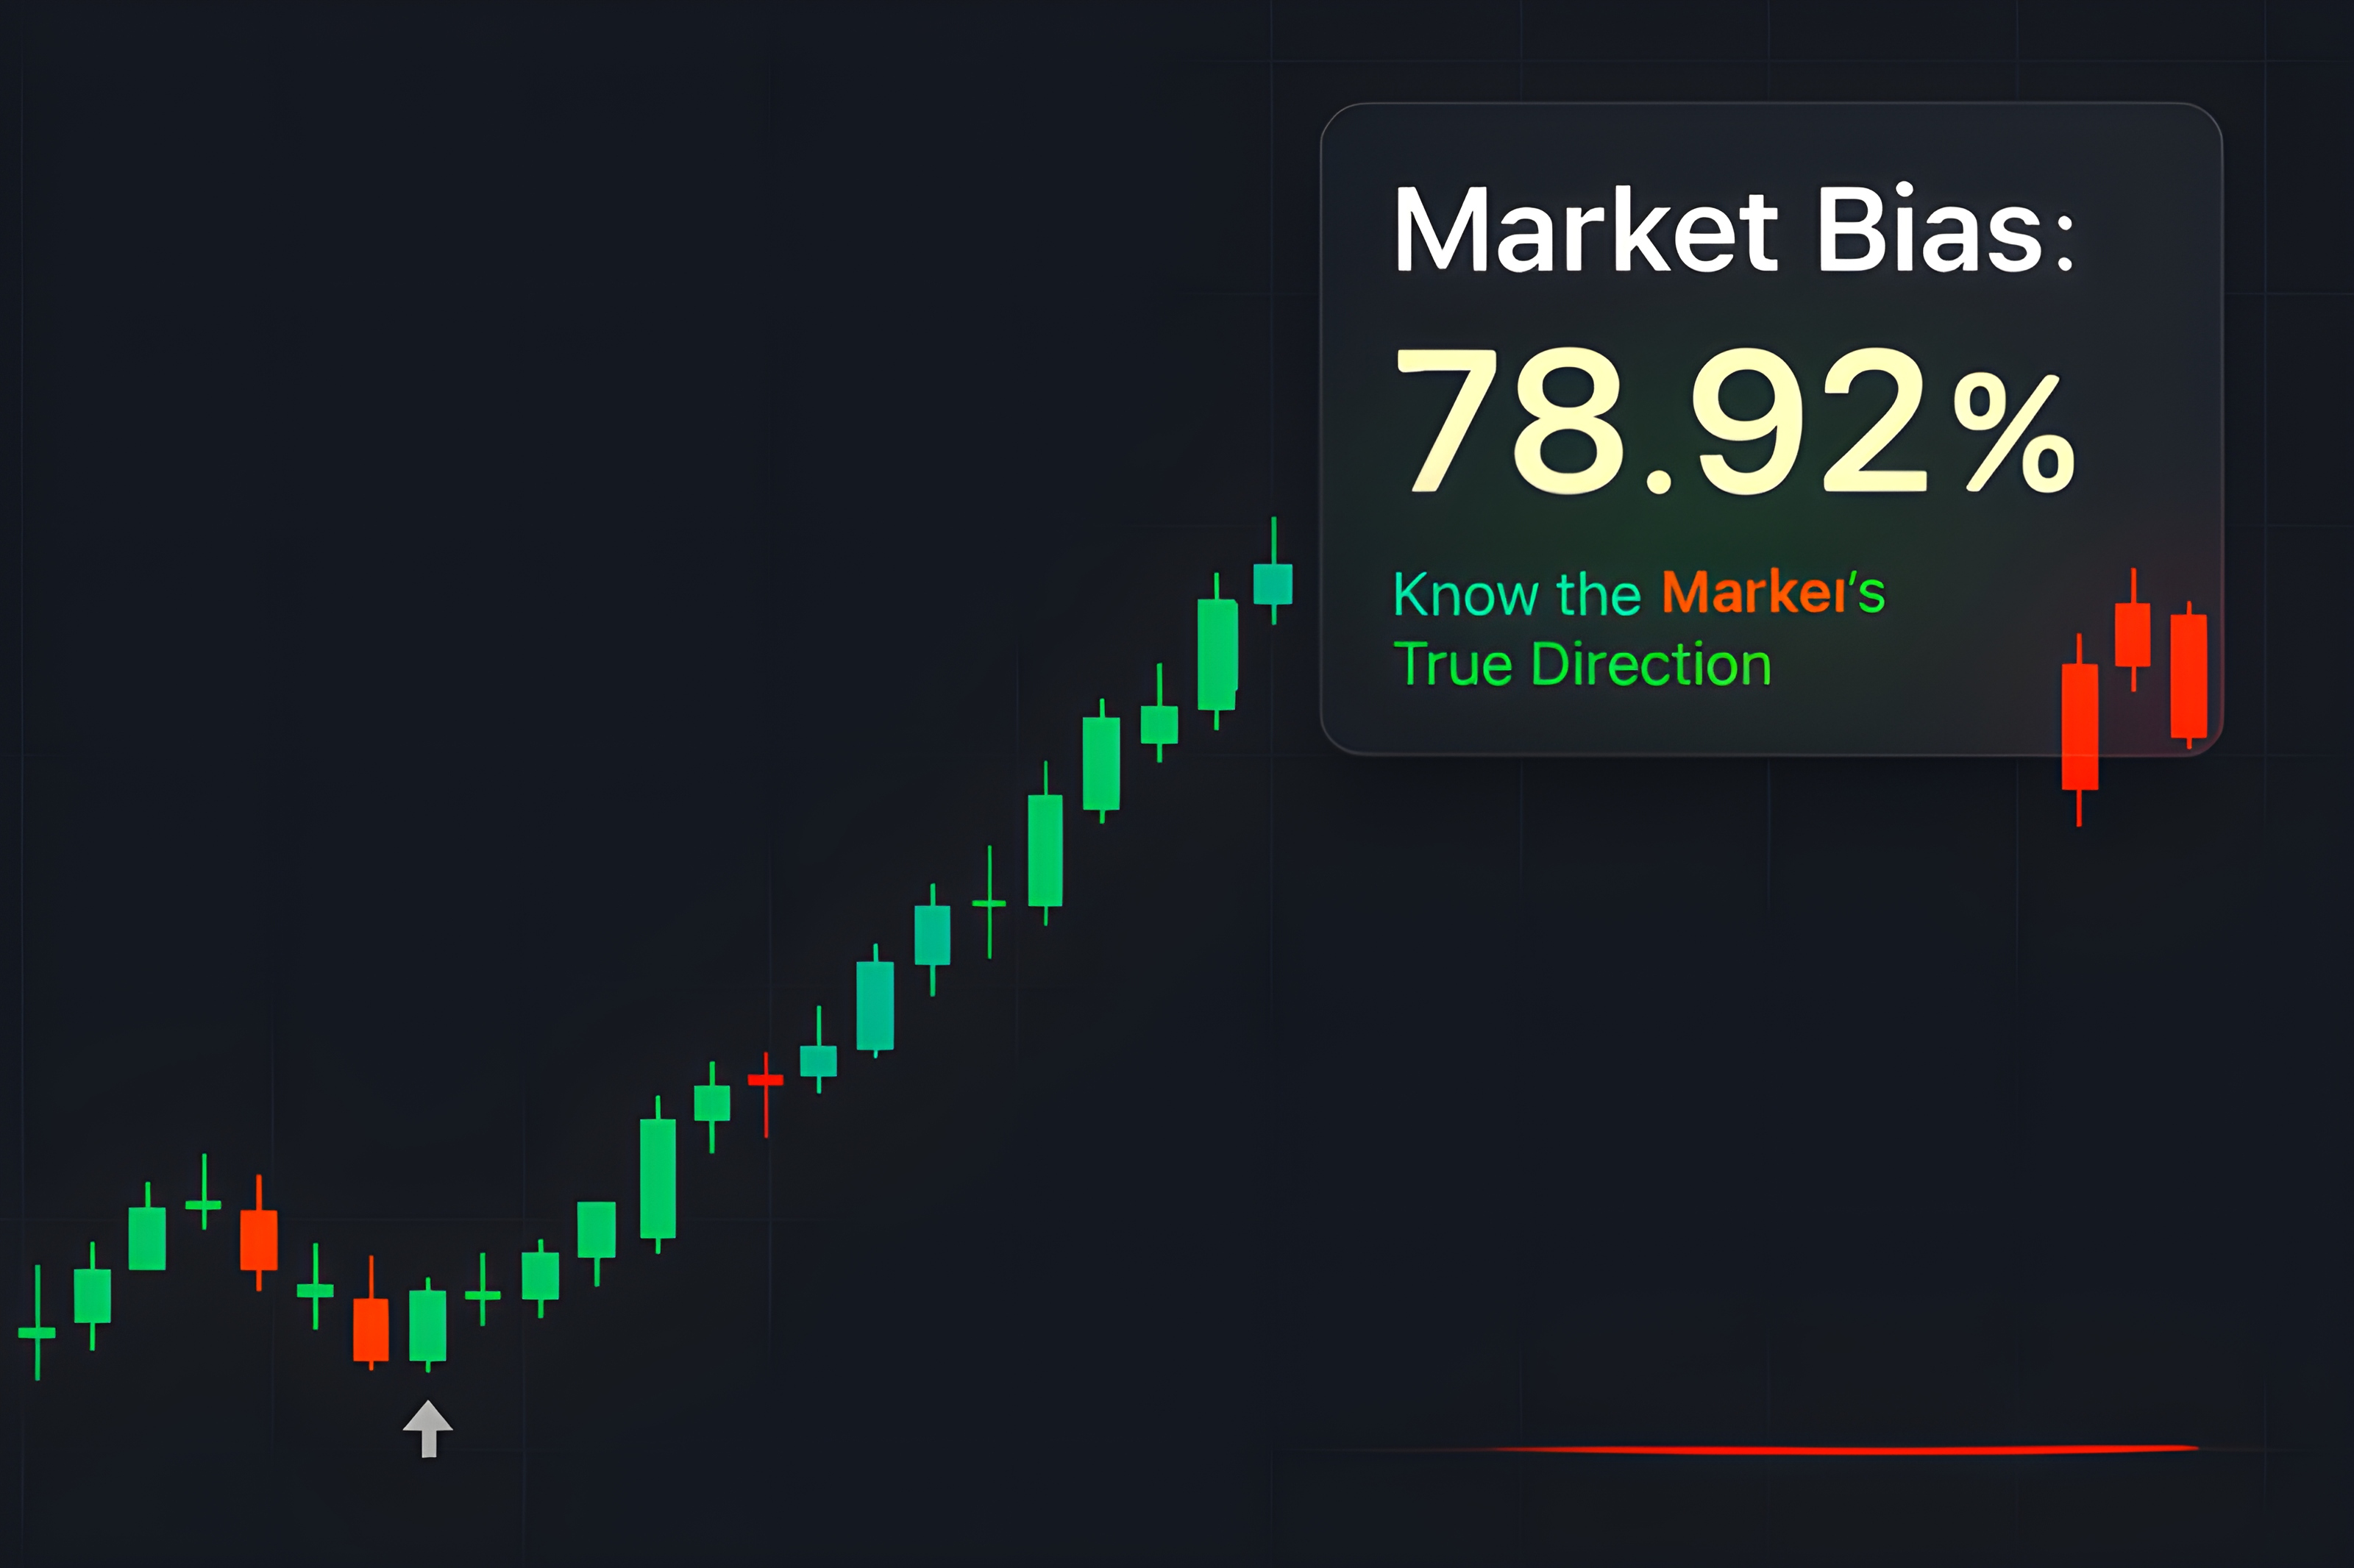
Market Bias Gauge Indicator

The Market Bias Gauge is a technical analysis tool designed to provide traders with an instant, clear view of market momentum, directly on their chart. Instead of complex setups or cluttered indicators, this tool delivers a single, powerful metric: the percentage of bullish vs. bearish movement over your chosen period.


Purpose of the Tool:

This tool aims to help you instantly gauge whether buyers or sellers are in control, which can assist you in making faster, more confident trading decisions.


How to Read the Momentum Percentage:


Below 50%: Indicates that bearish momentum dominates. Sellers are stronger than buyers over the selected period, and the market bias is to the downside.


Above 50%: Indicates that bullish momentum dominates. Buyers are stronger than sellers over the selected period, and the market bias is to the upside.


Exactly 50%: Indicates that the market is balanced, with no clear directional bias.


Features:


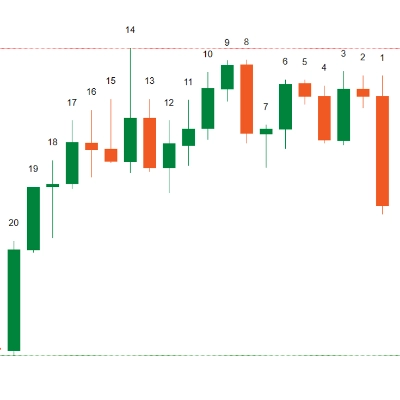
Instant Momentum Reading: Calculates the percentage of upward vs. downward price changes over the last candles (default: 60).


Clear On-Chart Display: Shows the momentum value in large, readable text, perfectly centered on your chart.


Fully Customizable Look: Choose your preferred font, size, and color to match your trading style.


Neutral Market Detection: Displays a balanced 50% reading when the market shows no net movement.


Lightweight & Fast: Runs smoothly on any chart, even with large datasets or live trading.


Dynamic Updates: Refreshes automatically with every new candle, keeping you in sync with the market.


Why Traders Might Love It:


No Guesswork: See market bias in a single glance.


Better Timing: Spot shifts in momentum before they appear on traditional indicators.


Perfect Companion: Works alongside your existing strategy without adding chart clutter.


Disclaimer

The Market Bias Gauge is a technical analysis tool intended for informational and analytical purposes only. This tool does not provide financial or investment advice and does not guarantee profits. Trading in financial markets involves significant risk and may result in the loss of your capital. You are solely responsible for your investment decisions. You should use this tool as part of a comprehensive trading strategy that includes risk management.

More from this author
Indicator
forex
eurusd
xauusd
+3
Daily Open Color Zones
indicator showing the Daily Open Line and instantly shading bullish and bearish zones.
You may also like
Indicatore livelli numeri tondi_fabio23.traders
Indicatore dei livelli numeri tondi sul grafico , regolabile.Indicator of levels round numbers on the graph, adjustable
Indicator
indices
MFI-MTF
Multi-timeframe Money Flow Index
Goldenhours
The Session Golden Hours indicator is designed for serious traders looking to visualize high-probability
Indicator
forex
eurusd
EconomicForex
ECONOMIC FOREX:provides insights into inflation, nominal interest rates and real interest rates, in the line chart
Indicator
breakout
btcusd
supertrend
+5
Prediction Based on Linreg & ATR
📊Predicts price movement by combining multi-timeframe trend analysis, market volatility 📉, and..
Indicator
breakout
btcusd
supertrend
+5
Channel Price Predictor
🔮Channel Price Predictor: Anticipates future price zones with trend channels based on volatility and projections." 📈
Indicator
bollinger
indices
rsi
Clustering
Clustering tool for traders with visual insights into market patterns.
Indicator
forex
indices
commodities
+2
Advanced Swings
ICT Advanced Swings Indicator – Multi-Timeframe Precision
IR Moving Average
 this moving include everything that a trader needs from Moving Average.
Golden Boom And Crash Spike Detector
Golden Boom and Crash Spike Detector is a trading tool designed for Crash 300 and Boom 300 indices on M1 Timeframe.
Premium Discount Zones
Premium Discount Zones" spots key areas (🟣Premium/🟢Discount) using recent highs/lows & volume..............
Indicator
forex
indices
rsi
+3
Advanced RSI Indicator
Advanced RSI Indicator with multi-MA smoothing, Bollinger Bands, divergence detection, and fill zones for cTrader.
R S
This indicator is a simple, single-timeframe tool for showing candle sentiment directly on your chart. If you want a mor
Ichimoku Kinko Hyo
Ichimoku Kinkō Hyō with fixed shift to 25 as Ctrader calculate it from 0 and values was wrong for Chikou Span and Kumo.
IR Spread
show spread on chart
KAMA
Custom KAMA Indicator – Optimized for Speed and Precision
Trinity StochX
Indicator Stochastic With RSI
overbought oversold
Overbought Oversold Indicator