Indicator
XAUUSD
Commodities
Forex
Signal
EURUSD
BTCUSD
AI
SMC
Indices
Stocks
Supertrend
Crypto
Scalping
Perfect Entry Price
"Perfect Entry Price" logo
06/10/2025
Desktop
Since 13/09/2025
Free installs
249
"Perfect Entry Price" uploaded image"Perfect Entry Price" uploaded image"Perfect Entry Price" uploaded image"Perfect Entry Price" uploaded image"Perfect Entry Price" uploaded image"Perfect Entry Price" uploaded image

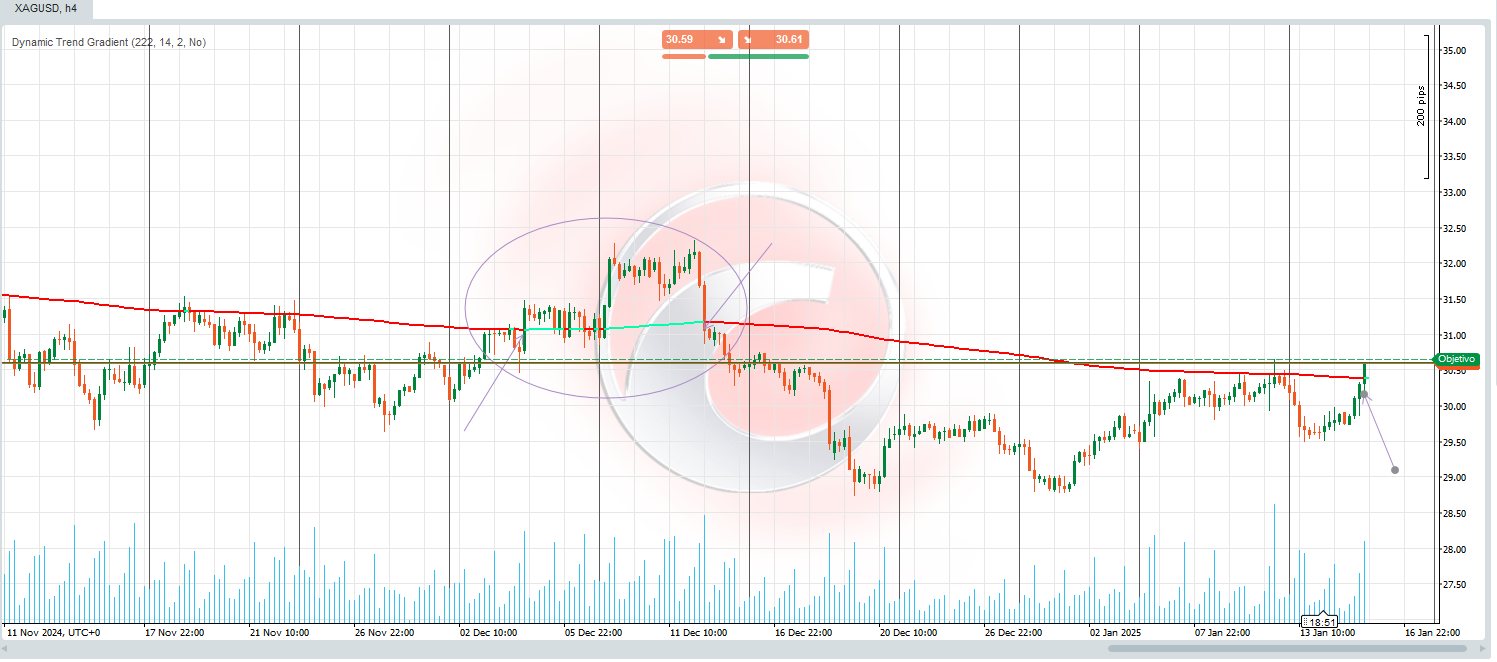
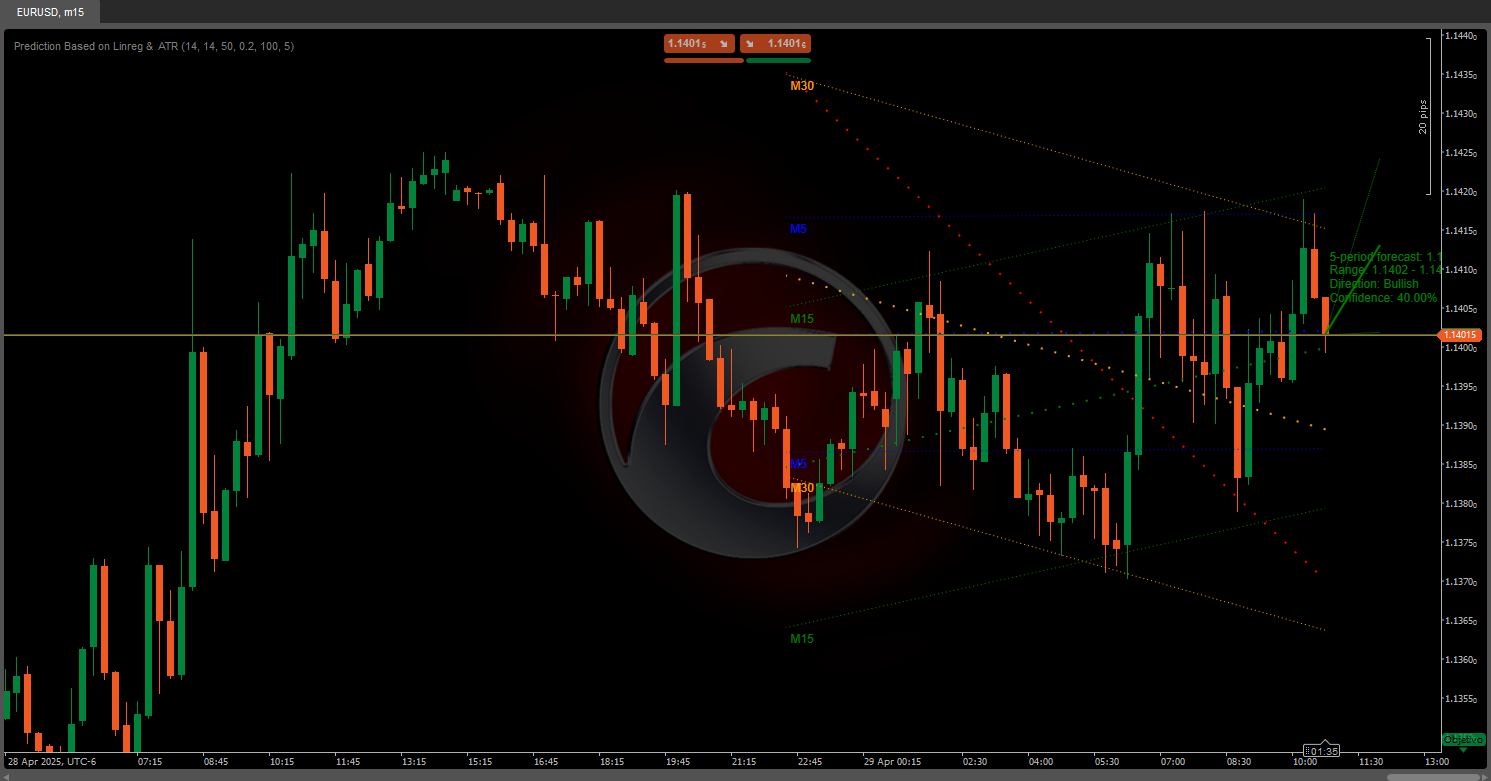
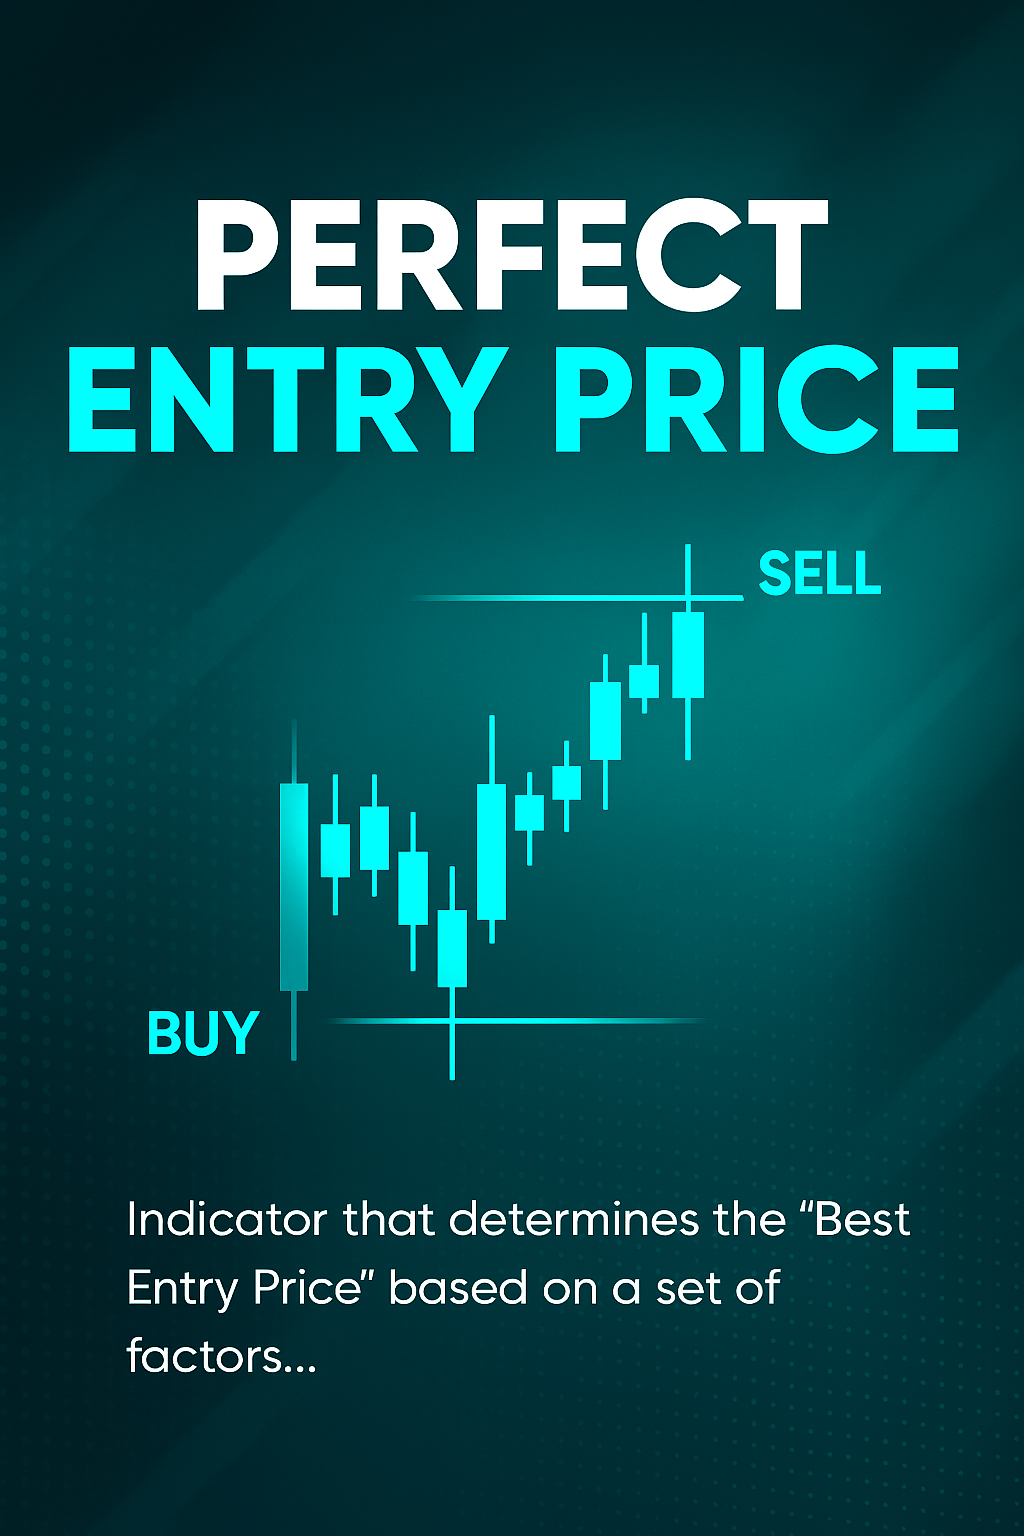
Perfect Entry Price is a next-generation indicator designed to help traders identify the most accurate and reliable price levels for market entries.

It automatically scans market structure, volume dynamics, and price behavior to locate zones where a reversal or continuation is most likely to happen.

The indicator is ideal for traders who want to enter the market exactly when the probability is highest and risk is lowest — whether you are scalping, day trading, or swing trading.


How It Works (Simplified Explanation)


The indicator continuously analyzes recent market data to evaluate where institutional traders may have entered or reacted to price.

It measures several technical and behavioral factors to generate a "Best Entry Level."

Once detected, the level is drawn automatically as a colored horizontal line on your chart:


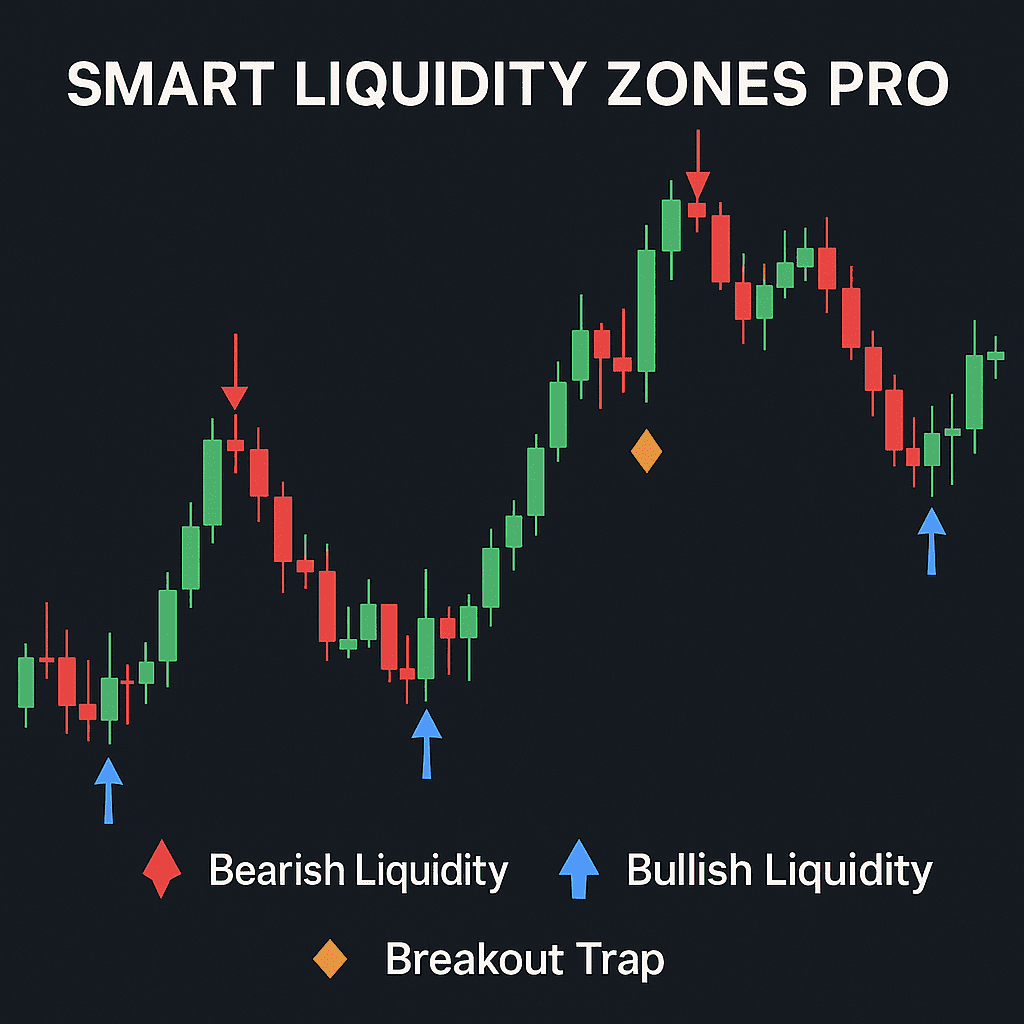
🔵 Blue Line – Suggests a potential Buy Entry Zone


🔴 Red Line – Suggests a potential Sell Entry Zone


When a valid setup appears, a message appears at the top-left corner of the chart showing:

Signal found — BUY (or SELL) at [price] followed by a short explanation of the confirmation factors used.


If you see the message “No Signal” in black text, it means no strong entry point currently exists for that timeframe.

In that case, simply switch to another timeframe (for example, from M5 to M15 or H1) to refresh and re-analyze the market structure.


The logic is adaptive and recalculates continuously in real time — meaning every tick re-evaluates market conditions for maximum precision.


How to Read the Indicator


Wait for a signal — A “BUY” or “SELL” message will appear with a horizontal line.


Observe price behavior — Watch how price reacts when it approaches the marked level.


Use confirmations — Combine it with your own confluence tools (trendlines, RSI, volume, etc.) if desired.


No signal? — The yellow text “No Signal” means conditions are not ideal yet; try another timeframe.


Enjoy clarity — All lines are automatically updated and managed; no manual drawing is needed.


Key Features


Smart Entry Detection — Uses advanced multi-factor evaluation to locate the most probable entry price.


Higher-Timeframe Confirmation — Automatically checks trend alignment across multiple timeframes for stronger accuracy.


Auto-Updating Levels — All outdated lines are deleted and replaced automatically to keep your chart clean.


Real-Time Adaptive Logic — Constantly recalculates based on the latest market data, not just past bars.


Clear Visual Alerts — Displays text notifications directly on the chart for instant awareness.


Why Choose Perfect Entry Price


Unlike typical support/resistance or signal generators, Perfect Entry Price focuses on the exact level where professional money is most likely to act.


It filters out weak areas and highlights only those with multiple confirmations, giving traders the confidence to act decisively.

No confusing parameters — simply load it, watch the chart, and trade the best opportunities with unmatched precision.


0.0
Reviews: 0
Customer reviews
No reviews for this product yet. Already tried it? Be the first to tell others!
More from this author
Indicator
Grid
XAUUSD
Forex
+3
Daily Open Color Zones
indicator showing the Daily Open Line and instantly shading bullish and bearish zones.
Indicator
Grid
XAUUSD
Commodities
+5
Trend Scope pro
Trend Scope Pro – Smarter Trend Analysis with Linear Regression Channels
Indicator
Indices
Breakout
XAUUSD
+9
Market Bias Gauge
Measure Market Strength at a Glance – Instantly
cBot
Breakout
XAUUSD
Commodities
+3
Gold Pulse Pro
Gold Pulse Pro – An automated trading system for gold (XAUUSD) precisely engineered and powered by advanced algorithms
Indicator
RSI
XAUUSD
ATR
+3
RSI NextGen
The RSI NextGen is an advanced and modernized version of the classic Relative Strength Index (RSI)
Indicator
XAUUSD
Breakout
Stocks
+6
Final Moving Average
Final Moving Average is an adaptive system designed to keep traders aligned with the true direction of the market
Indicator
Grid
RSI
Breakout
+12
Trend Pulse X
is a trend-following indicator designed to provide a clear view of market direction, momentum, and strength
Indicator
XAUUSD
Breakout
Stocks
+6
Signal Strike
Signal Strike is a professional trading indicator delivers clear, high‑confidence entry signals directly on your chart
Indicator
XAUUSD
Commodities
Forex
+5
BullBear Dynamics
BullBear Dynamics helps traders detect and interpret the balance between bullish and bearish momentum
cBot
RSI
Indices
Commodities
+7
Super trend RSI ADX
Supertrend RSI ADX is a trading system built for traders who demand precision, control, and steady performance.
Indicator
Grid
RSI
Breakout
+6
Final Stochastic Oscillator
Final Stochastic Oscillator is a next-generation upgrade of the classic stochastic indicator
cBot
RSI
XAUUSD
Commodities
+9
equilibrium Gravity USDJPY
Equilibrium Gravity USD/JPY works perfectly on USD/JPY on 1 minute and 5 minute time frames.
Indicator
Grid
Breakout
XAUUSD
+10
Ultimate Trend ADX
Download Ultimate Trend ADX today and experience a smarter way to track market trends completely free on ctrader
Indicator
RSI
Breakout
XAUUSD
+12
Liquidity Pressure Index
Liquidity Pressure Index is a tool that gives traders deeper insights into the hidden dynamics of market liquidity
cBot
RSI
Breakout
XAUUSD
+14
Super trend X
SuperTrend X cBot is a fully automated trading robot for cTrader built entirely on the power of the SuperTrend indicator
Indicator
RSI
Breakout
XAUUSD
+7
Candle Strength Oscillator
The Candle Pressure Index is a powerful, user-friendly indicator that reveals hidden market pressure inside candles.
Indicator
Grid
RSI
XAUUSD
+12
PFO Price Flow Oscillator
technical analysis tool designed to provide traders with a structured view of market momentum and volatility
cBot
RSI
Breakout
XAUUSD
+7
Spectral Frequency Engine
Spectral Frequency Engine — AI-Driven FFT cbot for EUR/USD (M5)
You may also like
Rsi Scalp Indi
RSI Scalper delivers split‑second entries on volatile assets.
Order Block Finder
Order Block Detector is built to spot and display Order Blocks on chart, often triggering strong price reactions.
SwingHighLow
Auto-detect swing highs/lows. Spot reversals, map structure, and filter noise with adjustable strength.
Previous Day Liquidity Zones (PDH - PDL)
Useful indicator for traders who want to visualize key price levels based on previous daily highs and lows.
Indicator
RSI
Breakout
Supertrend
+1
Dynamic Trend Gradient
Identifies trends with moving averages & volatility. Base levels = bullish 🐂 or bearish 🐻 signals. Reversals detected!
Indicator
RSI
Signal
MA-RSI HTF Confirmation
MA-RSI HTF Confirmation: Eliminate false signals and trade with confidence!
Indicator
NAS100
NZDUSD
Breakout
+11
Previous day Key Levels
Previous day key levels indicator
Indicator
RSI
Breakout
XAUUSD
+5
Prediction Based on Linreg & ATR
📊Predicts price movement by combining multi-timeframe trend analysis, market volatility 📉, and..
SmartLiquidityZonesPRO
Smart Liquidity Zones PRO auto-detects liquidity grabs, wicks, traps & manipulations — trade like the smart money.
Indicator
Grid
NAS100
NZDUSD
+17
Institutional Pattern bY MohammadKHR
Institutional Level Trend Direction at it's best for 2025 & Beyond.
Indicator
Indices
Forex
POC session line
Displays the POC line for previous sessions in an easy to see manner.
Indicator
Indices
Commodities
Forex
Smart Floating Risk - Premium version
The Floating Risk Indicator is an essential tool for traders who prioritize risk management.
Indicator
Indices
RSI
XAUUSD
+7
RSI Divergence
Detects bullish and bearish divergences
Indicator
VWAP
ZigZag
RSI
+6
RSI T3 overbought and oversold area
xhobaniFX_ADR-Lines
xhobaniFX_ADR-Lines: Average Daily Range Horizontal Lines
Indicator
Breakout
VegaXLR - Fixed Range Volume Profile
Identify key support and resistance levels through detailed volume distribution analysis.
Laguerre RSI
Laguerre RSI is based on John EHLERS' Laguerre Filter to avoid the noise of RSI.
Premium Discount Zones
Premium Discount Zones" spots key areas (🟣Premium/🟢Discount) using recent highs/lows & volume..............