Indicator
RSI
XAUUSD
ATR
Forex
Crypto
Scalping
RSI NextGen
"RSI NextGen" logo
23/09/2025
13
Desktop
Since 13/09/2025
Free installs
91
"RSI NextGen" uploaded image"RSI NextGen" uploaded image"RSI NextGen" uploaded image"RSI NextGen" uploaded image"RSI NextGen" uploaded image

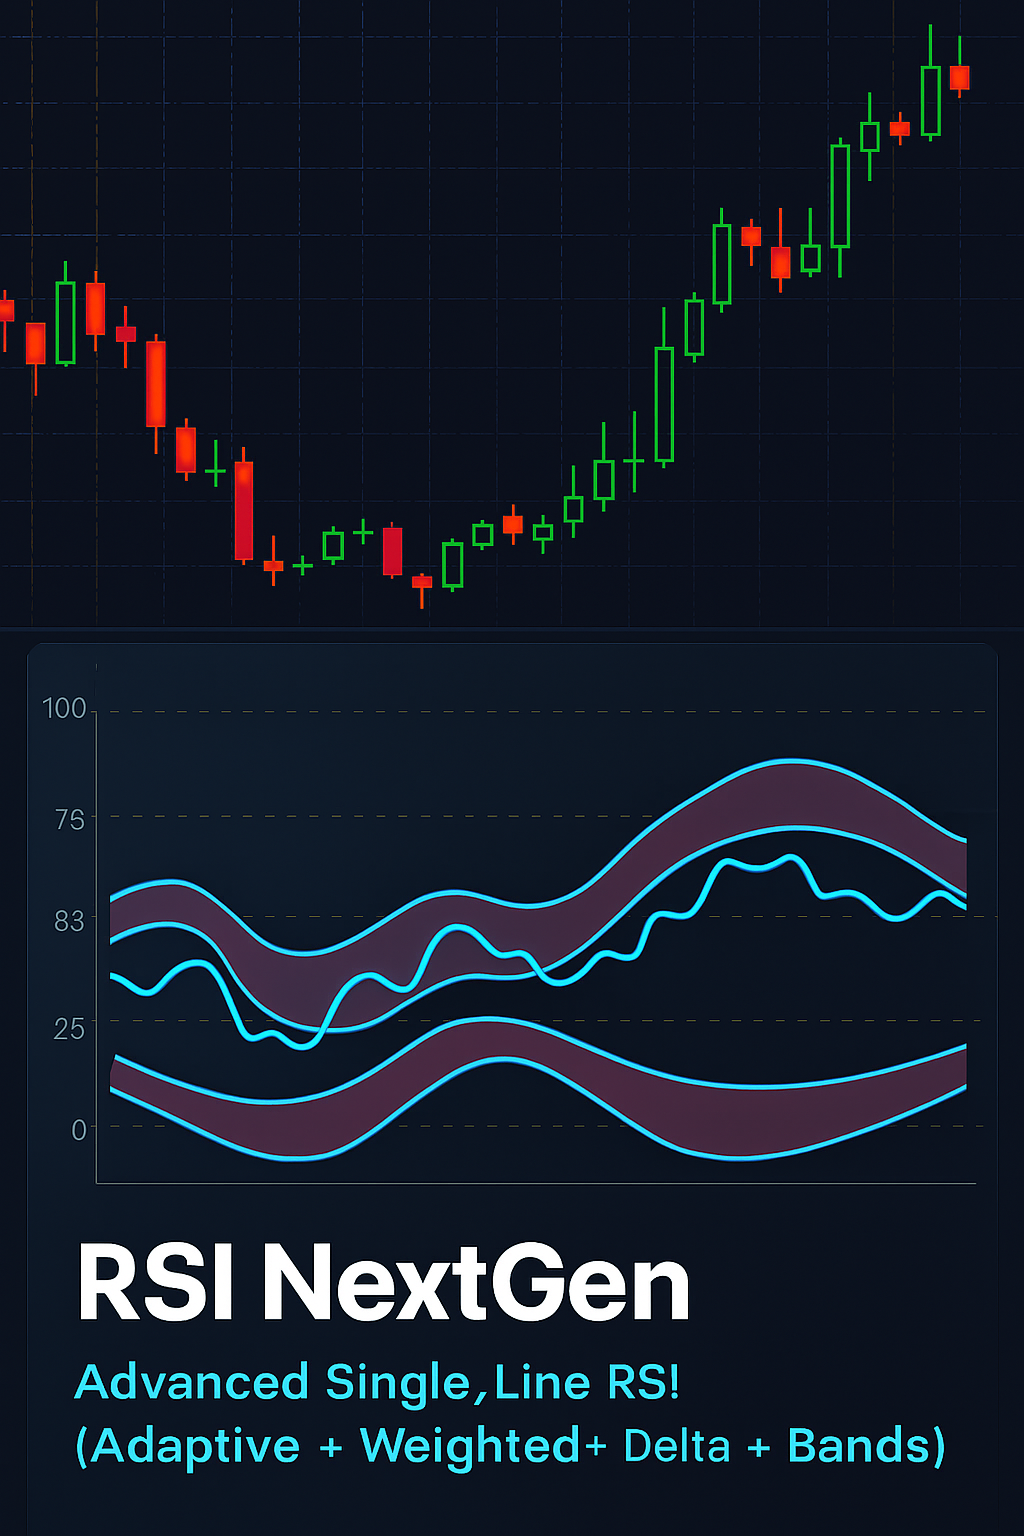
RSI NextGen Advanced


The RSI NextGen is an advanced and modernized version of the classic Relative Strength Index (RSI). It introduces additional features designed to provide more flexible and adaptive momentum readings across different market conditions. Unlike the traditional RSI, which uses a fixed period, RSI NextGen adjusts dynamically based on market activity.


How the Indicator Works


RSI NextGen calculates its values using several adaptive factors:


Volatility (ATR-based) – The calculation period adjusts according to market volatility. High volatility expands the period to reduce false signals, while low volatility shortens it to detect smaller movements.


Trading Volume – Price moves supported by higher trading volume are weighted more heavily, while low-volume moves have less impact.


Price Speed (Momentum / Acceleration) – Fast price changes influence the calculation, allowing the indicator to better reflect rapid market moves.


Delta Filtering – Compares raw RSI with a smoothed version to reduce noise.


Dynamic Bands – Upper and lower levels adapt according to market activity, rather than relying on fixed overbought/oversold levels.


How to Read the Indicator


The indicator appears in a separate window below the main chart as a single line ranging between 0 and 100:


Reference levels at 25, 50, and 75 help assess momentum.


Near 70–75 → market may be considered extended on the upside.


Near 30–25 → market may be considered extended on the downside.


50 acts as a balance point:


Above 50 → buyers tend to dominate.


Below 50 → sellers tend to dominate.


Key Features


Automatically adapts to changing market conditions.


Combines volatility, volume, and speed for adaptive momentum readings.


Clean and simple interface with a single, easy-to-read line.


Highlights potential momentum shifts and extended market conditions.


Suitable for multiple timeframes and trading styles.


Final Notes


RSI NextGen is a next-generation interpretation of the classic RSI, providing traders with a more adaptive perspective on momentum and potential turning points. It is intended as an analytical tool and works best in combination with other forms of market analysis and risk management.

More from this author
Indicator
Grid
XAUUSD
Forex
+3
Daily Open Color Zones
indicator showing the Daily Open Line and instantly shading bullish and bearish zones.
cBot
XAUUSD
Breakout
Commodities
+3
Gold Pulse Pro
Gold Pulse Pro – An automated trading system for gold (XAUUSD) precisely engineered and powered by advanced algorithms
Indicator
XAUUSD
Breakout
Forex
+4
Market Bias Gauge
Measure Market Strength at a Glance – Instantly
Indicator
Grid
XAUUSD
ATR
+5
Trend Scope pro
Trend Scope Pro – Smarter Trend Analysis with Linear Regression Channels
Indicator
Grid
Martingale
Signal
+2
Trend Pulse X
is a trend-following indicator designed to provide a clear view of market direction, momentum, and strength
Indicator
XAUUSD
Commodities
Forex
+5
BullBear Dynamics
BullBear Dynamics helps traders detect and interpret the balance between bullish and bearish momentum
Indicator
Grid
RSI
ATR
+6
PFO Price Flow Oscillator
technical analysis tool designed to provide traders with a structured view of market momentum and volatility
You may also like
MA Sabres
Conquer the markets with MA Sabres! This indicator spots trend flips with MAs and cool Sabre shapes & alerts.
Indicator
Indices
Stocks
Forex
+1
Bullet Chart Trend
Unique Pyramid Design , Clear Price Action Trend
Time Marker
CaptraTimeMarker: Marks key trading hours with lines & labels, plus daily separators for cTrader. Customizable & precise
EURUSD Breakout Indicator
Breakout Multi-Timeframe Strategy Indicator
Indicator
Bollinger
Repiptor BB Colored Width
Colored Bollinger Bands Width
Indicator
NAS100
NZDUSD
XAUUSD
+12
RT Bollinger Bands Cloud
Visualize Bollinger Bands with a colored cloud for clarity. Enhance your trading precision with this dynamic indicator!
Repiptor Candlescope Lite
Candlestick pattern detector lite version
KAMA
Custom KAMA Indicator – Optimized for Speed and Precision
Indicator
Breakout
Pivot Points Daily Session
Pivot Point with base zone daily Asia-London-New york Session.
Indicator
Indices
Prop
Commodities
+4
Pivot Point Smart Money Concept
Transform your approach to trading with our innovative Pivot Point Indicator.
Indicator
Breakout
Signal
AI
Verve Ai Range Scalper
ICT Channel – Precision buy/sell signals , customizable settings , User-Friendly Interface
[Stellar Strategies] BOS Trend 1.0
[Stellar Strategies] BOS Trend: Premium multi-timeframe BOS indicator for precision trend analysis.📈📉
CRT Pattern Indicator
The CRT indicator helps ICT traders identify candlestick patterns, enhancing analysis of higher timeframe on lower
Indicator
Indices
XAUUSD
Forex
+3
Three Candle Patterns
Spot powerful 3-candle reversal patterns like Morning/Evening Star and Soldiers/Crows at key swing highs and lows
FX Market Sessions
Easily visualise Forex sessions with start/end markers and high/low levels for Sydney, Tokyo, London, and New York.
Indicator
Indices
Stocks
Forex
+1
VegaXLR - Moving Average Alerts
A powerful cTrader indicator with customizable Moving Average alerts, notifications, and automated trading actions.
Indicator
NAS100
NZDUSD
XAUUSD
+13
Market Swing Structure Pullback Pro
Auto-detect support and resistance & structure, highlight pullbacks/BOS retests, and filter with candle confirmation.