Indicator
Indices
Prop
Breakout
Commodities
Stocks
Forex
Crypto
Pivot Points Daily Session
"Pivot Points Daily Session" logo
5.0
22/10/2025
28
Desktop
"Pivot Points Daily Session" uploaded image"Pivot Points Daily Session" uploaded image"Pivot Points Daily Session" uploaded image"Pivot Points Daily Session" uploaded image"Pivot Points Daily Session" uploaded image

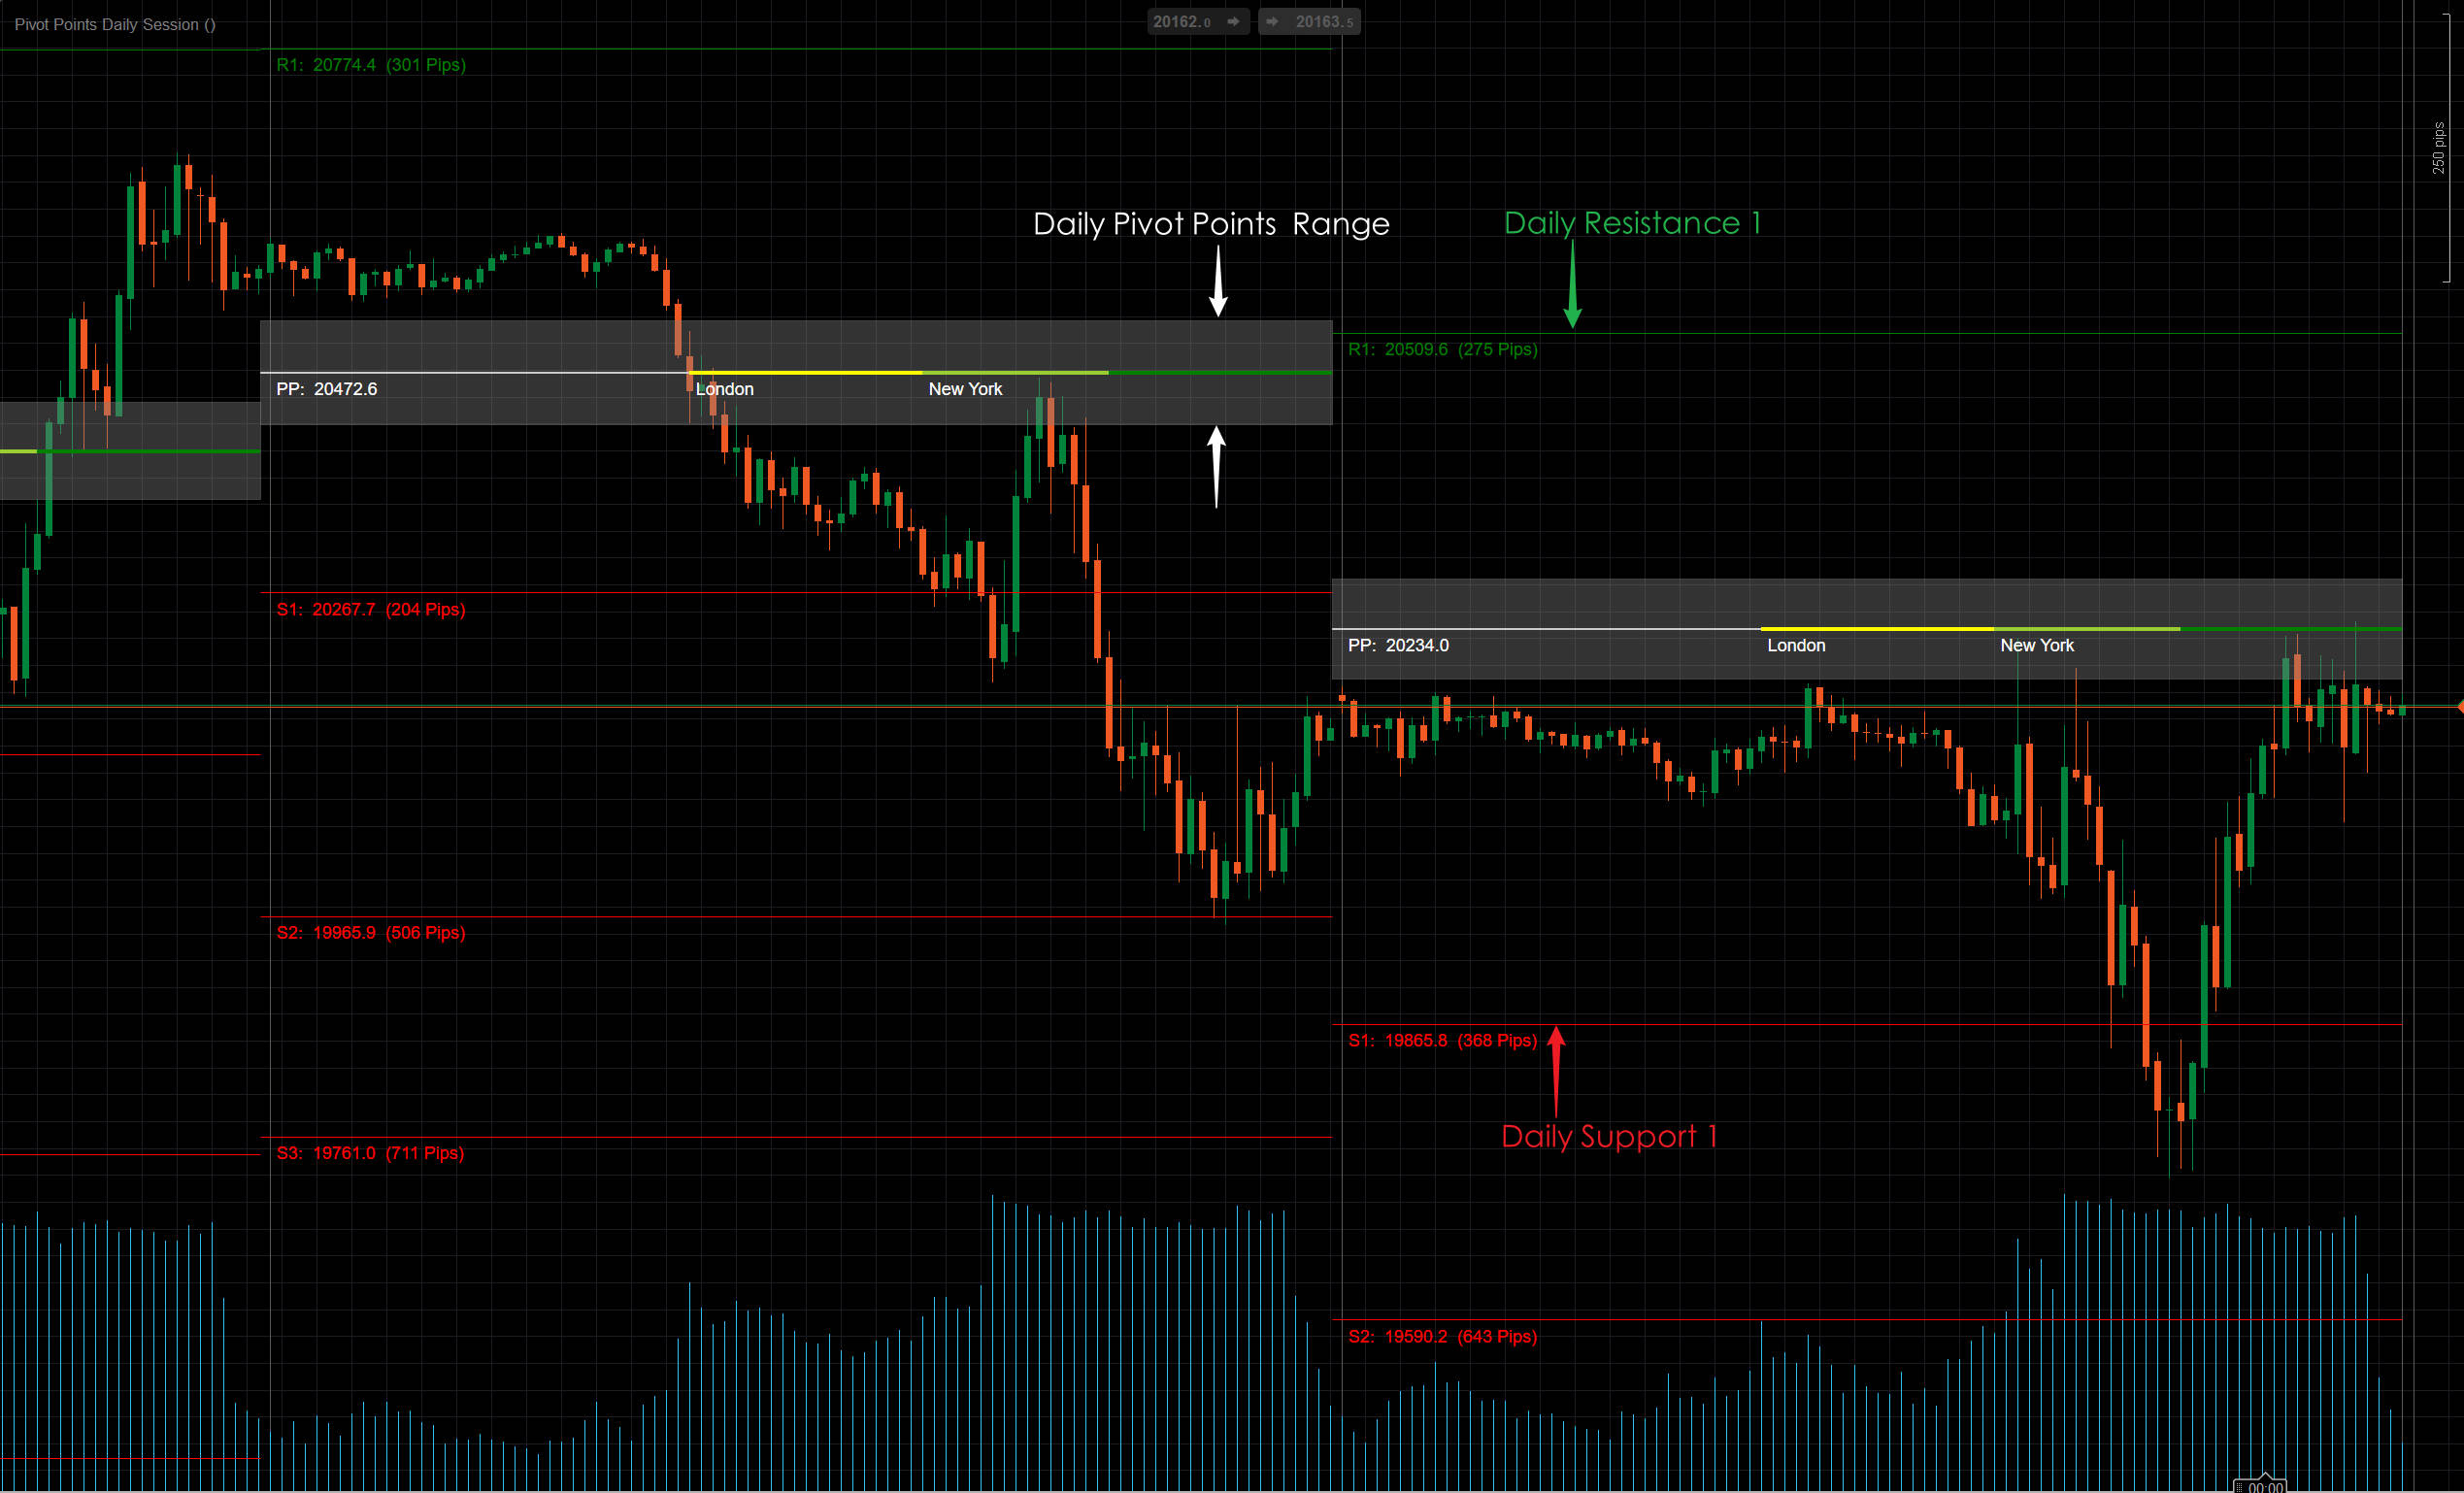
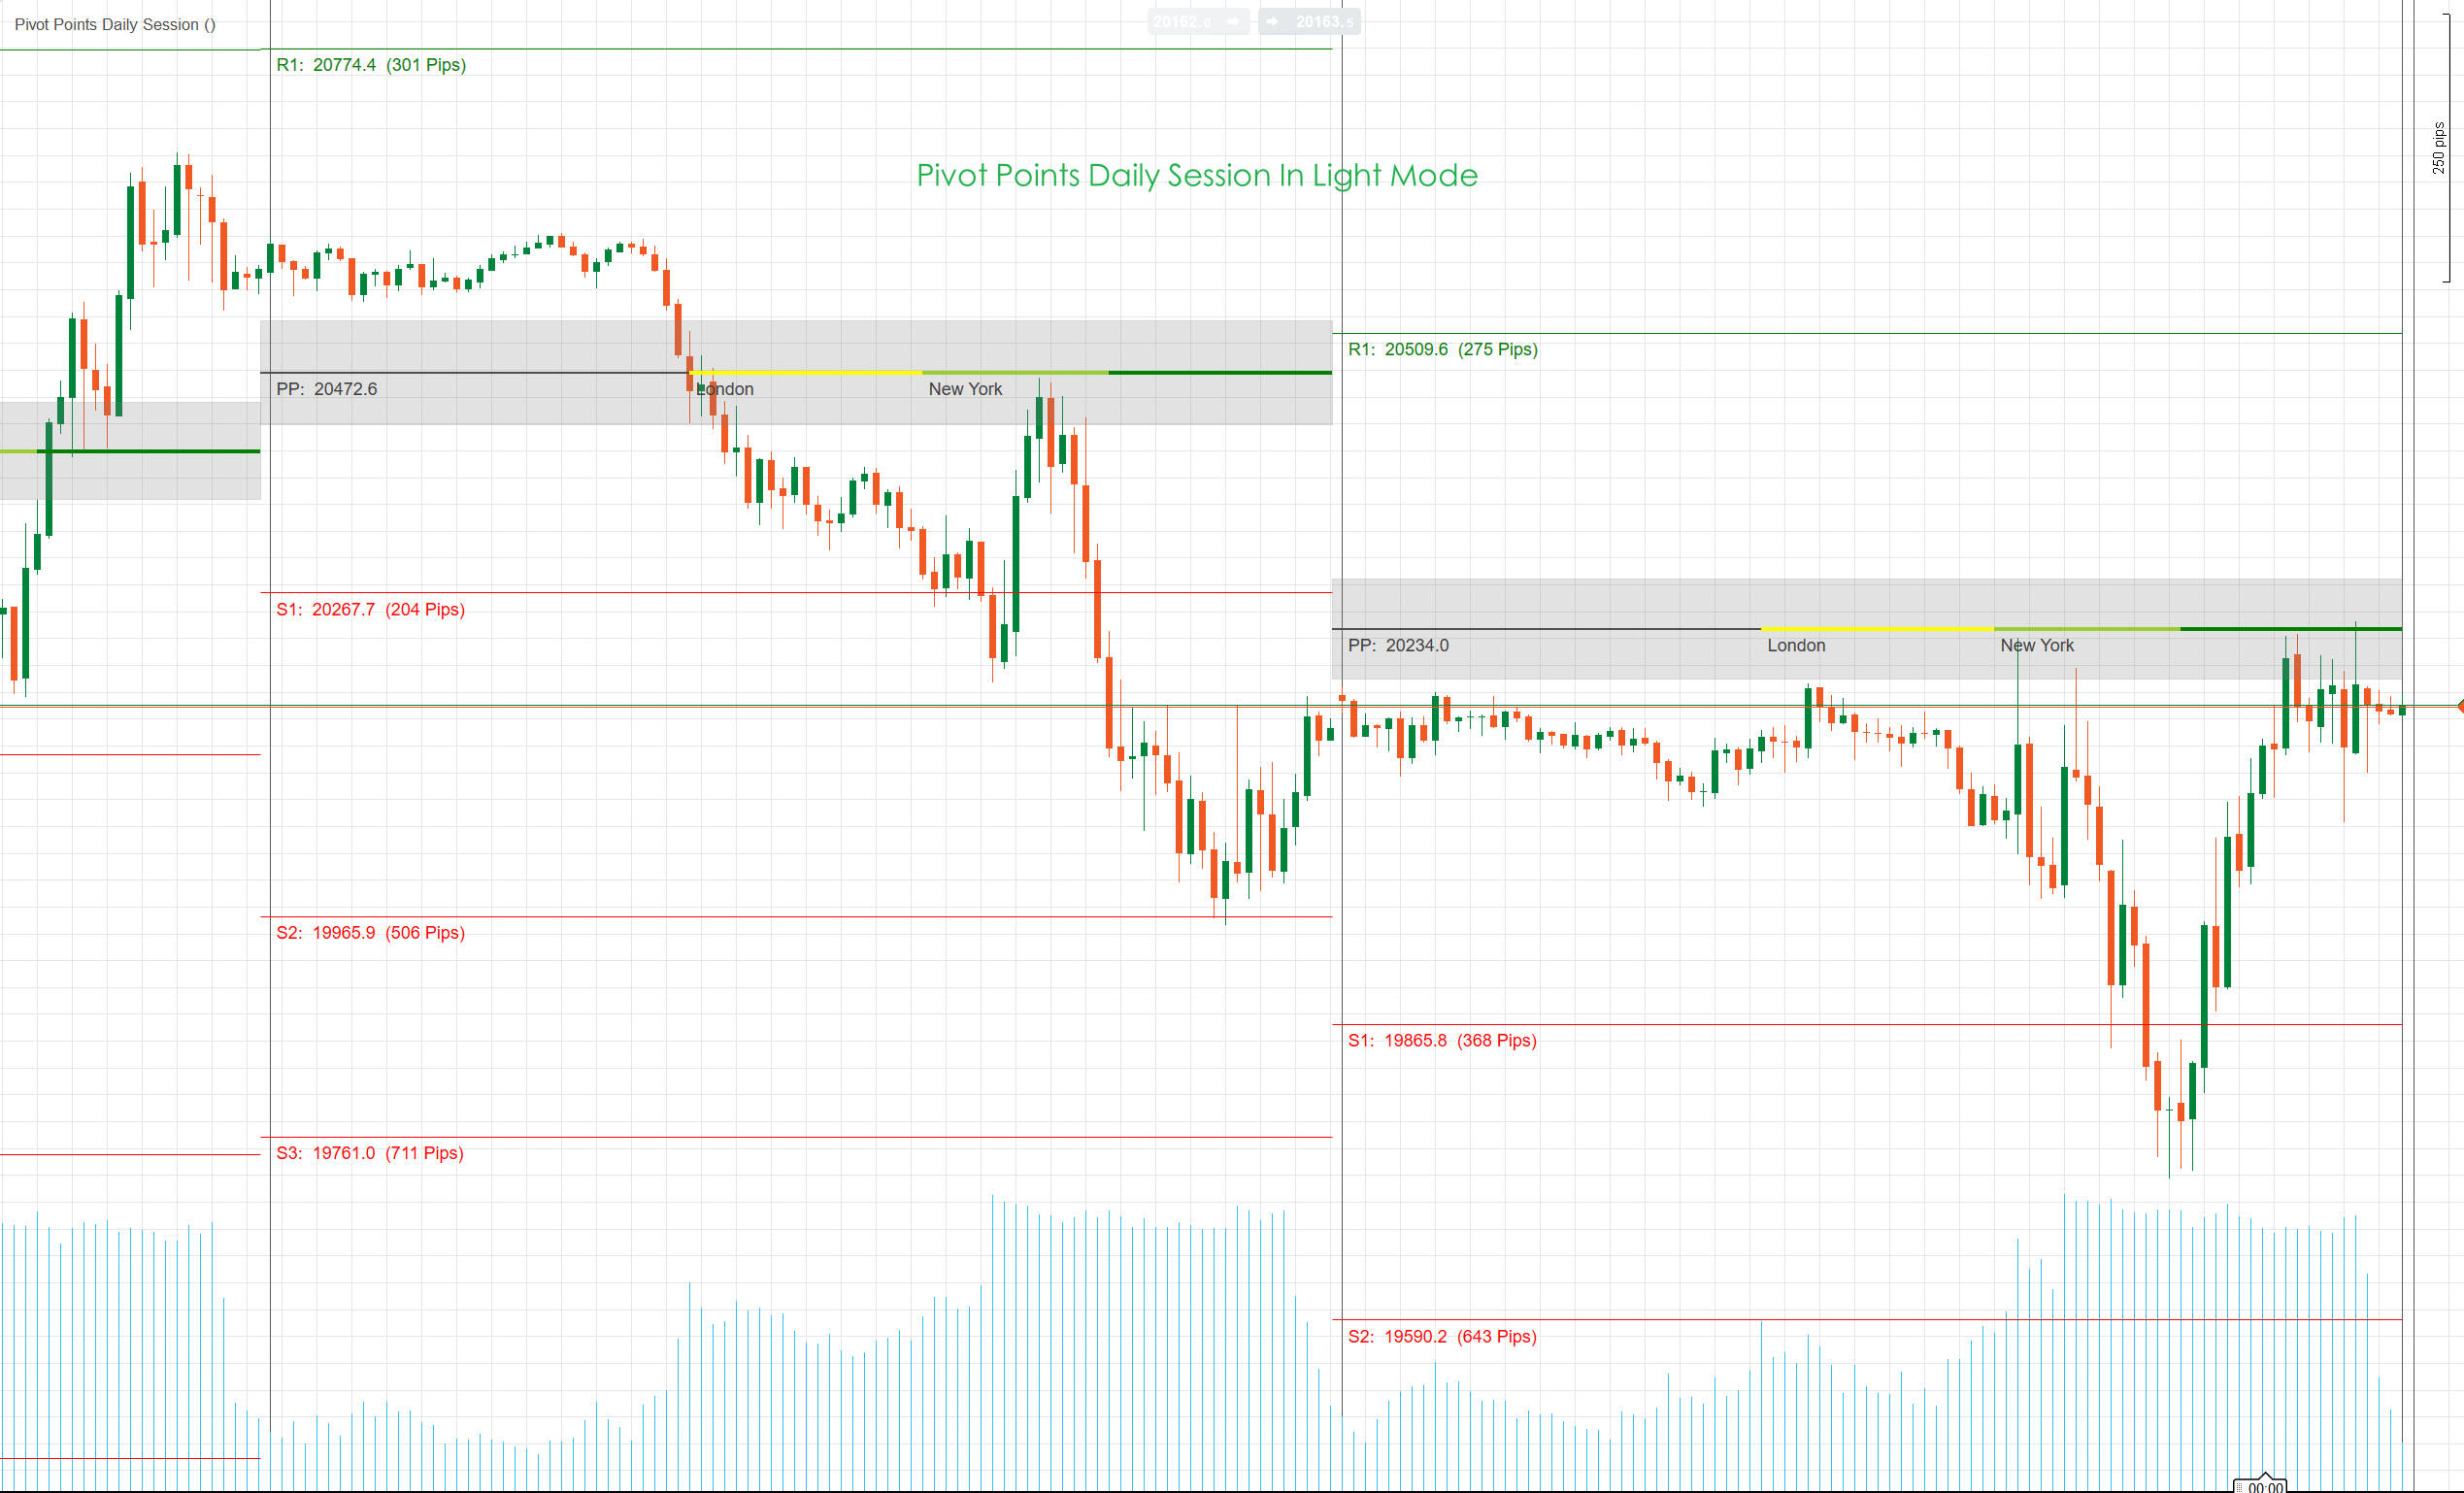
Here is the formula for calculating standard Pivot Points:

PP = (High + Low + Close)/3

S1 = (PP * 2) – High

S2 = PP – (High – Low)

S3 = Low – 2(High – PP)

R1 = (PP * 2) – Low

R2 = PP + (High – Low)

R3 = High + 2(PP – Low)

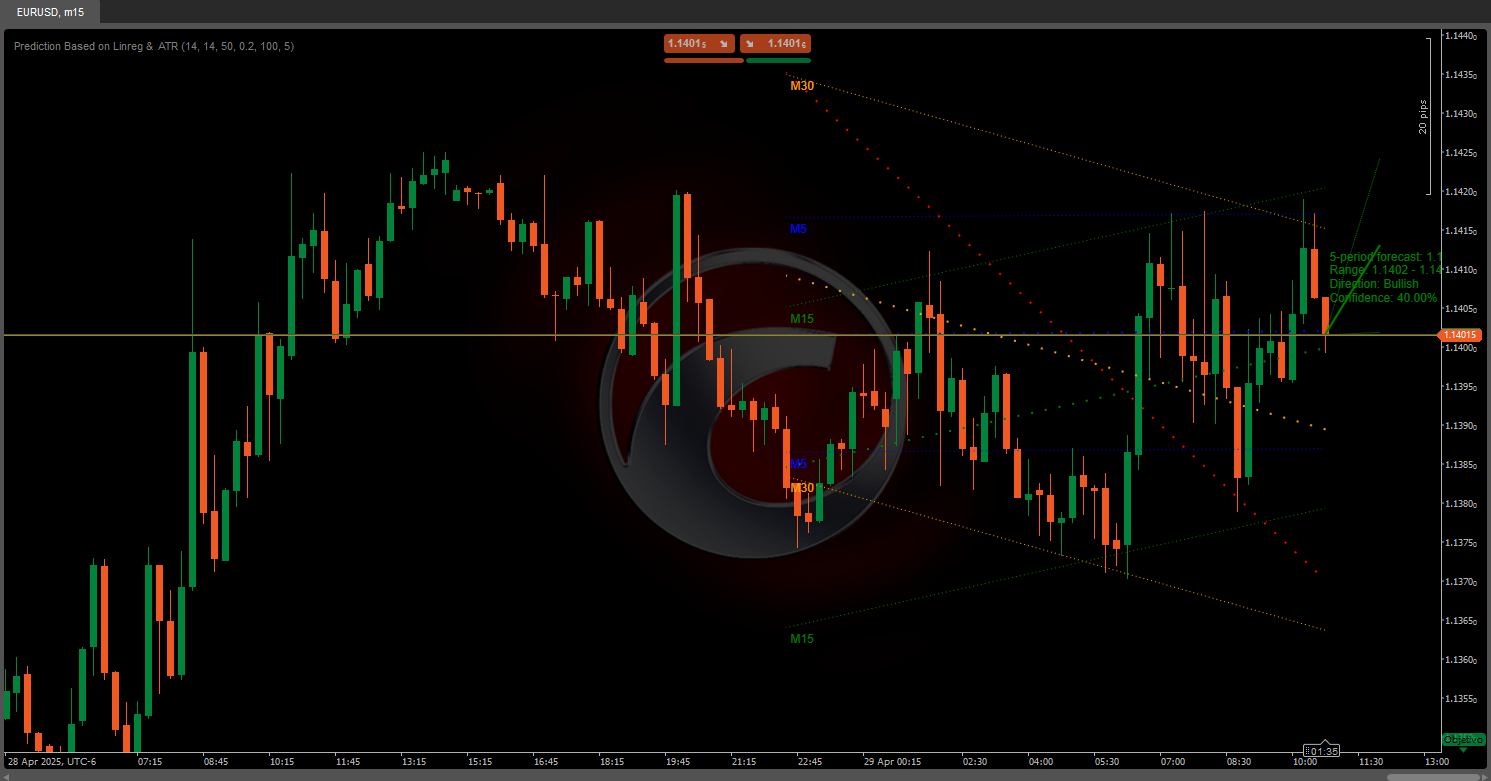
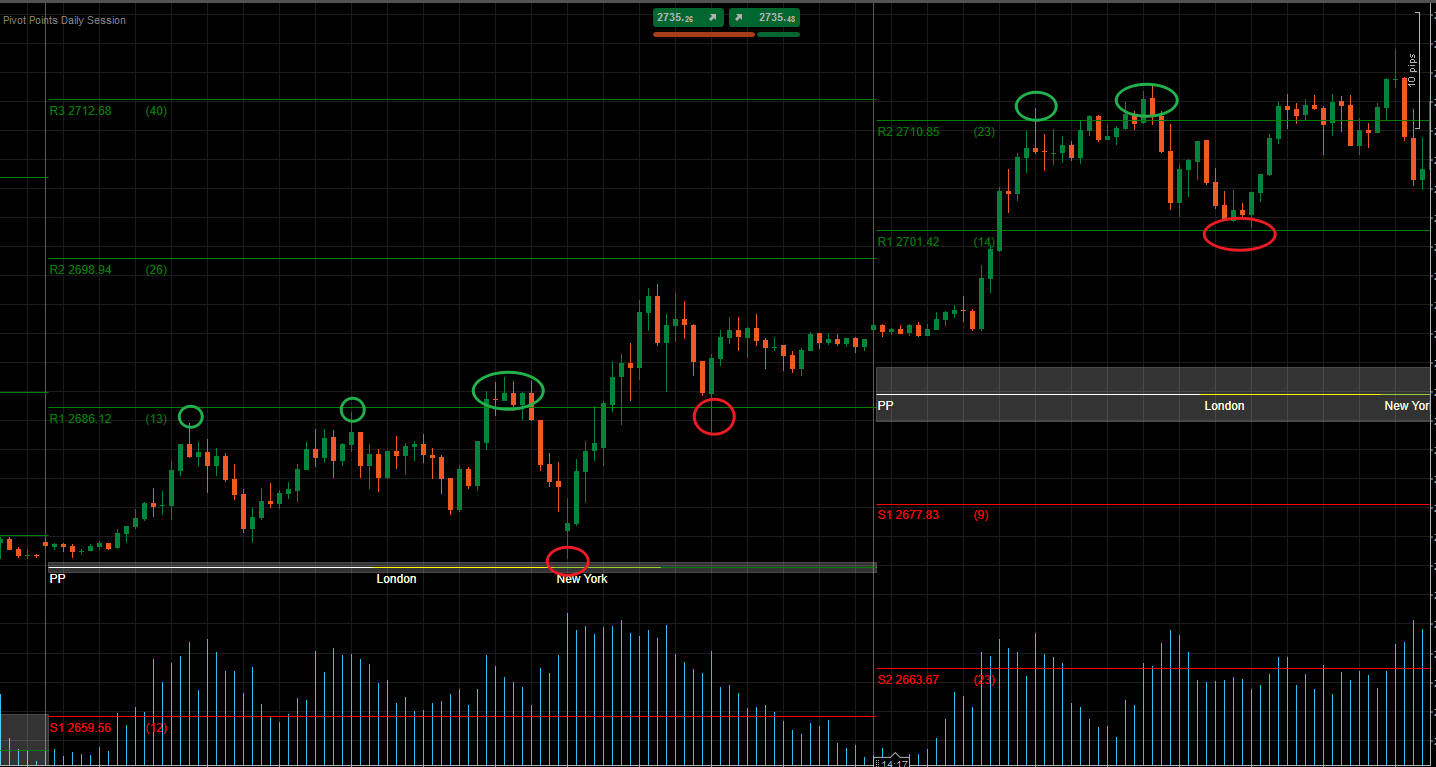
Pivot points can be used to identify the overall trend, since a move through pivot points to the upside indicates an uptrend. Meanwhile the opposite, where a price continues to fall below pivot points during a session, is indicative of a downtrend.

In a ranging market, traders can simply sell (go short) at resistance and buy (go long) at support. For instance, if the market is contained between R1 and S1, buy orders will be placed around S1, with sell orders placed around R1.

In a trending market, relevant Pivot Points will act as reference points for retracing markets to resume the main trend. For instance, if the prices are above PP during an uptrend but below R2. Traders can look to place lucrative buy orders around R1.  

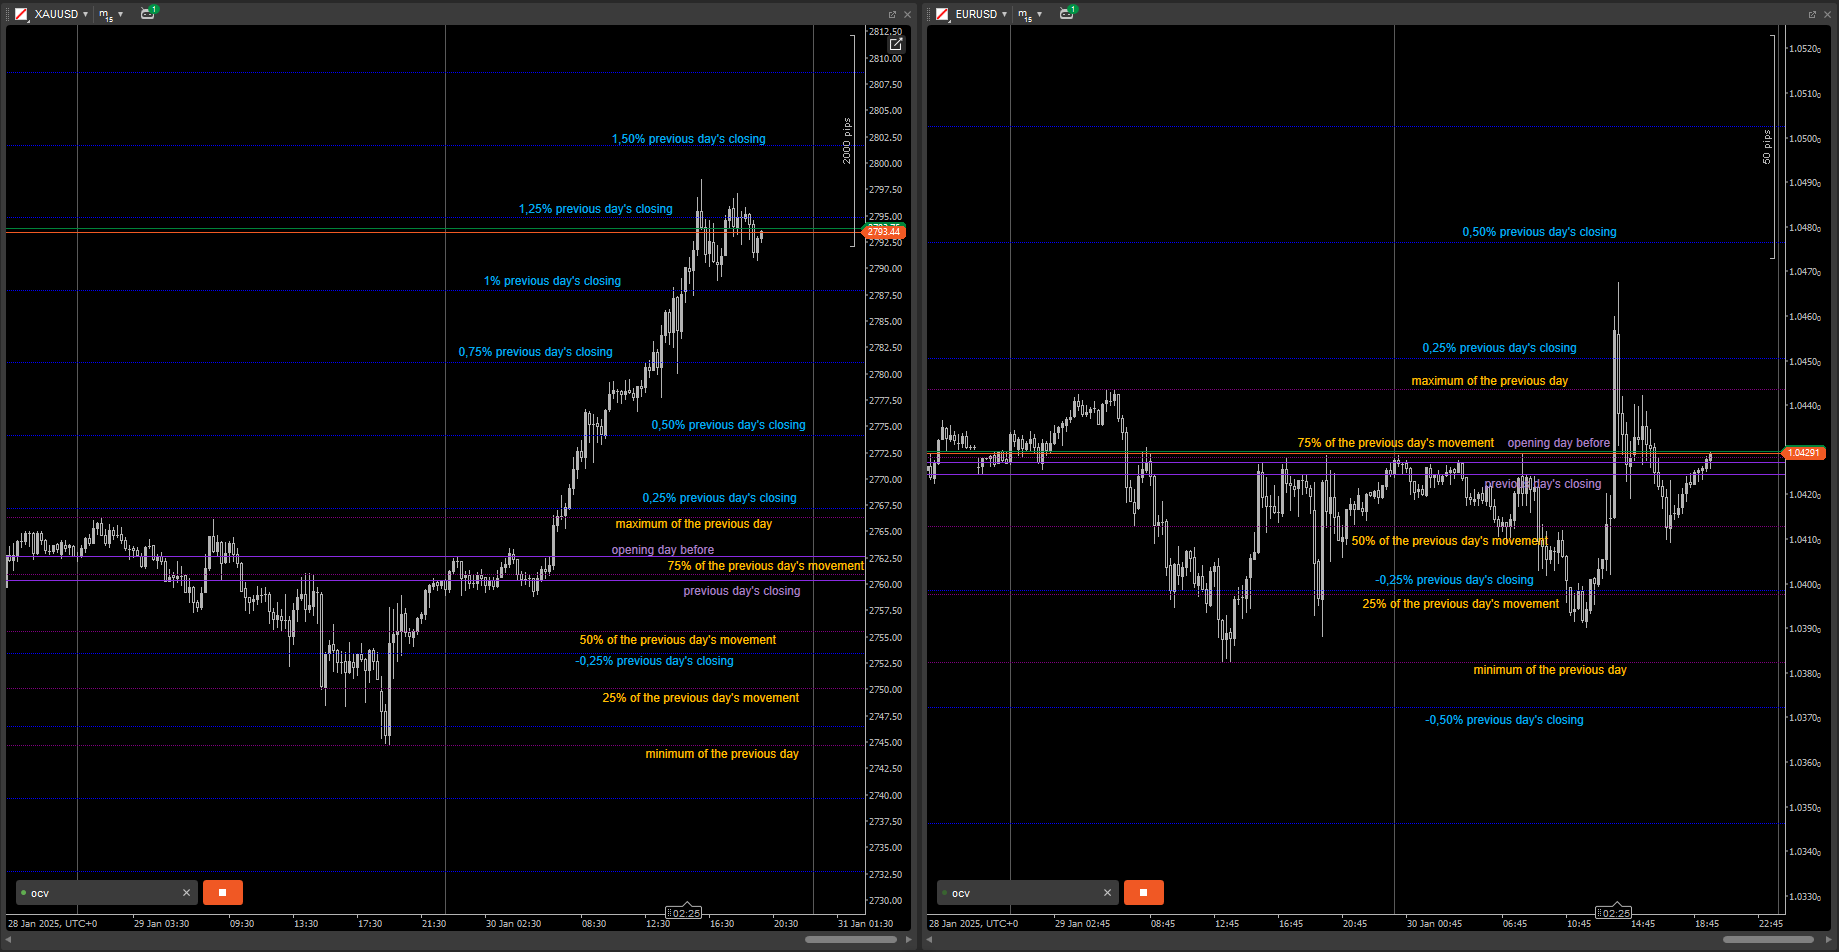
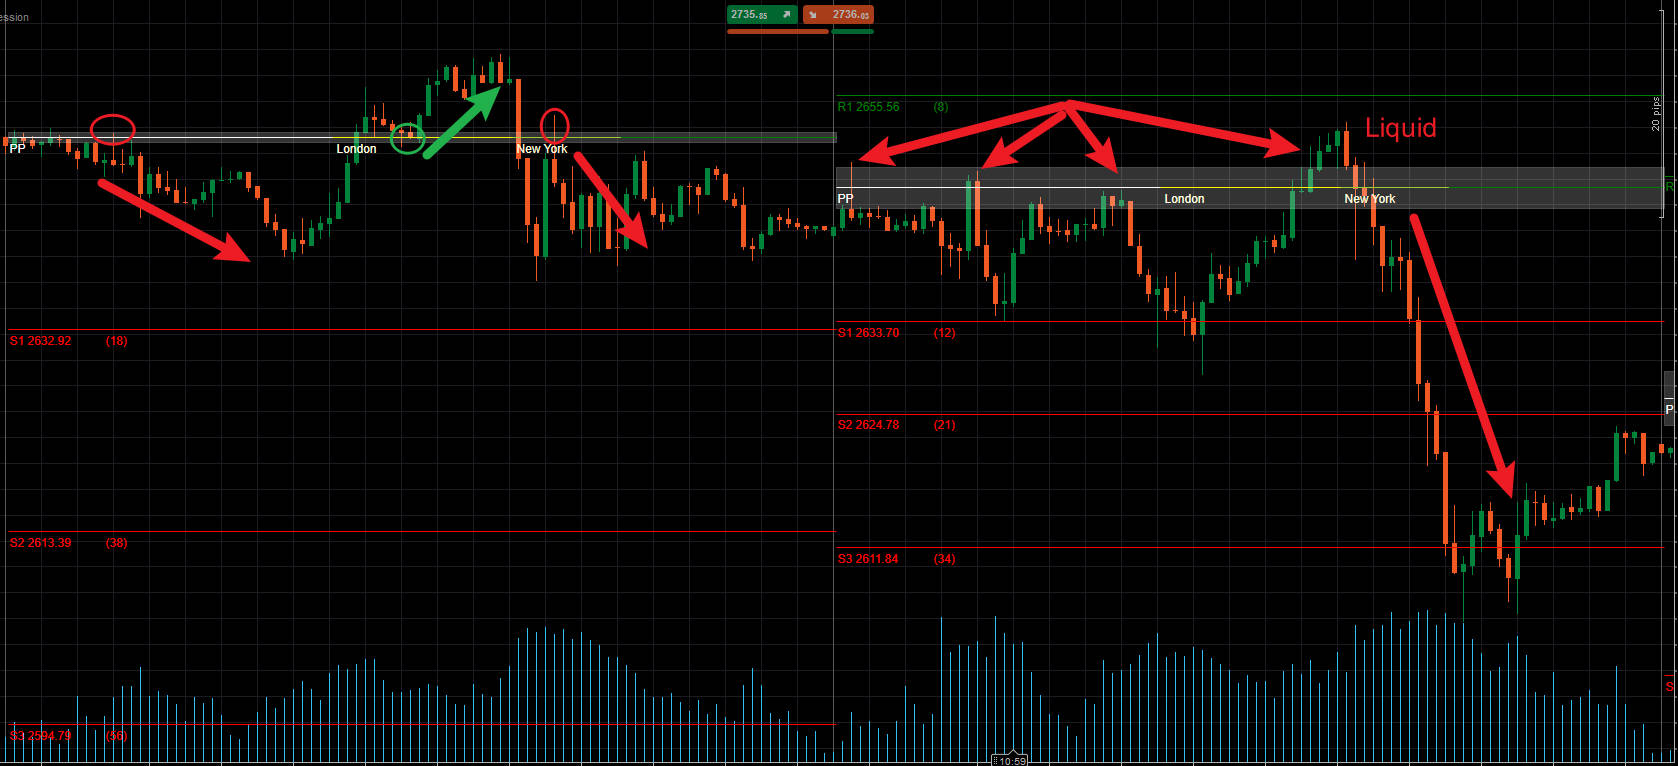
Support and resistance levels are bound to be broken in some in the market. These breakout periods can offer many trading opportunities in the market. Pivot points can also be used to trade potential price breakouts in the market.

Price breakouts occur when the price surges through an existing support or resistance level and effectively switches its role. For instance, if a downward breakout occurs at S2, the pivot line will cease to be a support line and will now be considered a line of resistance.

In this scenario, only sell orders will be considered below S2, and other pivot lines can guide stop loss and take profit placement. Stop losses for sell orders can be placed above S2 and S1, with profit targets placed at S3 and below.

中文说明:

枢轴点可用于识别整体趋势,因为价格向上突破枢轴点表明上升趋势。与此同时,相反的情况,即价格在交易时段内持续跌破枢轴点,则表明下降趋势。

在区间震荡市场中,交易者可以简单地在阻力位做空(卖出)和在支撑位做多(买入)。例如,如果市场在R1和S1之间波动,买单将放置在S1附近,卖单放置在R1附近。

在趋势市场中,相关的枢轴点将作为回调市场恢复主要趋势的参考点。例如,如果在上升趋势中价格高于PP但低于R2,交易者可以考虑在R1附近设置有利可图的买单。

支撑位和阻力位在某些市场情况下必然会被突破。这些突破期可以在市场中提供许多交易机会。枢轴点也可用于交易市场中潜在的价格突破。

价格突破发生在价格冲破现有的支撑位或阻力位并有效转换其角色时。例如,如果在S2处发生向下突破,该枢轴线将不再是支撑线,而将被视为阻力线。

在这种情况下,只有在S2下方才会考虑卖单,其他枢轴线可以指导止损和止盈的设置。卖单的止损可以设在S2和S1上方,盈利目标设在S3及以下。

5.0
Reviews: 1
5
100 %
4
0 %
3
0 %
2
0 %
1
0 %
Customer reviews
August 18, 2025
Automatically calculates daily pivot, support, and resistance levels from previous day's high/low/close. Light and clean on charts. Cons: No alerts or tooltips. Doesn’t support saving presets. Lacks interactive descriptions.
More from this author
Indicator
VWAP
Indices
Prop
+4
Volume Weighted Average Price
VWAP is a powerful tool for intraday traders
Indicator
Indices
Prop
Stocks
+3
IRiskRewardTools
Risk Reward Management Tools(风险回报管理工具)
Indicator
RSI
Indices
Prop
+6
ZigZagColor
The ZigZag indicator is a technical analysis tool primarily used to identify key price reversal points.
Indicator
Indices
Breakout
Prop
+4
Higher TimeFrame Candle Tracker
Higher TimeFrame Candle Tracker: Current Timeframe (Any TimeFrame) Show High TimeFrame Candle Bar
Indicator
Indices
RSI
Prop
+4
SuperEmaColorRSI
This is a super indicator that integrates the RSI indicator with a dual moving average system.
Indicator
Indices
Breakout
Commodities
+3
Daily Levels
The "Daily Levels" indicator is used to display last week's and yestoday high/low price
You may also like
Indicator
Breakout
AI
Scalping
KaufmanEfficiencyRatio
A precision tool for measuring how efficiently price moves from point A to B.
Indicator
Indices
XAUUSD
Commodities
+8
ATR on Chart
Plots the ATR on the chart for easy visualization.
Indicator
Indices
RSI
XAUUSD
+7
RSI Divergence
Detects bullish and bearish divergences
Indicator
Breakout
ORB v1
Opening Range Breakout (ORB) - Visual Edition
Indicator
Indices
RSI
Bollinger
Clustering
Clustering tool for traders with visual insights into market patterns.
Indicator
NAS100
RSI
NZDUSD
+16
AlphaTrend Pro Max
Turn data into precision trades with AlphaTrend Pro Max — advanced trend, signal & structure analysis in one.
MultiTimeFrameTrend
A compact, visual multi-timeframe trend indicator for cTrader. Easily spot bullish or bearish trends across 4 customizab
Indicator
Grid
RSI
XAUUSD
+12
PFO Price Flow Oscillator
technical analysis tool designed to provide traders with a structured view of market momentum and volatility
Indicator
RSI
Breakout
XAUUSD
+5
Prediction Based on Linreg & ATR
📊Predicts price movement by combining multi-timeframe trend analysis, market volatility 📉, and..
Indicator
Grid
NAS100
NZDUSD
+18
Supertrend Indicator v1.1
SUPERTREND INDICATOR v1.1
Indicator
NAS100
NZDUSD
Breakout
+14
Matrix Pro by PrimeQuant
Multi-timeframe S/R, SRWMA trend & Demarker pivots with smart alerts—clarity for any market, any timeframe.
Indicator
XAUUSD
Commodities
FVG_tidypips
A Fair Value Gap (FVG) indicator that identifies potential price imbalances, potential reversal and continuation zones
pATR
An indicator that redefines ATR by applying a percentile-based filter giving traders a grounded view of volatility.
Pips V4Final
Displays pips from daily open with high/low. Clean, customizable, perfect for quick daily price context.
vpdi
VPDI (open, close, high and low with % of the previous day and price changes in % of the previous day's close)
Pivot Points Clasic,FIBO,etc
All-in-one Pivot Indicator: set Classic, Fibo, Woodie, Camarilla, Demark methods, style levels & labels your way ;)
Indicator
Indices
RSI
Signal
Rsi + Volume
This indicator combines RSI (Relative Strength Index) with volume analysis to generate more reliable trading signals.
VegaXLR - Chart Patterns Alerts
Enhance your trading strategy with automated detection and alerts for key chart patterns.