Pivot Points Clasic,FIBO,etc
28/07/2025
140
Desktop
Pivot Points Customizable — The Ultimate All-in-One Pivot Indicator for cTrader
Unlock the power of professional price action analysis with one versatile tool!
Pivot Points Customizable is an advanced, highly flexible indicator for cTrader that puts all major pivot calculation methods at your fingertips — giving you clear support/resistance levels, custom styling, and smart chart labeling.
Key Features:
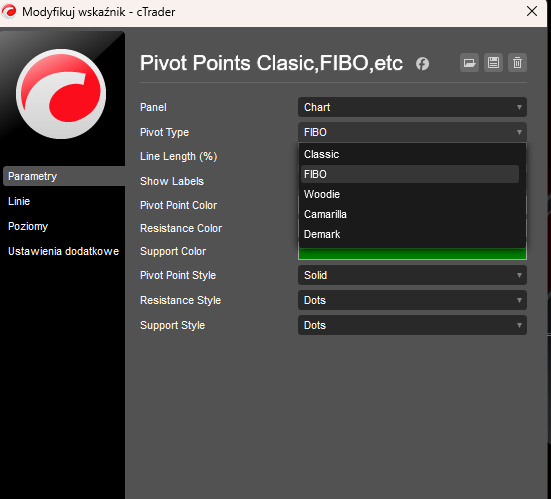
- 5 Pivot Methods in One:
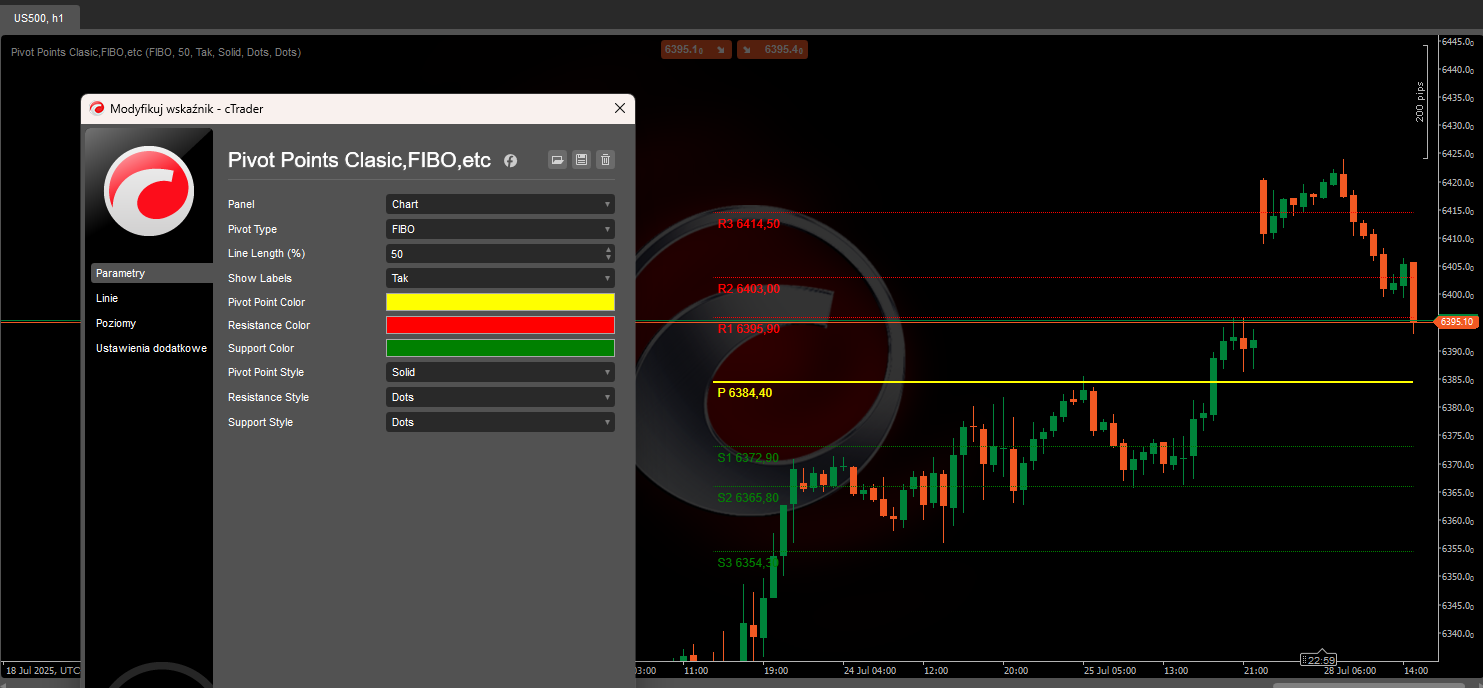
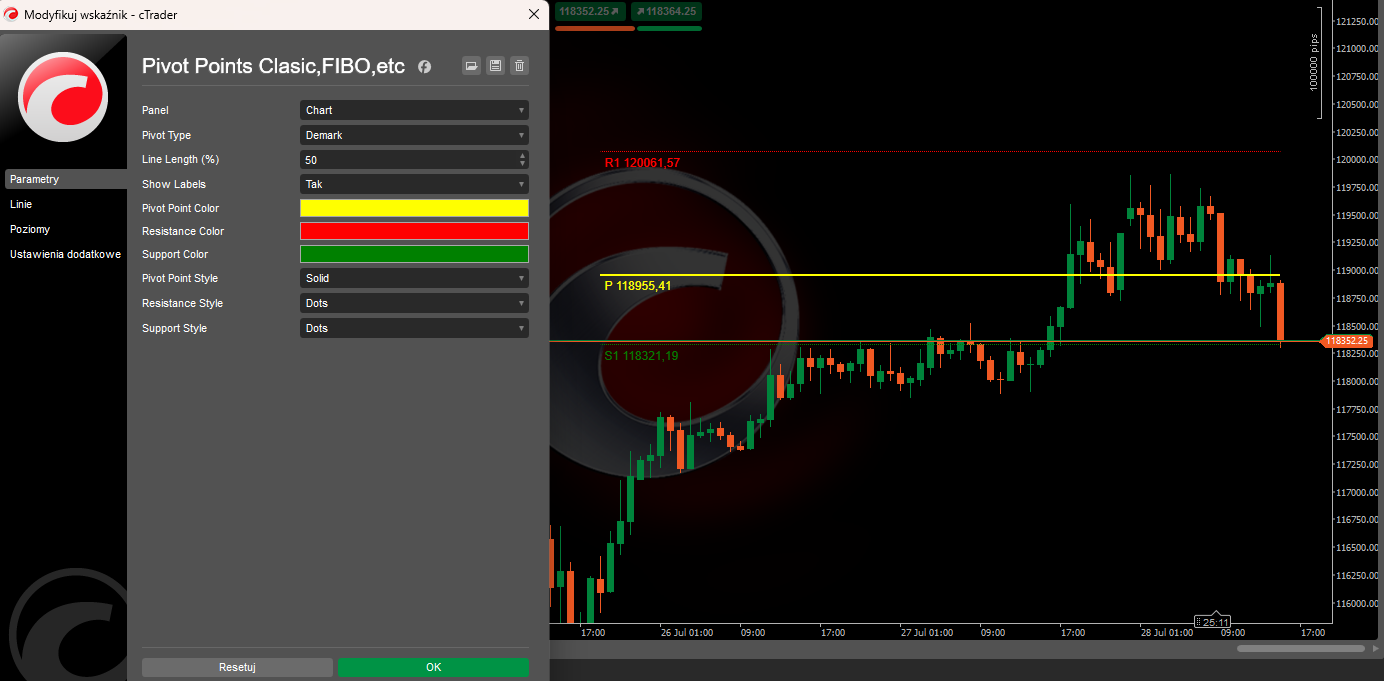
Instantly switch between Classic, Fibonacci, Woodie, Camarilla, and Demark formulas. Perfect for all trading styles: scalping, day trading, and swing trading. - Complete Customization:
- Choose your pivot calculation method.
- Set custom colors and line styles for pivot, resistance, and support levels.
- Adjust the visible line length as a percentage of your chart for clean, clutter-free visuals.
- Toggle on/off smart labels that show real-time price levels for every pivot.
- Professional Chart Overlay:
Draws pivots and S/R levels directly on your price chart, auto-updating as new bars appear.
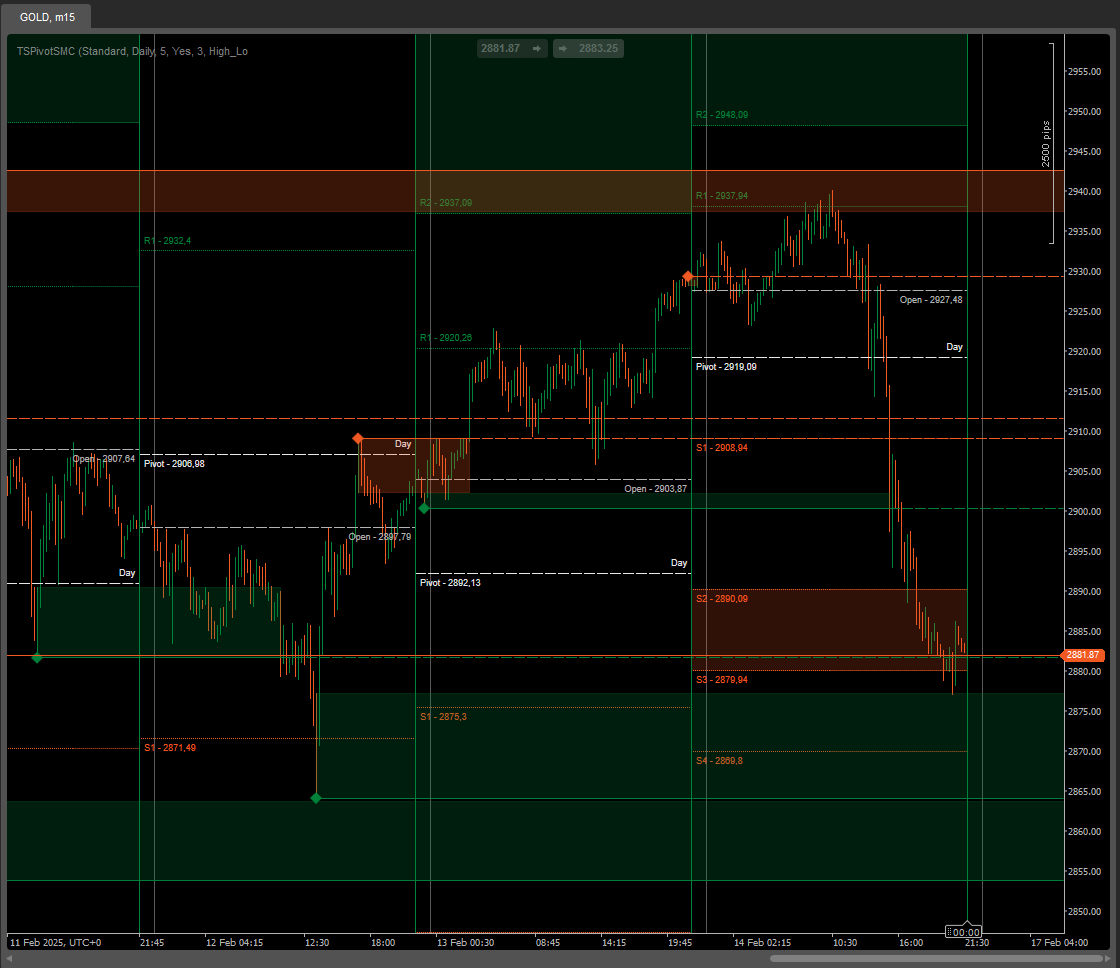
Levels supported for each method: - Classic, Fibo, Woodie: Up to 3–4 resistances (R1–R4) and supports (S1–S4)
- Camarilla: Up to 4 resistances and supports
- Demark: Custom unique levels (R1, S1, and Pivot only)
- Lightning Fast & Lightweight:
Optimized for real-time performance — no lags, no external libraries, 100% native cTrader code. - Ideal for All Markets:
Works perfectly with Forex, indices, commodities, crypto, and more!
Why choose Pivot Points Customizable?
- Multiple strategies, one tool: Switch pivots with a click — test which suits your market!
- Spot key levels at a glance:
Immediate access to zones where price reversals or breakouts are most likely. - Ultimate chart clarity:
Lines auto-fit your chart window — no more cluttered or overlapping indicators. - Boost your trading confidence:
Know where institutions and pros watch price every session.
Make better trading decisions today. Try Pivot Points Customizable — and see the difference in your technical analysis!
You may also like
Indicator
Signal
MeetAlgo_ChannelTrading_cTrader
Channel Trading is a volatility-based indicator using envelope theory to spot price breakouts and trade signals.

Indicator
RSI
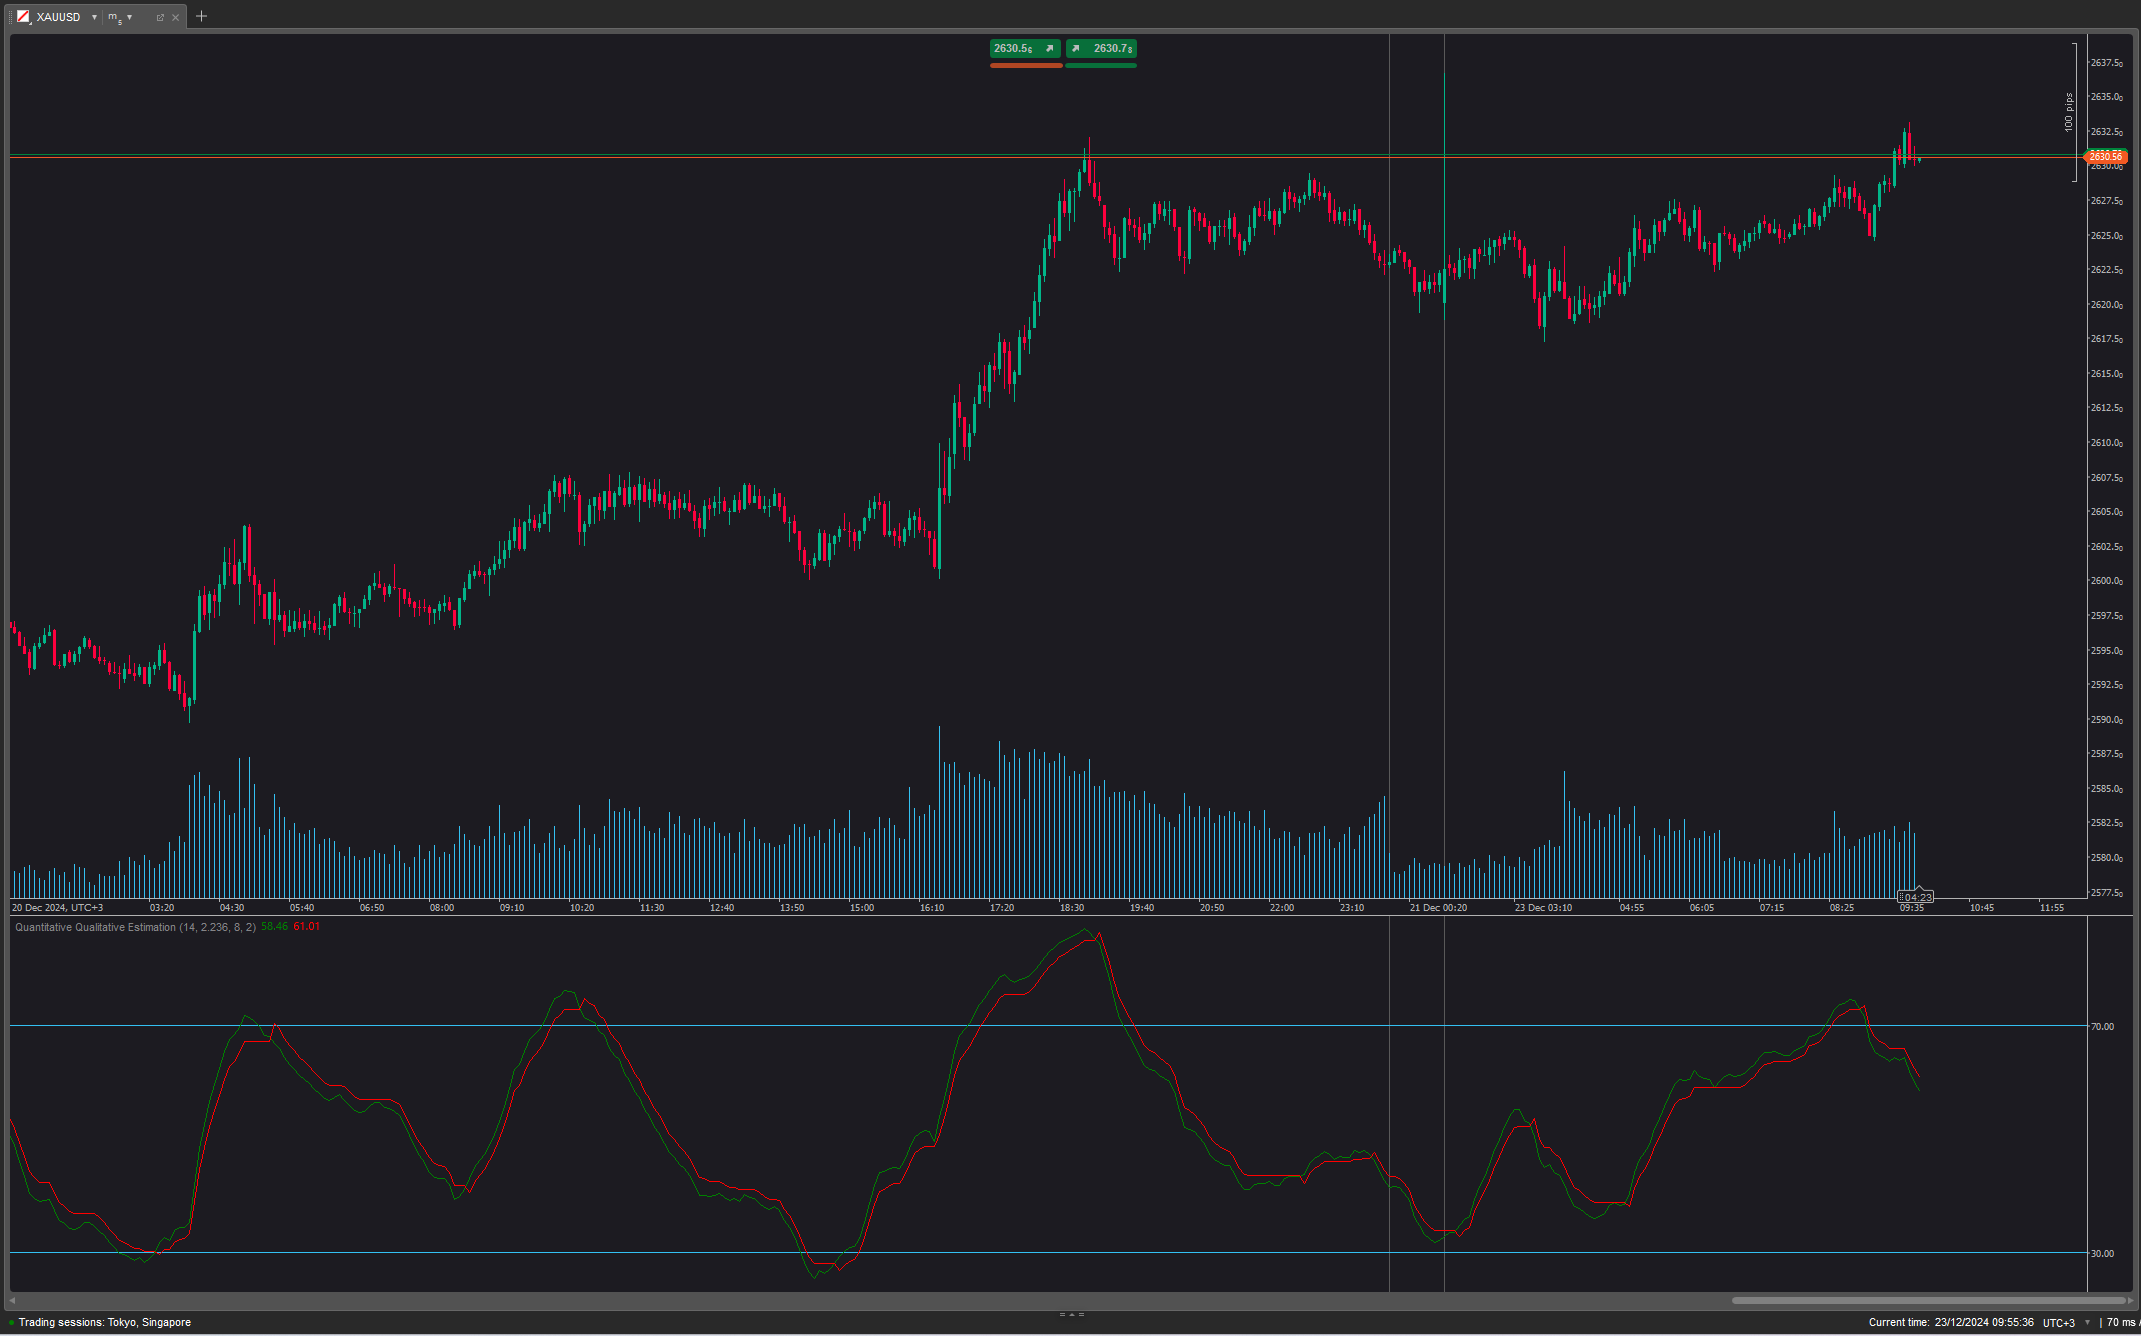
Quantitative Qualitative Estimation
The QQE (Quantitative Qualitative Estimation) Weighted Oscillator improves its original version by weighting the RSI.

Indicator
RSI
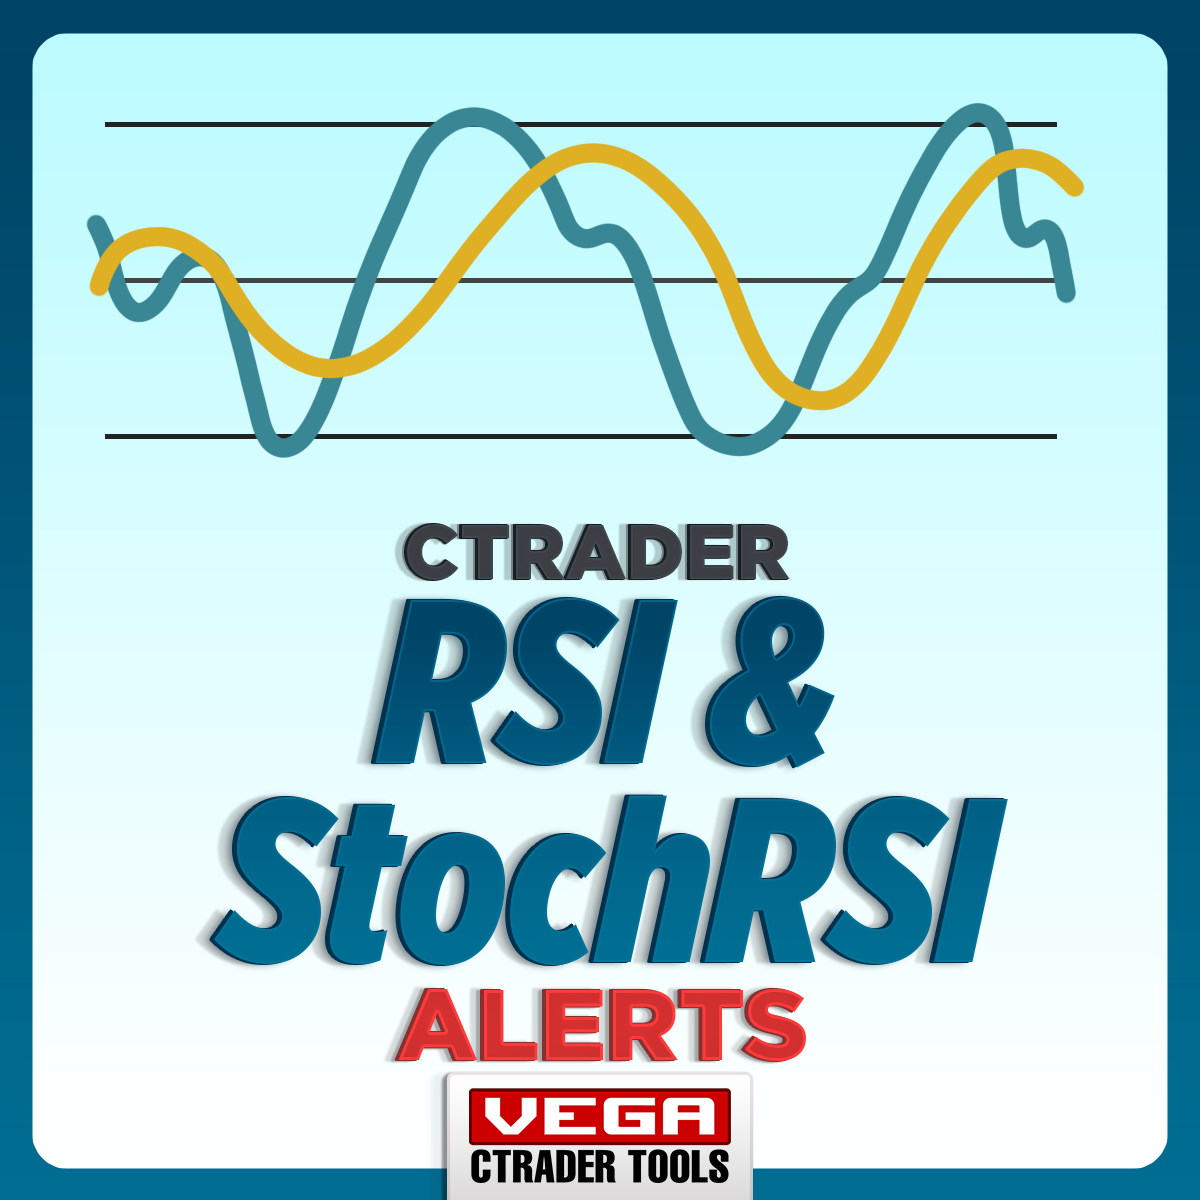
VegaXLR - RSI and StochRSI Alerts
VegaXLR's cTrader StochRSI identifies overbought/oversold RSI levels for precise trade entries.