Advanced Donchian Zones Indicator for cTrader
Master Market Trends & Breakouts with Precision!
Take your trading to the next level with the Advanced Donchian Zones Indicator – a powerful tool designed for traders who demand accuracy, flexibility, and efficiency. This next-generation indicator enhances the classic Donchian Channels by introducing multi-timeframe analysis, customizable price calculations, real-time alerts, and cloud visualization.
Whether you trade forex, stocks, or commodities, the Advanced Donchian Zones Indicator equips you with the tools to identify breakouts, ride trends, and trade reversals like a pro.
Key Features & Benefits:
1. Multi-Timeframe Donchian Zones
- Analyze Donchian Zones from a higher timeframe while trading on a lower one, ensuring you always align with the bigger market trend.
- Ideal for day traders and swing traders looking to optimize their entries and exits.
2. Customizable Price Calculation
- Choose from five advanced price types to refine your strategy:
- Highest High / Lowest Low
- Average of High/Open or High/Close
- Highest Open / Lowest Open
- Highest Close / Lowest Close
- Adapt the indicator to suit your trading style and risk management.
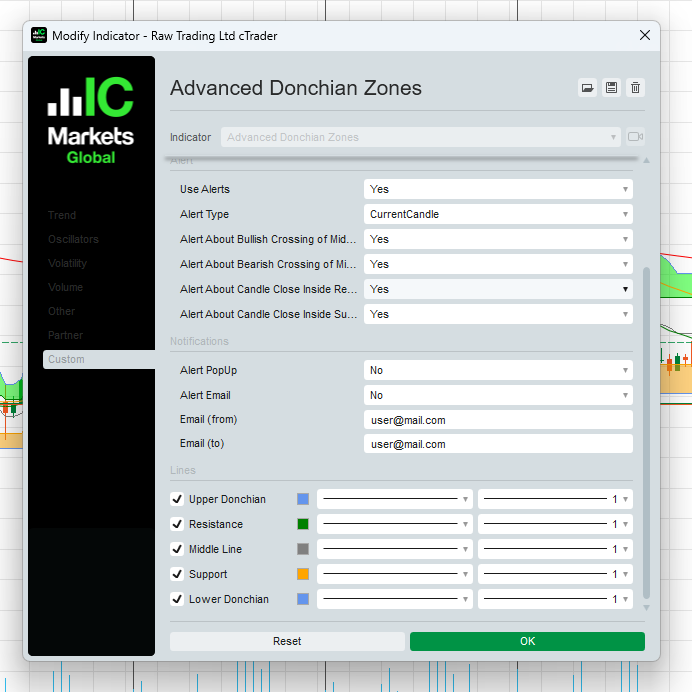
3. Dynamic Alerts – Never Miss an Opportunity!
- Get real-time notifications when key trading events occur:
- Midline Crossovers (Bullish or Bearish signals)
- Price Closing Inside Key Zones (Potential reversal or breakout zones)
- Alerts available via pop-ups and email, keeping you ahead of market movements.
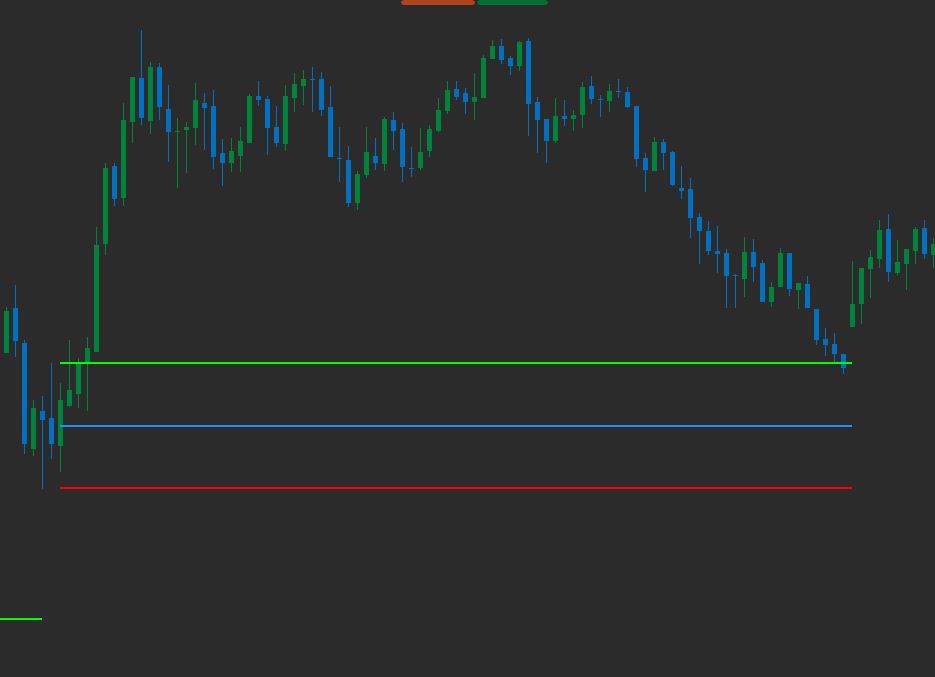
4. Cloud Visualization for Clear Insights
- Unique shaded zones between Donchian levels help traders visually identify support, resistance, and breakout areas quickly and effectively.
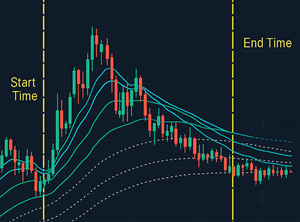
5. Flexible Shift Parameter
- Adjust the positioning of Donchian Zones forward or backward in time to fine-tune your trading strategy.
6. Easy-to-Use Interface
- Designed for traders of all levels, with an intuitive layout and customizable settings to match your trading preferences.
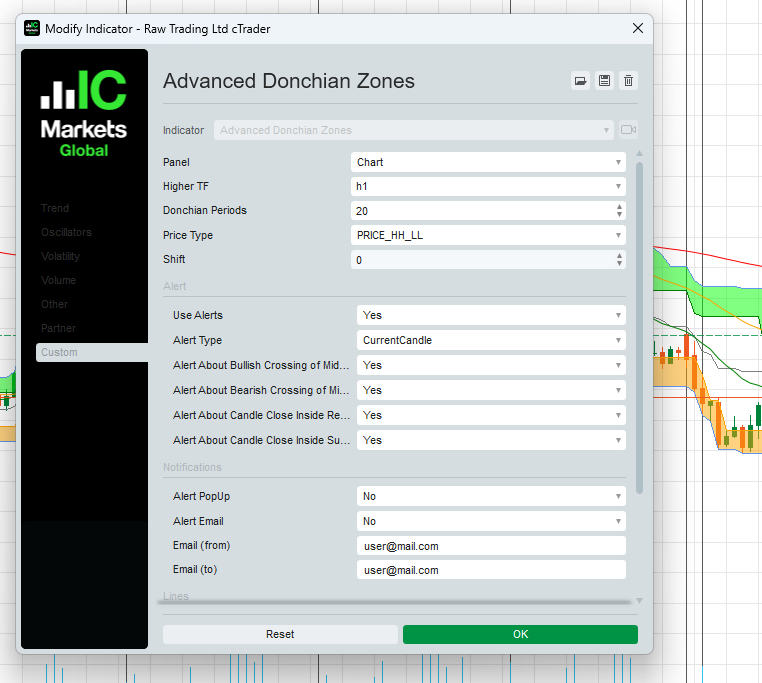
How to Use the Advanced Donchian Zones Indicator
1. Breakout Trading Strategy – Capture Explosive Moves!
- Setup:
- Apply the Advanced Donchian Zones Indicator to your chart.
- Select a Donchian period (e.g., 20) and a higher timeframe (e.g., 1H or 4H) for more accurate signals.
- Entry:
- Go Long when the price breaks and closes above the upper Donchian Zone.
- Go Short when the price breaks and closes below the lower Donchian Zone.
- Exit:
- Use the midline or the opposite Donchian Zone as your exit level.
- Example:
- If trading a 15-minute chart, set the Donchian calculation based on a 1-hour timeframe. When price breaks above the upper Donchian level, enter a buy trade with a stop-loss near the midline.
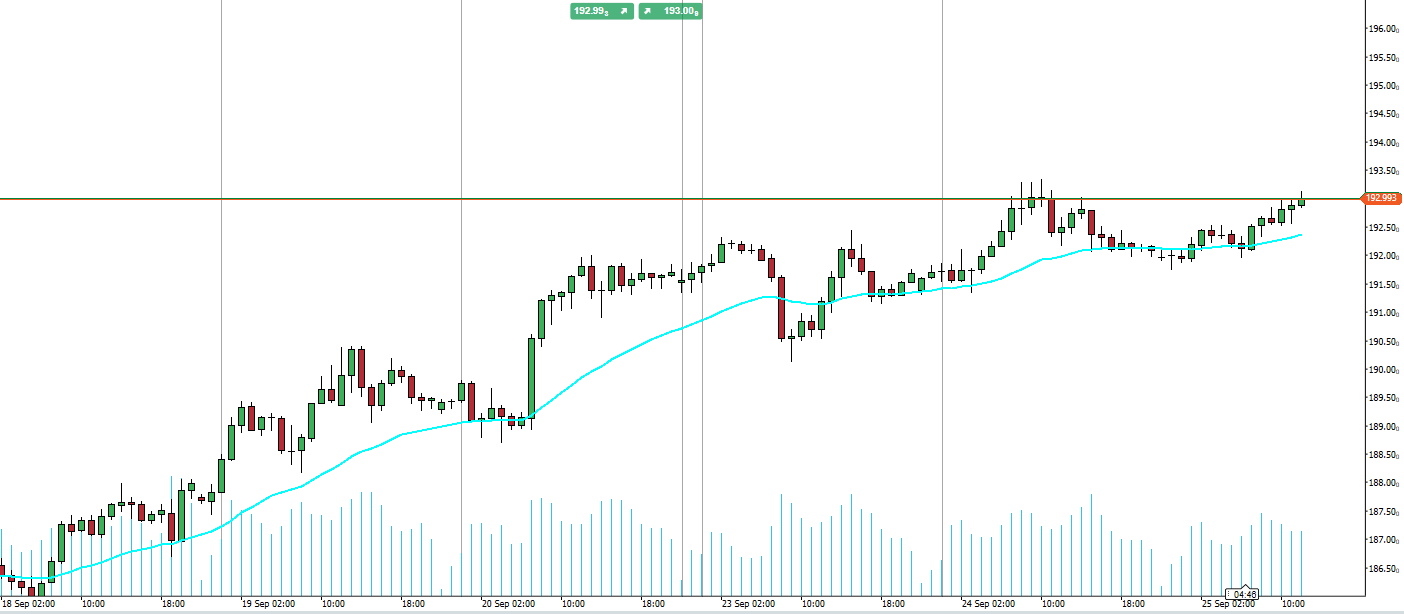
2. Trend-Following Strategy – Ride the Market Momentum
- Setup:
- Use the midline as a trend filter.
- Trade only in the direction of the prevailing trend.
- Entry:
- Go Long when the price is above the midline and bounces off the support zone.
- Go Short when the price is below the midline and bounces off the resistance zone.
- Exit:
- Close the trade when the price crosses the midline in the opposite direction.
- Example:
- On a 4-hour chart, price remains above the midline, confirming an uptrend. Enter a buy trade when the price retraces to the support zone and shows signs of reversal.
3. Range-Bound Trading Strategy – Profit in Sideways Markets
- Setup:
- Identify periods when price fluctuates between the upper and lower Donchian Zones.
- Entry:
- Go Long when price approaches support.
- Go Short when price approaches resistance.
- Exit:
- Take profits near the opposite Donchian Zone or when a breakout occurs.
- Example:
- On a 1-hour chart, if price is oscillating between the upper and lower Donchian levels, execute trades at these extremes for mean-reversion opportunities.
Why Traders Choose Advanced Donchian Zones
✔ Versatile for Different Trading Styles – Works for breakouts, trend-following, and range trading.
✔ Enhances Trading Precision – Identify key support & resistance levels with accuracy.
✔ Real-Time Alerts – Stay informed with instant notifications.
✔ Professional-Grade Tool – Developed for traders looking for an edge in the market.
Pricing & Exclusive Offer
Special Limited-Time Price: $97 (One-Time Payment)
Includes:
- Advanced Donchian Zones Indicator for cTrader
- Comprehensive User Guide with step-by-step strategies
- Free Updates for 1 Year
- Priority Email Support
What Traders Are Saying
“I’ve been using Donchian Channels for years, but this indicator takes it to another level. The multi-timeframe feature is a game-changer!”
— Mark S., Forex Trader
“The alerts and customizable price settings help me catch breakout trades with more confidence. Highly recommended for serious traders.”
— Lisa T., Swing Trader
Get Started Today!
Ready to transform your trading? Click the button below to purchase the Advanced Donchian Zones Indicator and start trading with precision!
[Buy Now for $97]
30-Day Money-Back Guarantee
We stand by our product. If you’re not completely satisfied, contact us within 30 days for a full refund – no questions asked.
Need Help? Contact Us!
📧 Email: o.elmottaqy@gmail.com
🌐 Website: https://t.me/mottaqyo
Risk Disclaimer
Trading involves risk. The Advanced Donchian Zones Indicator is a tool to assist your trading decisions but does not guarantee profits. Always use proper risk management and trade responsibly.


.jpeg)