Rsi + Volume

5.0
03/09/2025
330
Desktop
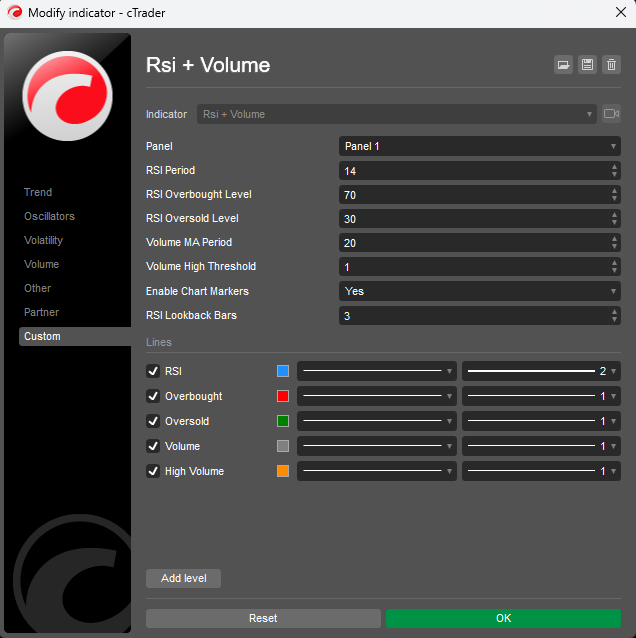
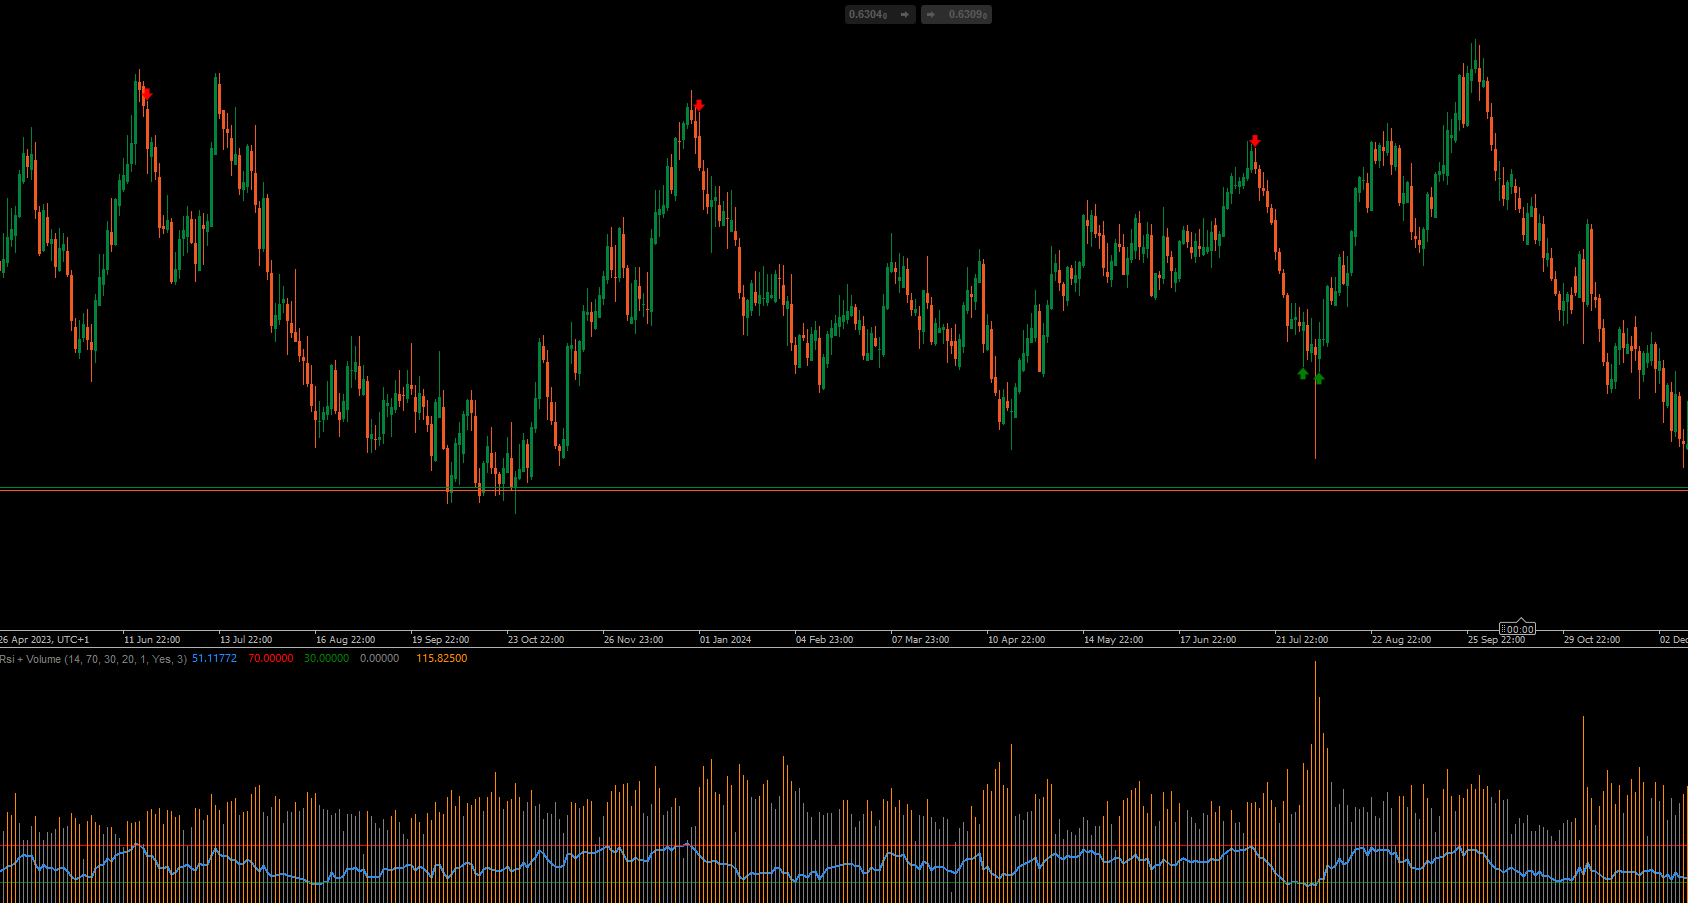
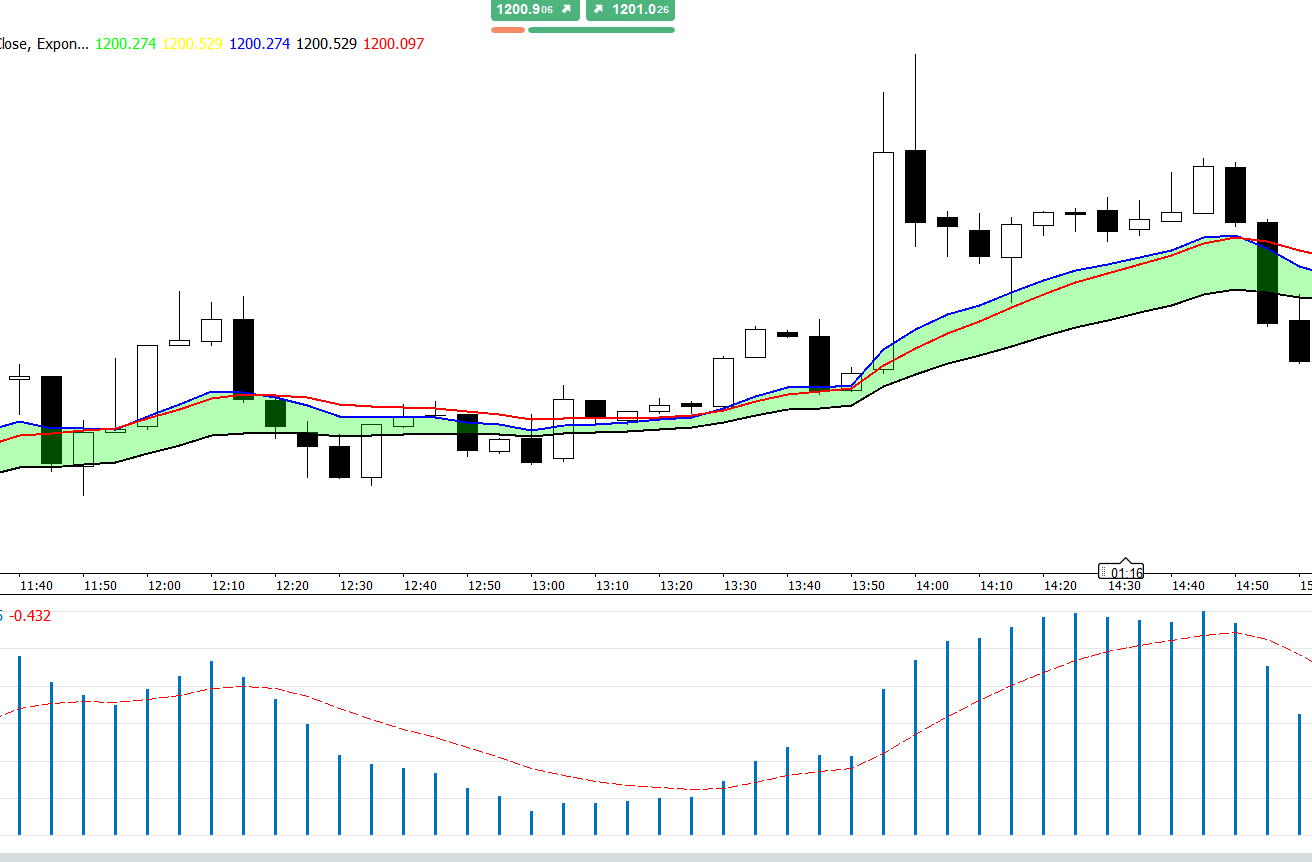
This indicator combines RSI (Relative Strength Index) with volume analysis to generate more reliable trading signals. It works on the principle that significant price movements should be accompanied by high volume to confirm the strength of the move.
Key Components:
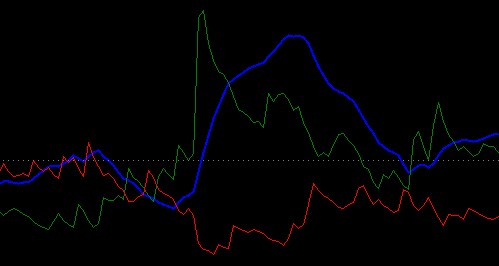
- RSI Analysis:
- Measures the speed and change of price movements on a scale of 0-100
- Identifies overbought conditions (above 70) and oversold conditions (below 30)
- Helps spot potential reversal points in the market
- Volume Analysis:
- Compares current volume to a moving average of recent volume
- Highlights periods of high volume (orange histogram bars)
- Confirms strength behind price movements
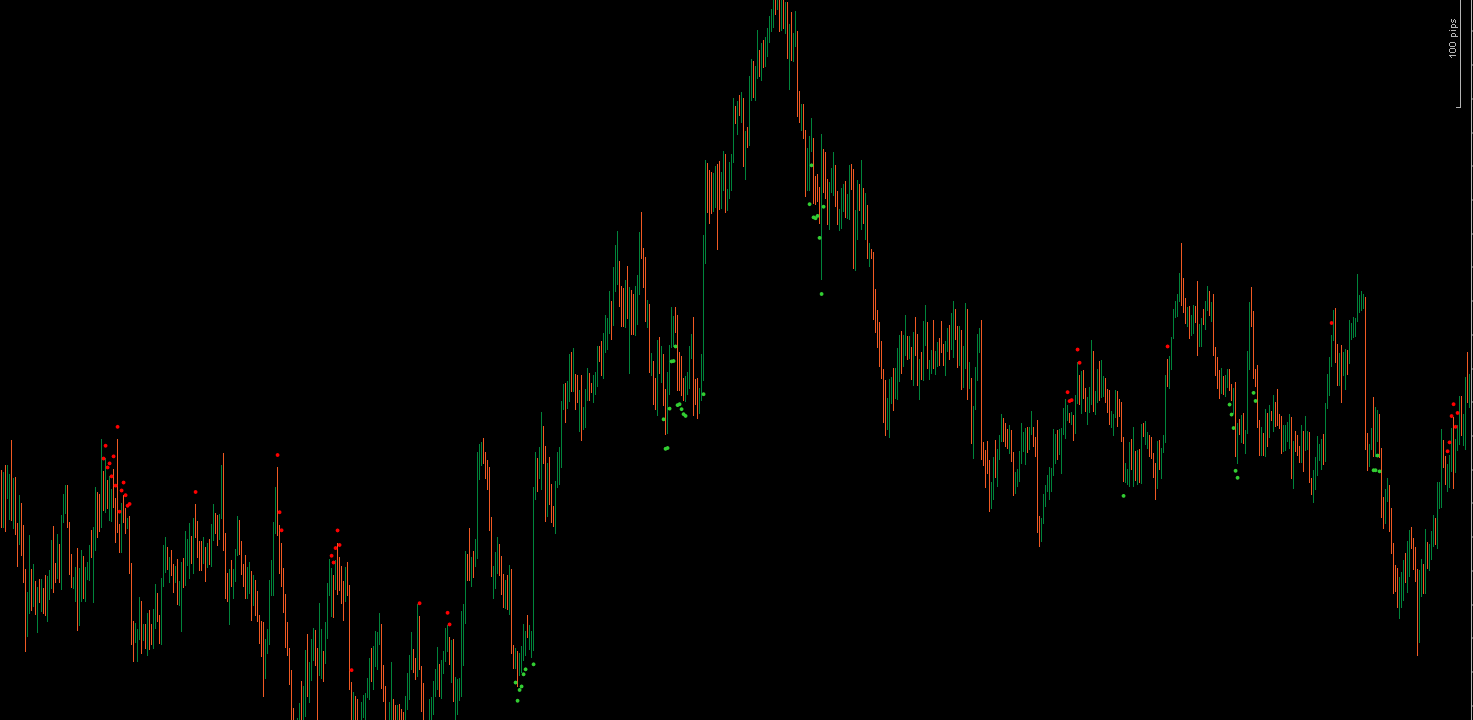
- Signal Generation:
- Buy Signal: When RSI crosses above the oversold level (30) with high volume
- Sell Signal: When RSI crosses below the overbought level (70) with high volume
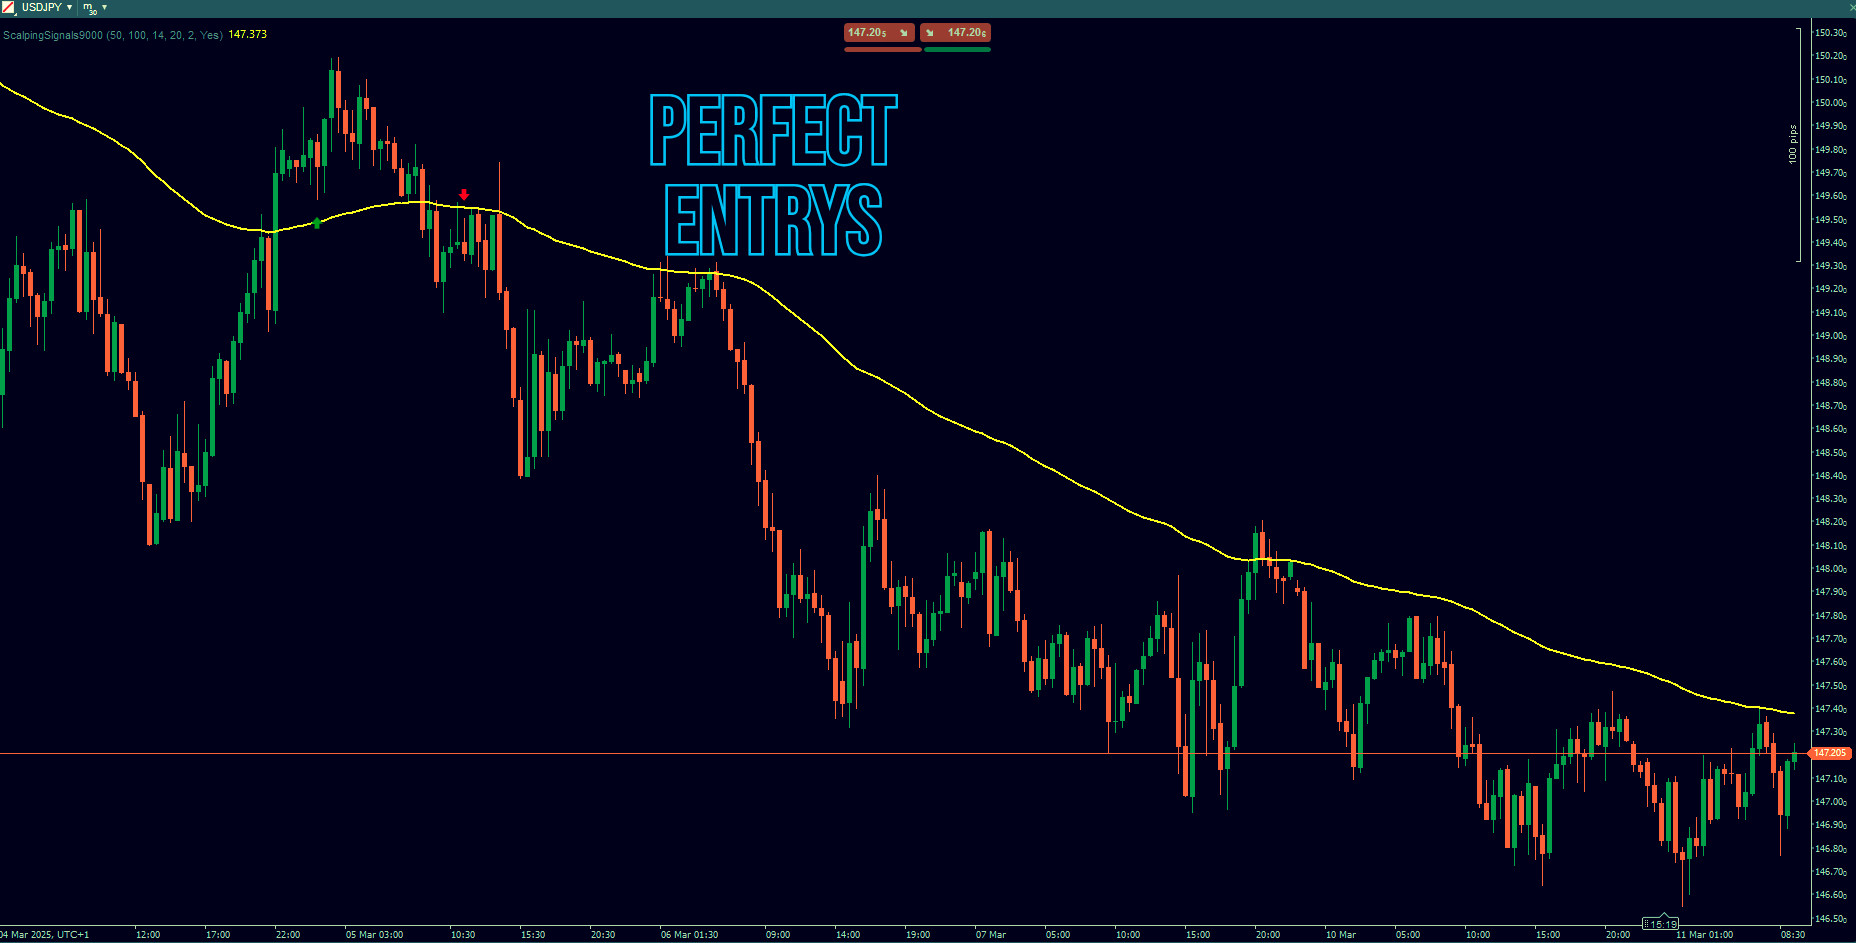
- Visual signals appear directly on the chart (green up arrows for buy, red down arrows for sell)
How to Use It:
- Look for buy signals when price is in a downtrend and RSI shows oversold conditions
- Look for sell signals when price is in an uptrend and RSI shows overbought conditions
- Higher volume confirms the strength of the signal
- Adjust the parameters (RSI period, volume threshold) to match your trading timeframe
This indicator helps filter out false signals by requiring both RSI confirmation and above-average volume, making it more reliable than using RSI alone.
5.0
Reviews: 1
5 | 100 % | |
4 | 0 % | |
3 | 0 % | |
2 | 0 % | |
1 | 0 % |
Customer reviews
August 12, 2025
Pros: Combines RSI and volume for stronger trading signals. Works well when RSI threshold intersects with high volume spikes. Lightweight and clear visuals. Cons: No alerts or tooltips. Lacks template saving. May generate noise on low-volume timeframes without additional filters.
More from this author


You may also like
!["[Hamster-Coder] Bollinger Bands" logo](https://market-prod-23f4d22-e289.s3.amazonaws.com/1114cb2b-7120-42b3-8f53-dbc26968e6af_Icon300.jpg)