[Stellar Strategies] BOS Trend 1.0
!["[Stellar Strategies] BOS Trend 1.0" logo](https://market-prod-23f4d22-e289.s3.amazonaws.com/808c7722-ba53-4633-b8a4-16f31eeb1fc2_[Stellar Strategies] BOS Trend.jpg)
5.0
03/09/2025
298
Desktop
!["[Stellar Strategies] BOS Trend 1.0" uploaded image](https://market-prod-23f4d22-e289.s3.amazonaws.com/f6d29960-093f-4d61-9ec9-2c97509d7d88_kkb0xCznLx.png)
!["[Stellar Strategies] BOS Trend 1.0" uploaded image](https://market-prod-23f4d22-e289.s3.amazonaws.com/d421ffc6-b6eb-483a-86f6-08c2e163e69a_zB5fQ3cyf2.png)
!["[Stellar Strategies] BOS Trend 1.0" uploaded image](https://market-prod-23f4d22-e289.s3.amazonaws.com/5ffbf73e-2aa8-4c8f-9249-65876c7d745c_yrh5adACC5.png)
!["[Stellar Strategies] BOS Trend 1.0" uploaded image](https://market-prod-23f4d22-e289.s3.amazonaws.com/26efa28c-2aca-424e-aa08-7cfb1aefb249_3DLnfTUv9A.png)
!["[Stellar Strategies] BOS Trend 1.0" uploaded image](https://market-prod-23f4d22-e289.s3.amazonaws.com/6c417256-104f-4548-8285-e978a5349a92_fWtXLZU92q.png)
!["[Stellar Strategies] BOS Trend 1.0" uploaded image](https://market-prod-23f4d22-e289.s3.amazonaws.com/b600c2e2-d07c-4eec-b3fa-b4c2ae7834c8_vP9AT1nLsy.png)
!["[Stellar Strategies] BOS Trend 1.0" uploaded image](https://market-prod-23f4d22-e289.s3.amazonaws.com/3e939567-7363-435a-86a9-179b33952719_cTrader_DjzHerMUya.png)
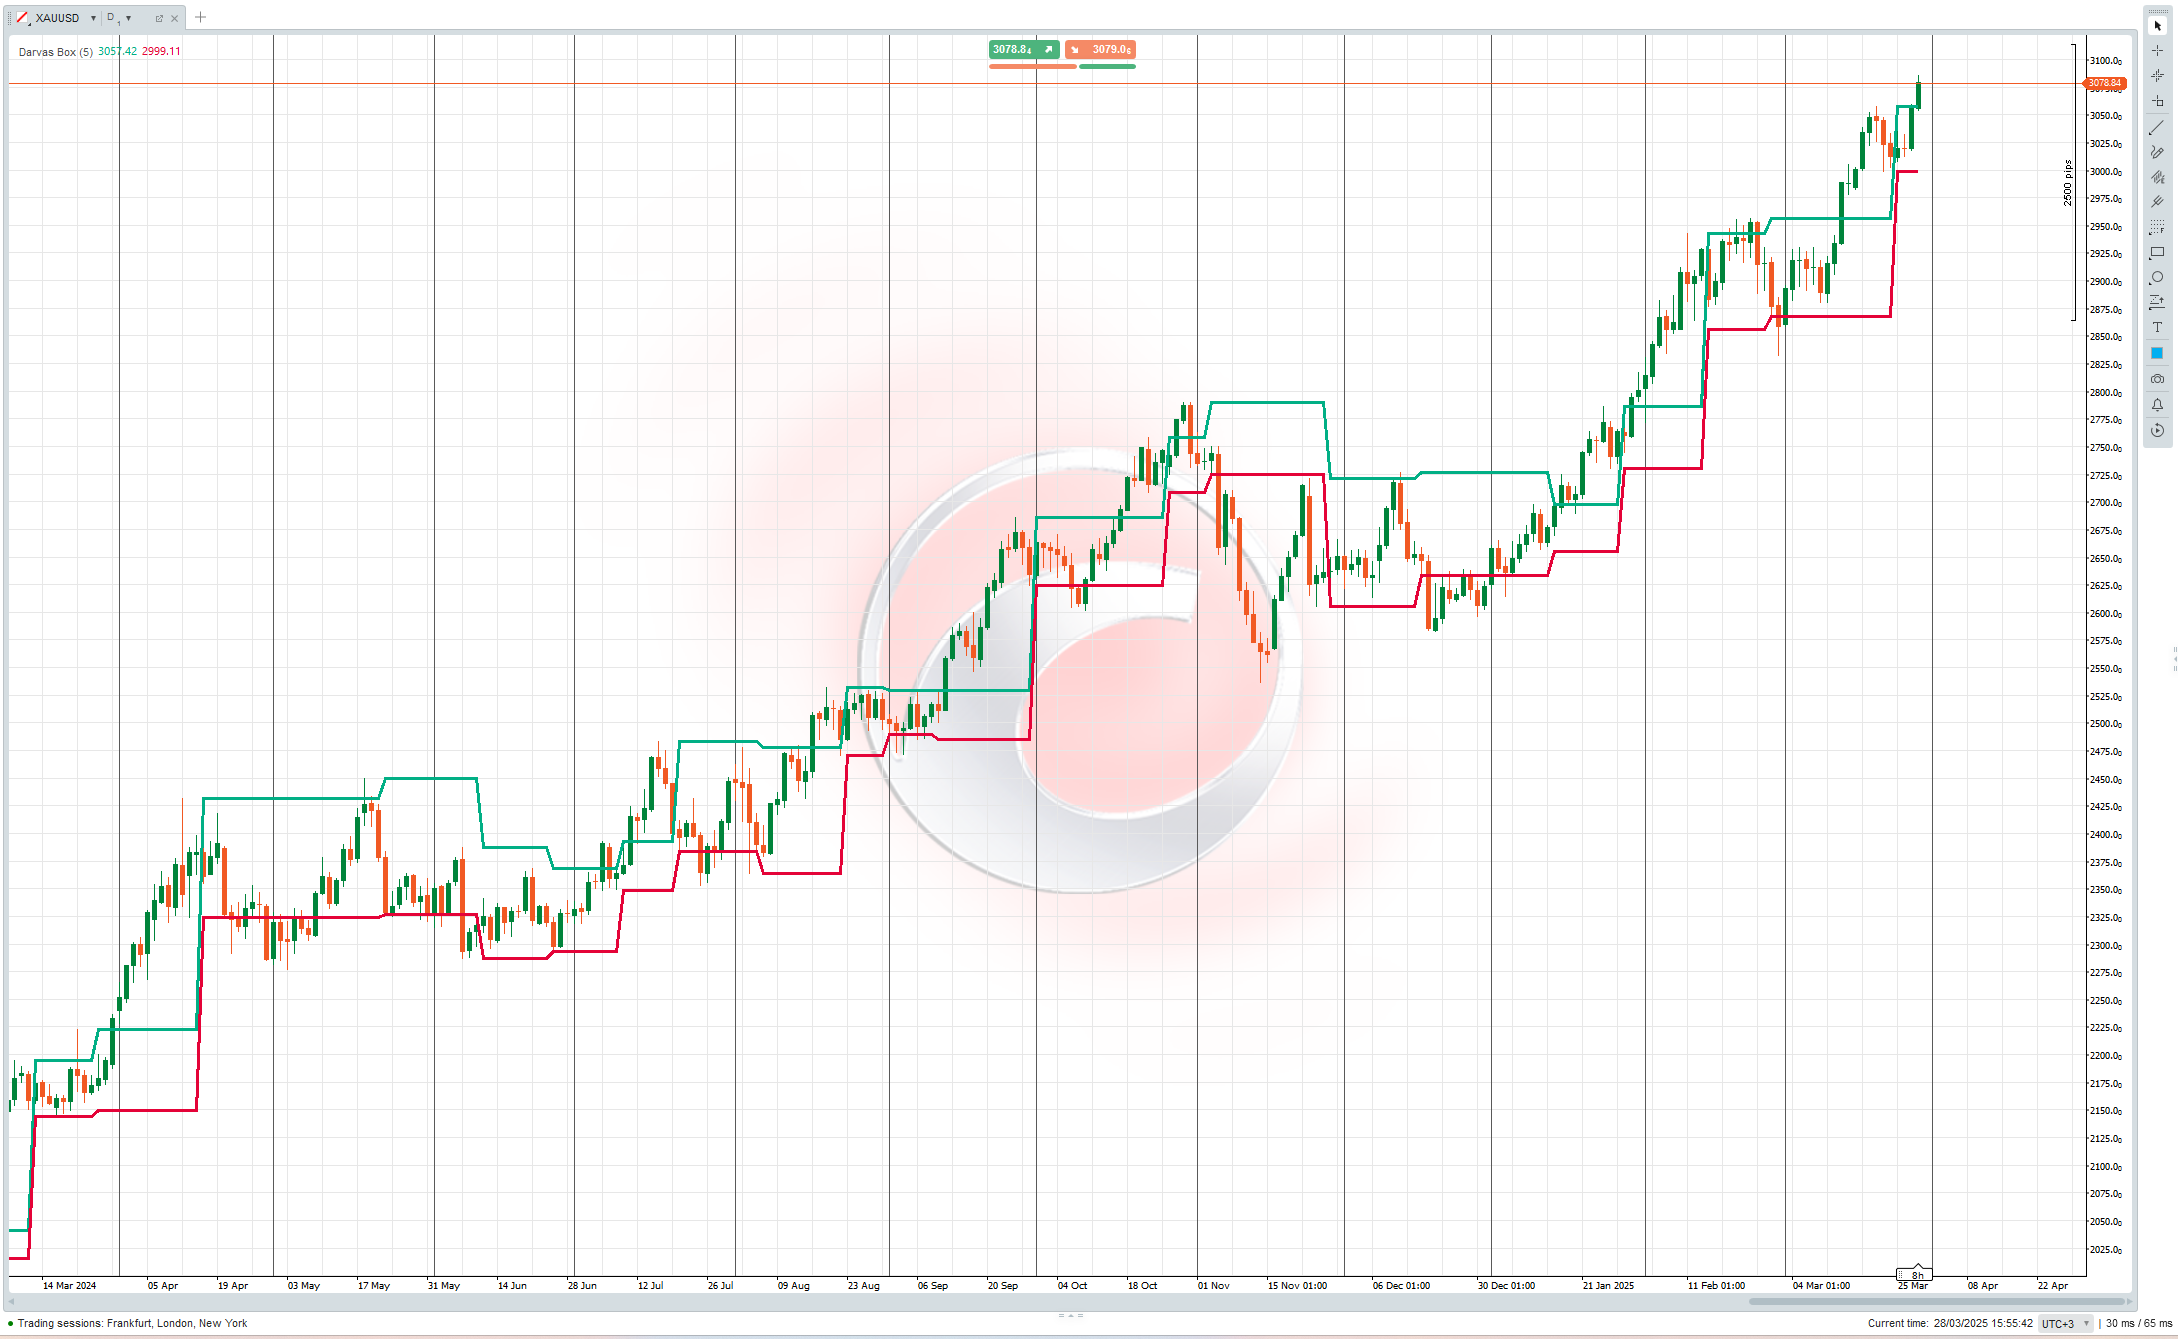
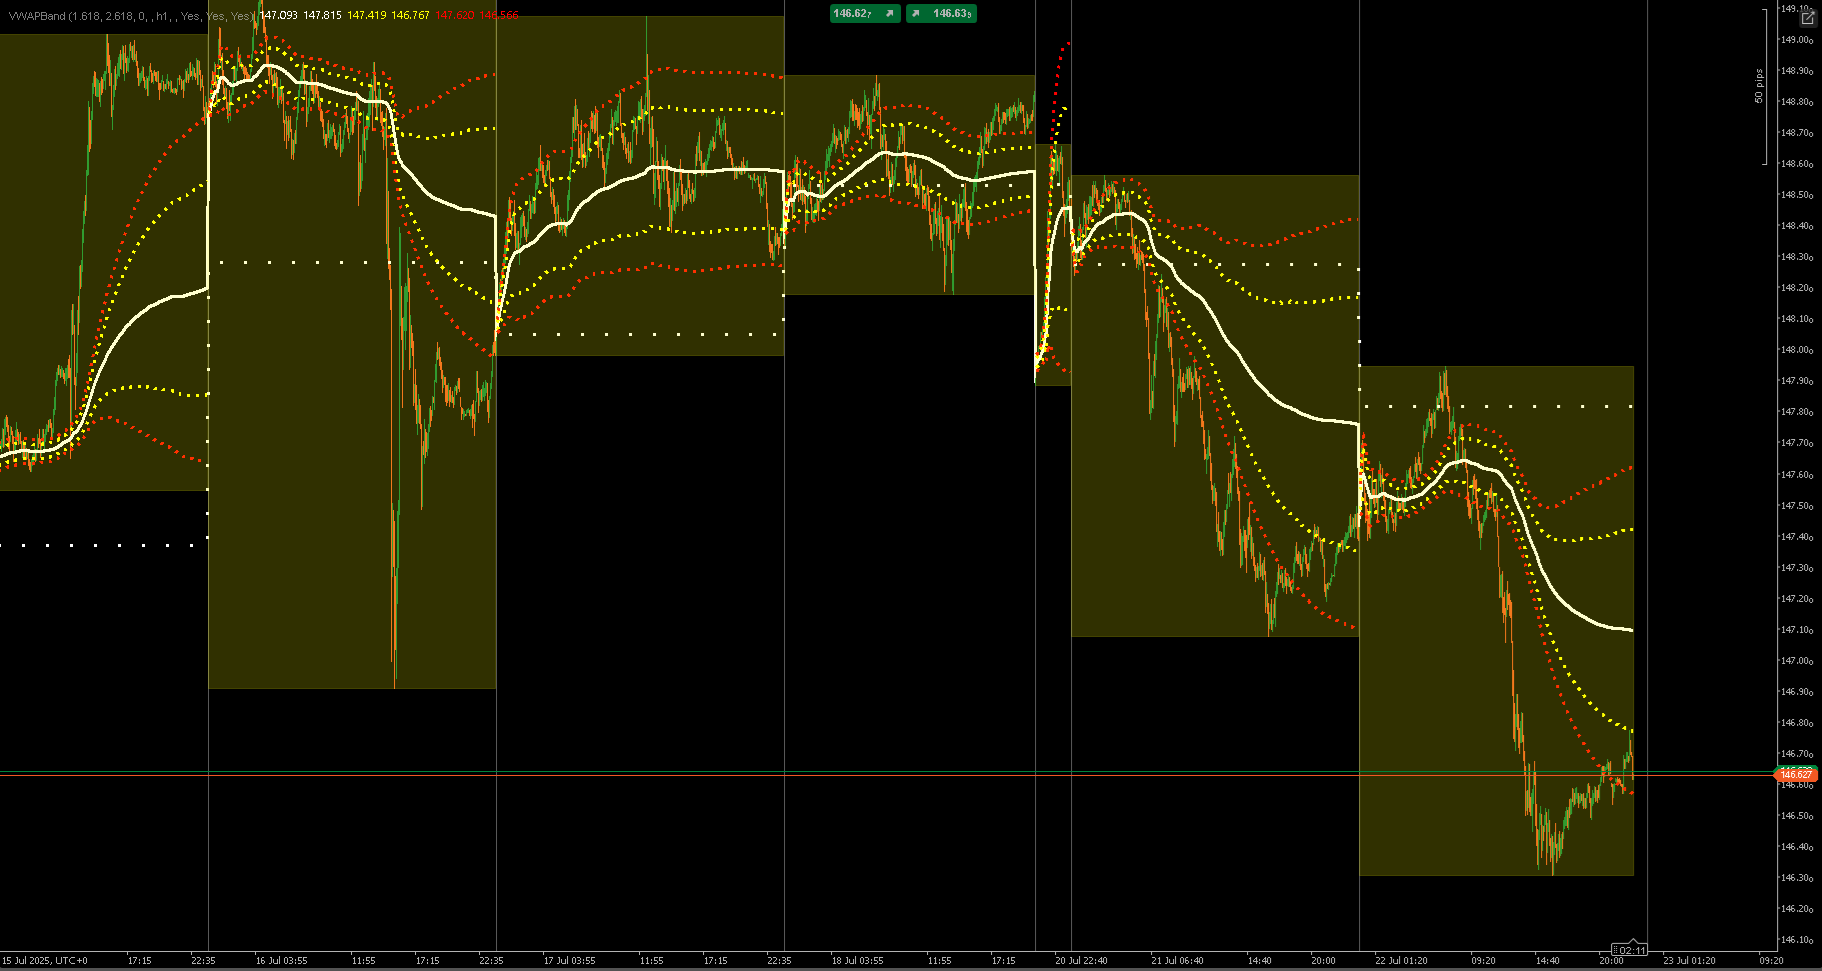
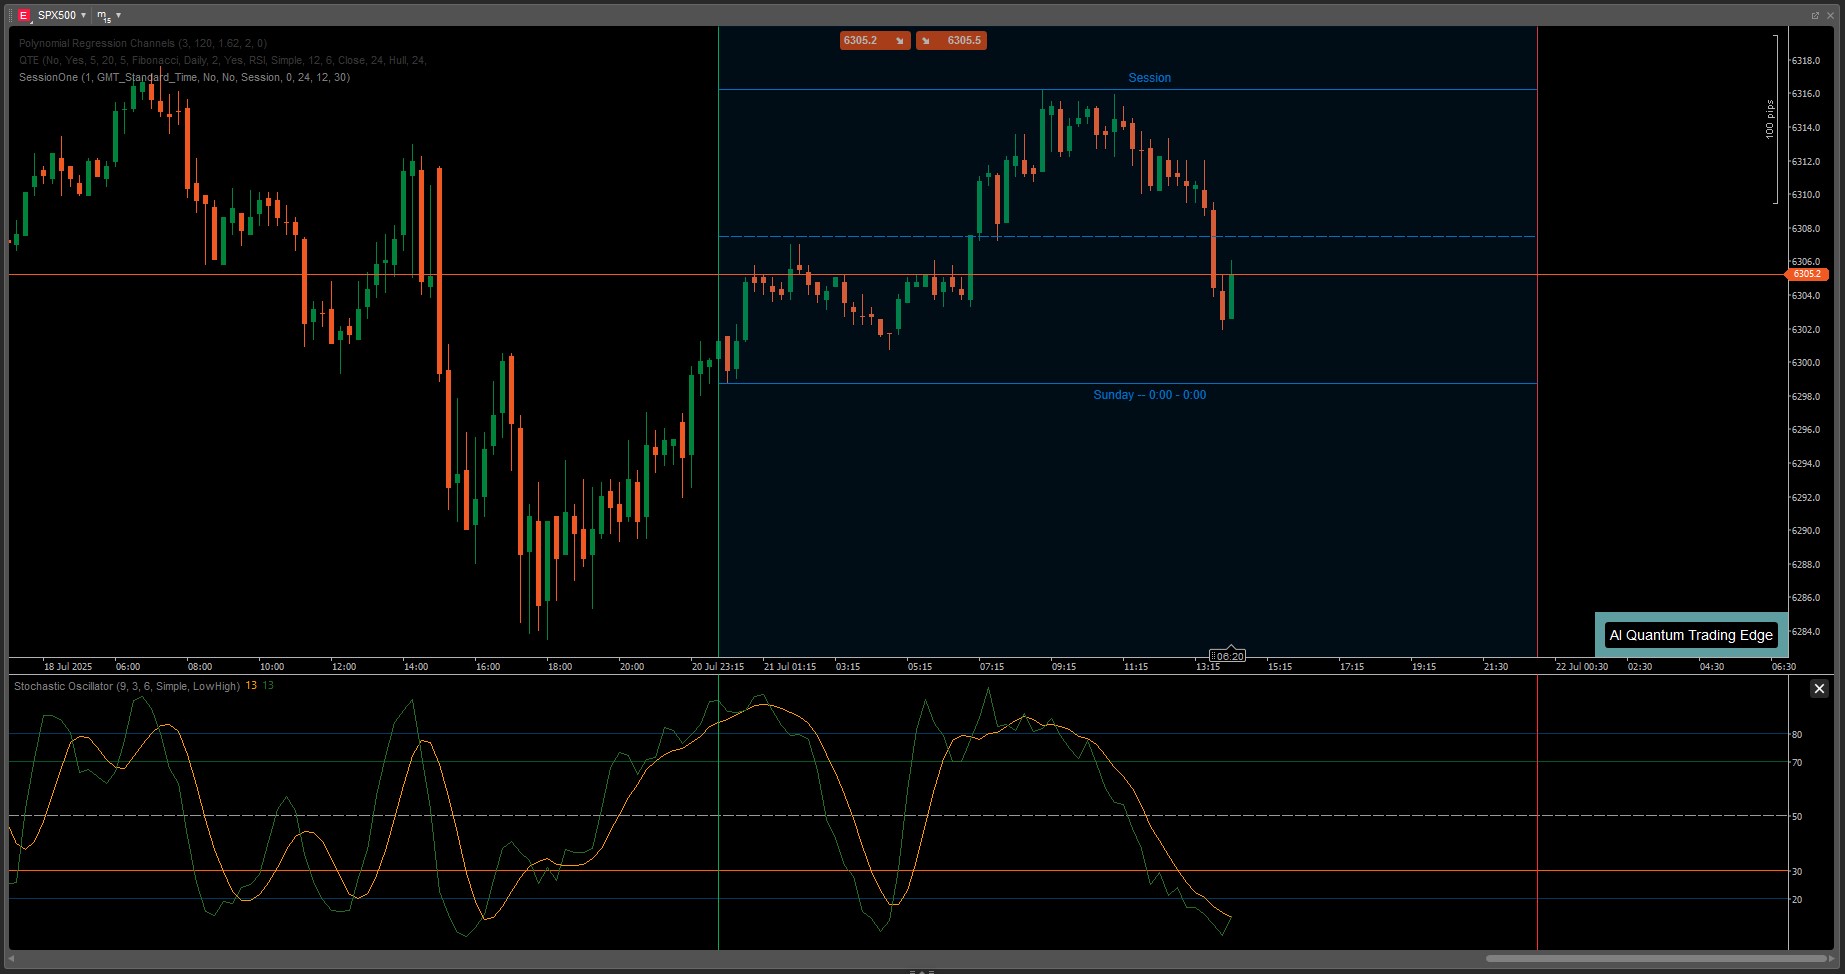
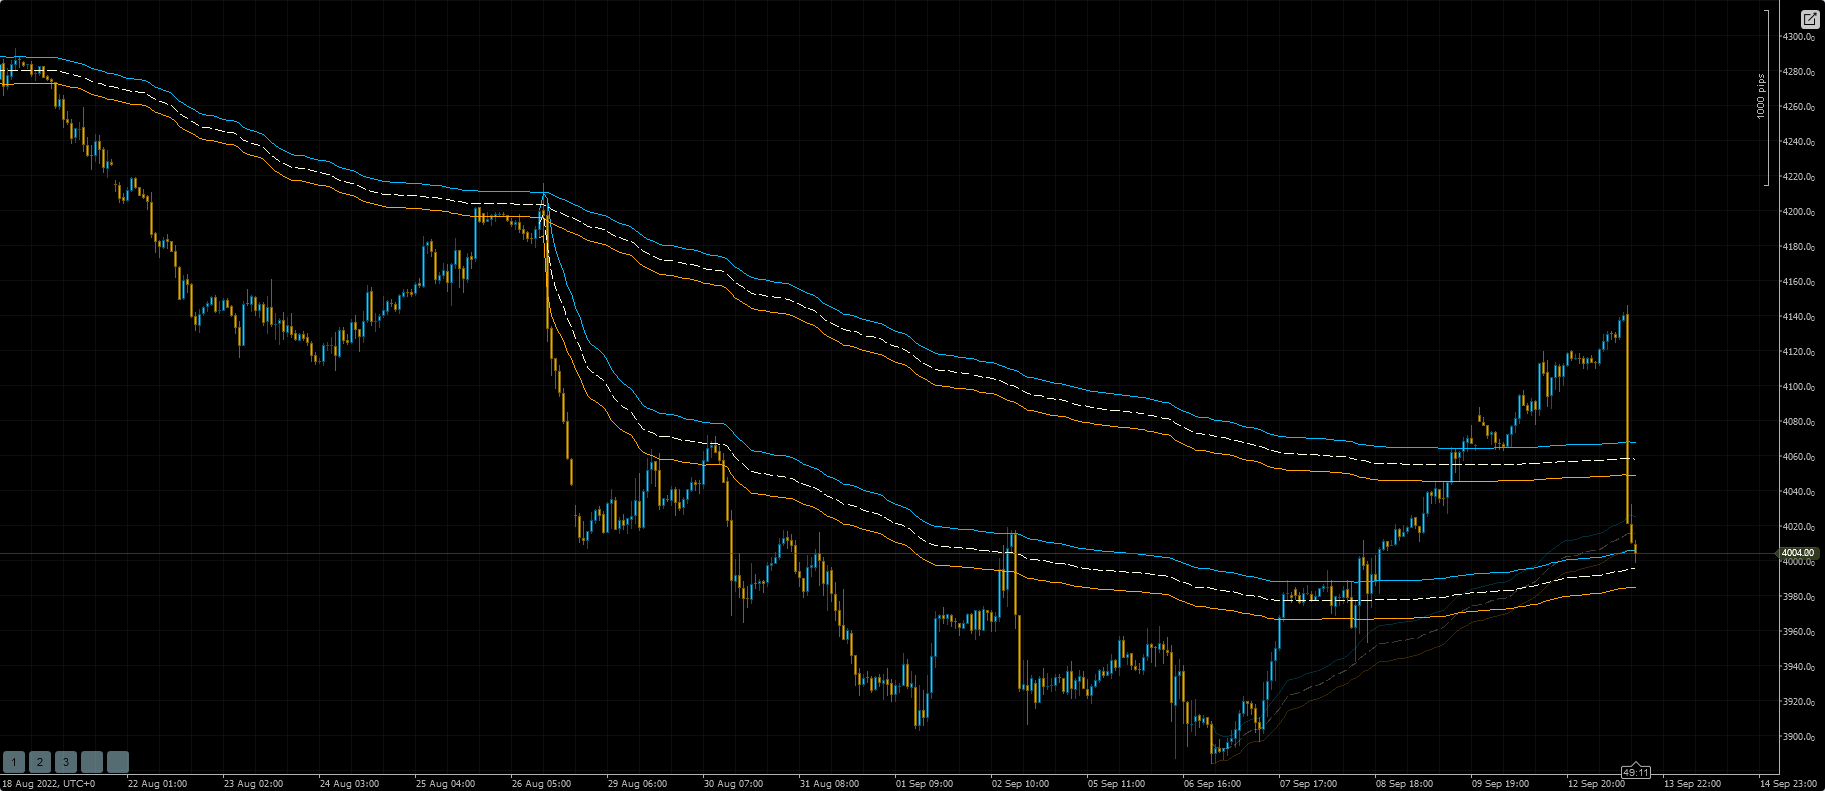
The [Stellar Strategies] BOS Trend is a premium multi-timeframe Break of Structure (BOS) indicator designed for cAlgo. It provides traders with critical insights into market trends by detecting uptrend and downtrend BOS across multiple timeframes.
Features:
- Multi-Timeframe Analysis: Analyzes price movements across various timeframes (1 min to daily).
- Customizable Timeframes: Enable or disable specific timeframes to tailor your analysis.
- Real-Time Alerts: Displays messages on the chart when a BOS is detected.
- User-Friendly Interface: Customizable text color for better visibility on different chart backgrounds.
Parameters:
- Lookback Period (Default: 20): The number of bars to look back when detecting BOS.
- Time Frame Parameters:
Use 1 Minute Time FrameUse 5 Minute Time FrameUse 15 Minute Time FrameUse 30 Minute Time FrameUse 1 Hour Time FrameUse 4 Hour Time FrameUse Daily Time Frame
- Text Color (Default: "Yellow"): Sets the color for BOS messages.
How to Use the Indicator:
- Adding the Indicator:
- Open your cAlgo platform.
- Navigate to the indicators section and add the [Stellar Strategies] BOS Trend to your chart.
- Setting Parameters:
- Lookback Period: Adjust the lookback period according to your trading strategy (default is 20 bars).
- Enable/Disable Time Frames: Select the timeframes you want to analyze by checking or unchecking the corresponding options.
- Text Color: Choose a text color that contrasts well with your chart background for clear visibility.
- Reading BOS Signals:
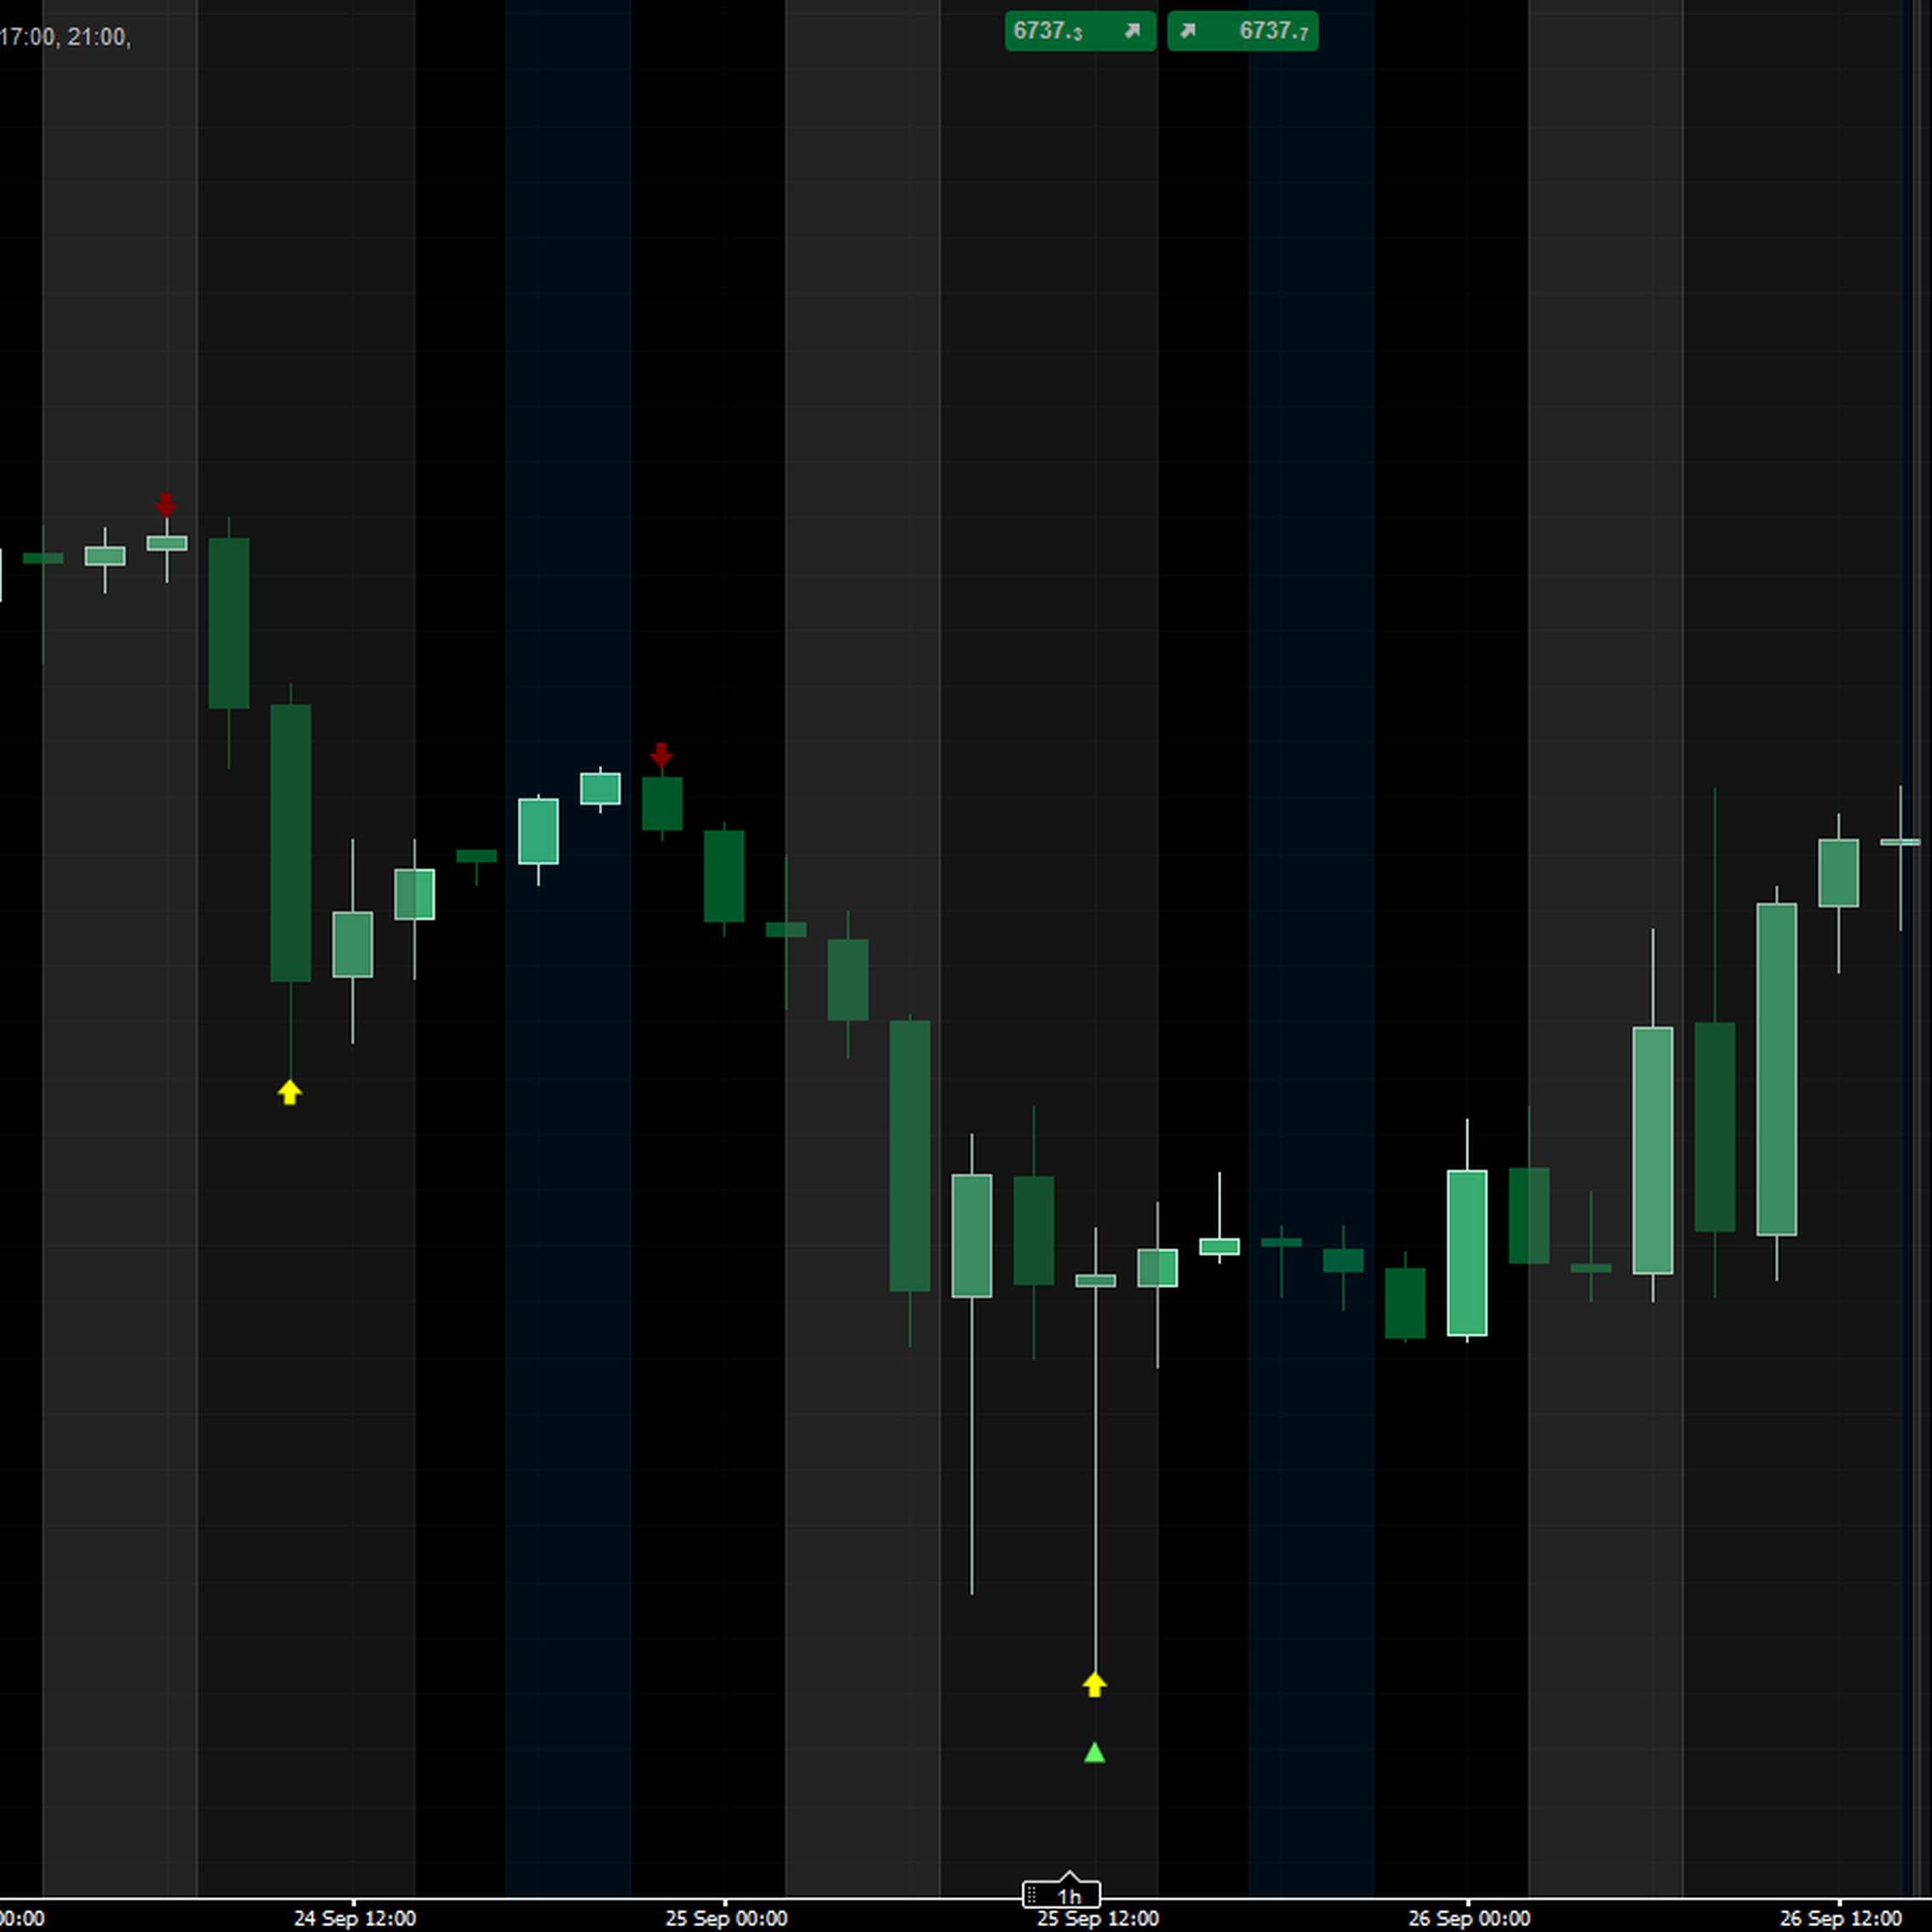
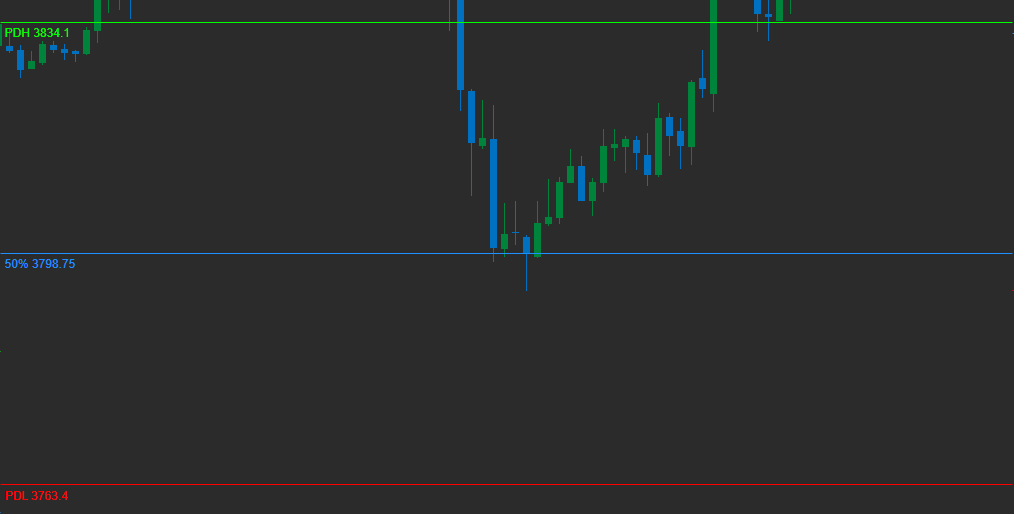
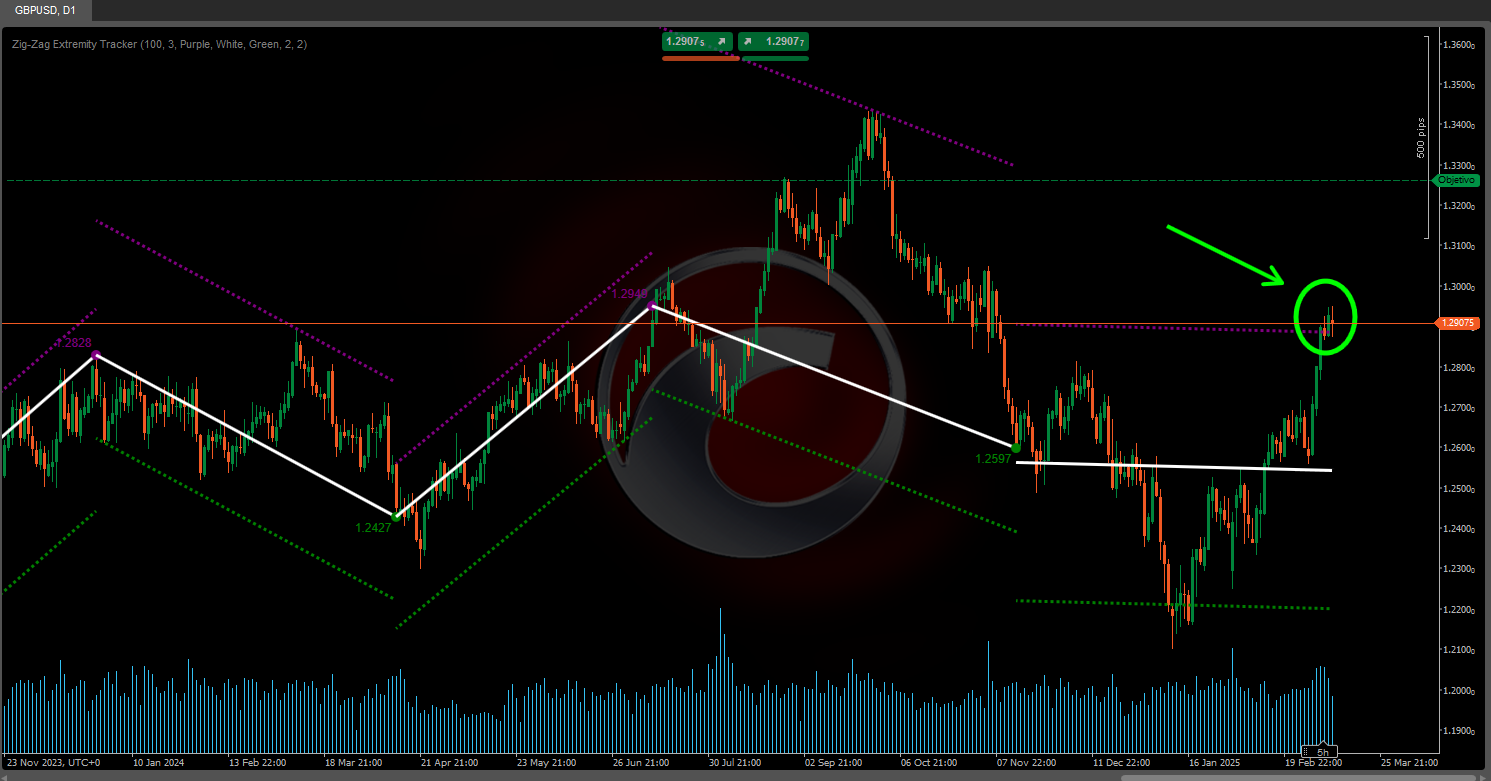
- Uptrend BOS: Green lines indicate an uptrend break of structure.
- Downtrend BOS: Red lines indicate a downtrend break of structure.
- BOS Messages: Messages such as "Current TF: Uptrend BOS detected" will appear on the chart, along with other messages from different timeframes you have enabled.
- Interpreting the Data:
- Use the BOS signals to identify potential trend reversals or continuations.
- Pay attention to multiple timeframe analysis for stronger confirmation of trends.
- Customizing Display:
- You can adjust the text color and position of BOS messages for better readability.
Example:
Here’s a step-by-step example of how to use the [Stellar Strategies] BOS Trend indicator:
- Add the Indicator:
- Open a chart in your cAlgo platform.
- Go to
Indicatorsand select [Stellar Strategies] BOS Trend.
- Set the Parameters:
- Set the
Lookback Periodto 20. - Enable
Use 1 Minute Time Frame,Use 5 Minute Time Frame, and other timeframes as needed. - Set
Text Colorto "Yellow" for better visibility.
- Set the
- Monitor the Chart:
- Observe the green (uptrend) and red (downtrend) BOS lines on your chart.
- Look for messages indicating BOS detection across different timeframes.
- Take Action:
- Use the BOS signals to make informed trading decisions based on trend reversals or continuations.
By following these steps, you can effectively utilize the [Stellar Strategies] BOS Trend indicator to enhance your trading strategy with multi-timeframe BOS analysis.
Feel free to let me know if you need further assistance or more information! 📈📉
5.0
Reviews: 1
5 | 100 % | |
4 | 0 % | |
3 | 0 % | |
2 | 0 % | |
1 | 0 % |
Customer reviews
August 18, 2025
Pros: Automatically detects and marks Break Of Structure points indicating trend shifts. Clean visual arrows and straightforward setup. Cons: No alerts, tooltips, or template saving. May produce noise without volume or market context filters.
More from this author
!["[Stellar Strategies] Market Structure Breakout" logo](https://market-prod-23f4d22-e289.s3.amazonaws.com/99d762b3-fbbe-489d-9c19-e72c41ffe387_cT_cs_4141285_EURUSD_2025-04-21_20-25-12.png)
!["[Stellar Strategies] MARSI Signal Plotter" logo](https://market-prod-23f4d22-e289.s3.amazonaws.com/ce01bd9f-8907-48d9-a68d-7c0bde6b9704_4aDZjo80P5.png)
!["[Stellar Strategies] Wave Trend Pro" logo](https://market-prod-23f4d22-e289.s3.amazonaws.com/8c93438a-6b0a-4026-93b2-0694329a3bc1_cT_cs_4141285_EURUSD_2025-04-25_17-52-31.png)
!["[Stellar Strategies] Market Session Ultimate" logo](https://market-prod-23f4d22-e289.s3.amazonaws.com/92b85b76-697c-4a8f-811f-ddd63eb8f9c8_cTrader_oSHtUgCtNJ.png)
!["[StellarStrategies] Scheduled Trade Executor" logo](https://market-prod-23f4d22-e289.s3.amazonaws.com/f13e96a0-274f-490e-8aa5-5a154d8bcf60_stellar12.jpg)
!["[Stellar Strategies] Inside Bar with Signals" logo](https://market-prod-23f4d22-e289.s3.amazonaws.com/c12d088e-7b52-4961-a0d2-7e38a2499bd3_cT_cs_4141285_EURUSD_2025-07-15_13-15-32.png)
!["[Stellar Strategies] Linear Regression Candles 1.1" logo](https://market-prod-23f4d22-e289.s3.amazonaws.com/19ef277f-e0b6-48ef-8941-88bfbba145f3_cT_cs_4141285_EURUSD_2025-03-30_19-53-31.png)
!["[Stellar Strategies] Visual Trend Momentum" logo](https://market-prod-23f4d22-e289.s3.amazonaws.com/3835d044-1c21-4909-9d3c-2635f984b93d_visualtrendmomentum.jpg)
!["[Stellar Strategies] QQE" logo](https://market-prod-23f4d22-e289.s3.amazonaws.com/ed4b3af5-54e4-404e-80eb-a23fa7ef0282_cTrader_7oDDAbSmSP.png)
!["[Stellar Strategies] Moving Averages Combined 1.0" logo](https://market-prod-23f4d22-e289.s3.amazonaws.com/b4cd360c-5f3c-4902-b2e1-6b86da1199bb_Gemini_Generated_Image_nl1erpnl1erpnl1e.jpg)
!["[Stellar Strategies] SP500 Gap Closure cBot 1.0" logo](https://market-prod-23f4d22-e289.s3.amazonaws.com/62a77232-02a9-423b-a5e4-bd2c2bc8db97_cT_cs_4141285_US500_2025-03-21_17-12-57.png)
!["[Stellar Strategies] Ultimate Trend & Momentum Dashboard" logo](https://market-prod-23f4d22-e289.s3.amazonaws.com/d8a894f3-34df-4f37-b4a3-c37e971e4e1f_cT_cs_4141285_NAS100_2025-06-24_17-12-20.png)
!["[Stellar Strategies] Market Regime Filter" logo](https://market-prod-23f4d22-e289.s3.amazonaws.com/cb84a98c-46f6-4cfd-b0ba-16518a618cb1_cT_cs_4141285_EURUSD_2025-04-20_16-50-30.png)
You may also like

.png)

.jpeg)