!["[Stellar Strategies] Inside Bar with Signals" logo](https://cdn.ctrader.com/image/webp/fd23595d-31fc-4e82-b008-3d94200f3c77_13031)
!["[Stellar Strategies] Inside Bar with Signals" uploaded image](https://cdn.ctrader.com/373b6262-5279-4ace-b1e5-f319c47c1ae9_cT_cs_4141285_EURUSD_2025-07-15_13-15-32.png)
!["[Stellar Strategies] Inside Bar with Signals" uploaded image](https://cdn.ctrader.com/e291a657-7cf8-43d3-814b-2a6abc01ff69_cT_cs_4141285_ETHUSD_2025-07-15_13-08-50.png)
!["[Stellar Strategies] Inside Bar with Signals" uploaded image](https://cdn.ctrader.com/d9e0fcc8-1d9c-4359-8452-c6f08472f01b_cT_cs_4141285_SpotCrude_2025-07-15_13-13-35.png)
!["[Stellar Strategies] Inside Bar with Signals" uploaded image](https://cdn.ctrader.com/d8a3216e-390e-46dc-8f8e-7ec108647089_cT_cs_4141285_AUS200_2025-07-15_13-14-12.png)
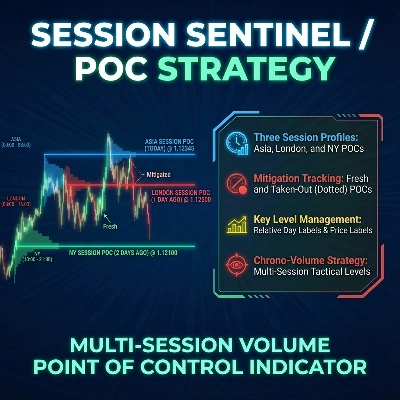
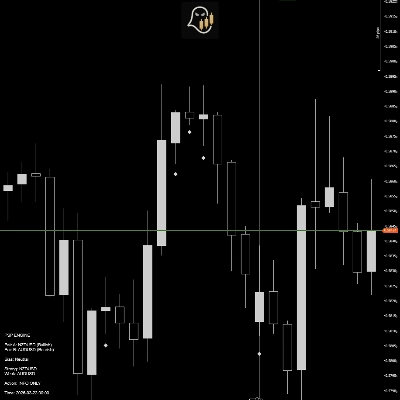
The Inside Bar Strategy indicator is a professional-grade tool designed to help traders identify and act on one of the most reliable price action patterns: the inside bar. This powerful pattern signifies market consolidation and often precedes a significant breakout. However, spotting these setups and their valid breakouts in real-time can be challenging.
This indicator solves that problem by automatically highlighting the pattern directly on your chart, keeping it clean and easy to read. It colors the "Mother Bar" and the smaller "Inside Bar" for instant recognition. More importantly, it provides clear, actionable breakout signals with arrows, showing you exactly when the price has closed decisively outside the consolidation range.
With fully customizable visual settings—from colors to line styles and breakout signal visibility—you can tailor the indicator to perfectly match your trading style and chart theme. Stop manually searching for inside bars and start trading them with confidence and precision.
How to Use It
Operating the indicator is intuitive and designed to integrate seamlessly into your analysis.
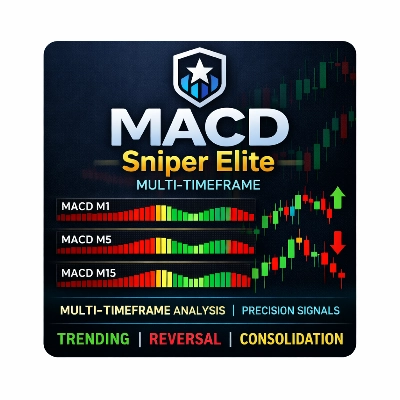
- Pattern Identification:
- Mother Bar (Gray): The indicator will automatically color the initial large candle of the pattern
DimGray. - Inside Bar (Gold): The smaller candle that forms entirely within the high-low range of the Mother Bar will be colored
Gold. - Breakout Lines (Dotted): The indicator draws dotted lines at the high and low of the Mother Bar. These are your key levels to watch for a breakout.
- Mother Bar (Gray): The indicator will automatically color the initial large candle of the pattern
- Trade Signals:
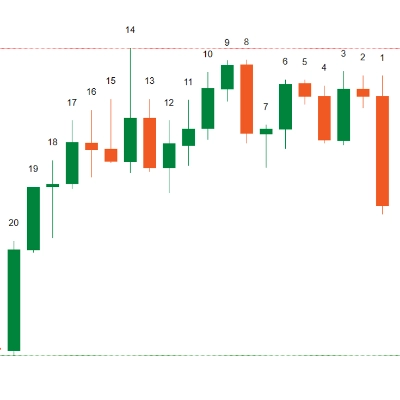
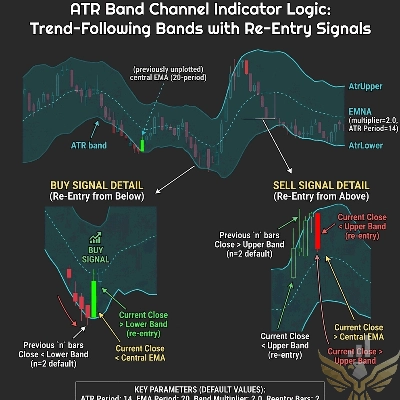
- Buy Signal (Blue Up Arrow): An up arrow will appear below the candle that closes above the high of the gray Mother Bar. This confirms a bullish breakout.
- Sell Signal (Red Down Arrow): A down arrow will appear above the candle that closes below the low of the gray Mother Bar. This confirms a bearish breakout.
- No Arrow: If an inside bar pattern forms but the next candle does not close outside the Mother Bar's range, no arrow will be printed. This acts as a filter to prevent trading on weak or failed breakouts.
Conclusion
The Inside Bar Strategy indicator is more than just a visual aid; it's a complete solution for traders who rely on this powerful price action pattern. By automating detection and providing clear, confirmed breakout signals, it allows you to focus on your strategy, risk management, and execution. Enhance your trading consistency and never miss a high-probability inside bar setup again.
For more trading tools, visit StellarStrategies.ee
................................................................................................................................................................................................................
This indicator is a tool for technical analysis and should not be considered financial advice. All trading involves substantial risk, and past performance is not indicative of future results. The user is solely responsible for any trading decisions made based on the signals provided by this tool. Always use proper risk management and trade responsibly.
!["[Stellar Strategies] Market Structure Breakout" logo](https://cdn.ctrader.com/image/webp/6a54cc40-937c-432d-b3b0-94fc513ab761_10485)
!["[Stellar Strategies] MARSI Signal Plotter" logo](https://cdn.ctrader.com/image/webp/a45f8c82-dbc3-4037-8393-64e13bc126d6_7146)
!["[Stellar Strategies] BOS Trend 1.0" logo](https://cdn.ctrader.com/image/webp/81af1ef4-6dc5-49eb-ba1f-910a5cbe37b1_7301)
!["[Stellar Strategies] Market Session Ultimate" logo](https://cdn.ctrader.com/image/webp/739f94c3-de9a-4efd-a6bd-082395a07007_10209)
!["[Stellar Strategies] Linear Regression Candles 1.1" logo](https://cdn.ctrader.com/image/webp/06fd1c1d-12d6-4f0b-935b-a084378ba579_9867)
!["[Stellar Strategies] Smart ADX" logo](https://cdn.ctrader.com/image/webp/0f56edb0-bc19-4b83-8b20-d52746d2da18_19782)
!["[Stellar Strategies] Wave Trend Pro" logo](https://cdn.ctrader.com/image/webp/b4fd7869-8f3b-4f76-8f31-4af8a692870c_10648)
!["[Stellar Strategies] VBO" logo](https://cdn.ctrader.com/image/webp/697949d1-3243-4348-aba1-50d2476abdb7_19796)
!["[StellarStrategies] Scheduled Trade Executor" logo](https://cdn.ctrader.com/image/webp/3b74553a-82be-4a56-932c-7f5edd546e1f_7243)
!["[Stellar Strategies] Candlestick Patterns Dashboard" logo](https://cdn.ctrader.com/image/webp/4a73eca2-4db2-4163-926e-8c8e4df7ee1f_21156)
!["[Stellar Strategies] QQE" logo](https://cdn.ctrader.com/image/webp/50604401-faf8-44f4-a0ff-0a39c7f846c4_9629)
!["[Stellar Strategies] Visual Trend Momentum" logo](https://cdn.ctrader.com/image/webp/bd45b0f1-5061-40be-9e9a-ec1055ca66e1_9441)