!["[Stellar Strategies] Ultimate Trend & Momentum Dashboard" logo](https://cdn.ctrader.com/image/webp/c8a3bd22-4251-4a97-afec-b441bf8a7110_12568)
!["[Stellar Strategies] Ultimate Trend & Momentum Dashboard" uploaded image](https://cdn.ctrader.com/c25e60a6-17e6-44b5-98e1-24b5cf6496a5_cT_cs_4141285_XAUUSD_2025-06-24_17-30-13.png)
!["[Stellar Strategies] Ultimate Trend & Momentum Dashboard" uploaded image](https://cdn.ctrader.com/5e3b4fcb-ae59-49b8-a9b0-81b96afb9492_cT_cs_4141285_T.US_2025-06-24_17-27-38.png)
!["[Stellar Strategies] Ultimate Trend & Momentum Dashboard" uploaded image](https://cdn.ctrader.com/d74468f3-92fc-4c6e-95ea-1090a6ae5d4e_cT_cs_4141285_NAS100_2025-06-24_17-12-20.png)
!["[Stellar Strategies] Ultimate Trend & Momentum Dashboard" uploaded image](https://cdn.ctrader.com/19d82523-f4a7-42dd-9774-4edf64a08433_cT_cs_4141285_GER40_2025-06-24_17-11-40.png)
!["[Stellar Strategies] Ultimate Trend & Momentum Dashboard" uploaded image](https://cdn.ctrader.com/b1de090d-6052-4c09-895d-021875631643_cTrader_gIkWGPxcTJ.png)
!["[Stellar Strategies] Ultimate Trend & Momentum Dashboard" uploaded image](https://cdn.ctrader.com/69e45ebc-b90e-4a7a-82de-f17f3f7ff6c1_cTrader_rv2JwfLzX9.png)
Ultimate Trend & Momentum Indicator: User Guide
1. Overview: What is it?
The "Ultimate Trend & Momentum" is a comprehensive cTrader indicator designed to give you a quick, at-a-glance understanding of market sentiment across multiple timeframes. Instead of cluttering your chart with dozens of separate indicators, it consolidates the signals from five popular technical indicators into a single, easy-to-read dashboard.
The core purpose is to generate a consensus signal—either Buy, Sell, or Neutral—based on the combined readings of these indicators on timeframes you select (from M15 up to D1). This helps you gauge the overall strength and direction of a trend with greater confidence.
2. The Dashboard Explained
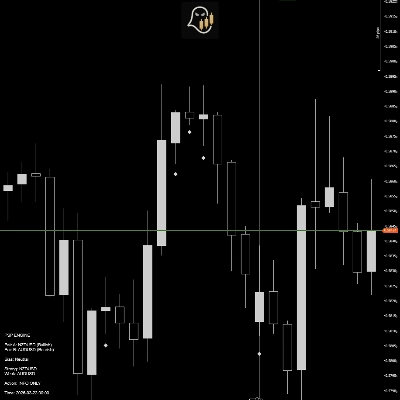
The indicator displays all its information in a text block at the top-left of your chart. This block is divided into two main parts.
Part A: The Multi-Timeframe Breakdown
This is the main body of the dashboard. Each line represents a specific timeframe (e.g., H1, H4) that you have enabled in the settings. For each timeframe, it shows the individual signal from each enabled indicator.
5 | 100 % | |
4 | 0 % | |
3 | 0 % | |
2 | 0 % | |
1 | 0 % |
!["[Stellar Strategies] Market Structure Breakout" logo](https://cdn.ctrader.com/image/webp/6a54cc40-937c-432d-b3b0-94fc513ab761_10485)
!["[Stellar Strategies] MARSI Signal Plotter" logo](https://cdn.ctrader.com/image/webp/a45f8c82-dbc3-4037-8393-64e13bc126d6_7146)
!["[Stellar Strategies] BOS Trend 1.0" logo](https://cdn.ctrader.com/image/webp/81af1ef4-6dc5-49eb-ba1f-910a5cbe37b1_7301)
!["[Stellar Strategies] Market Session Ultimate" logo](https://cdn.ctrader.com/image/webp/739f94c3-de9a-4efd-a6bd-082395a07007_10209)
!["[Stellar Strategies] Linear Regression Candles 1.1" logo](https://cdn.ctrader.com/image/webp/06fd1c1d-12d6-4f0b-935b-a084378ba579_9867)
!["[Stellar Strategies] Inside Bar with Signals" logo](https://cdn.ctrader.com/image/webp/fd23595d-31fc-4e82-b008-3d94200f3c77_13031)
!["[Stellar Strategies] Wave Trend Pro" logo](https://cdn.ctrader.com/image/webp/b4fd7869-8f3b-4f76-8f31-4af8a692870c_10648)
!["[Stellar Strategies] Smart ADX" logo](https://cdn.ctrader.com/image/webp/0f56edb0-bc19-4b83-8b20-d52746d2da18_19782)
!["[StellarStrategies] Scheduled Trade Executor" logo](https://cdn.ctrader.com/image/webp/3b74553a-82be-4a56-932c-7f5edd546e1f_7243)
!["[Stellar Strategies] VBO" logo](https://cdn.ctrader.com/image/webp/697949d1-3243-4348-aba1-50d2476abdb7_19796)
!["[Stellar Strategies] QQE" logo](https://cdn.ctrader.com/image/webp/50604401-faf8-44f4-a0ff-0a39c7f846c4_9629)
!["[Stellar Strategies] Candlestick Patterns Dashboard" logo](https://cdn.ctrader.com/image/webp/4a73eca2-4db2-4163-926e-8c8e4df7ee1f_21156)