Indicator
NAS100
Indices
XAUUSD
Commodities
Forex
EURUSD
Crypto
PrevDayProjection
"PrevDayProjection" logo
23/09/2025
37
Desktop
Since 08/08/2025
Sales
4
Free installs
396
"PrevDayProjection" uploaded image"PrevDayProjection" uploaded image

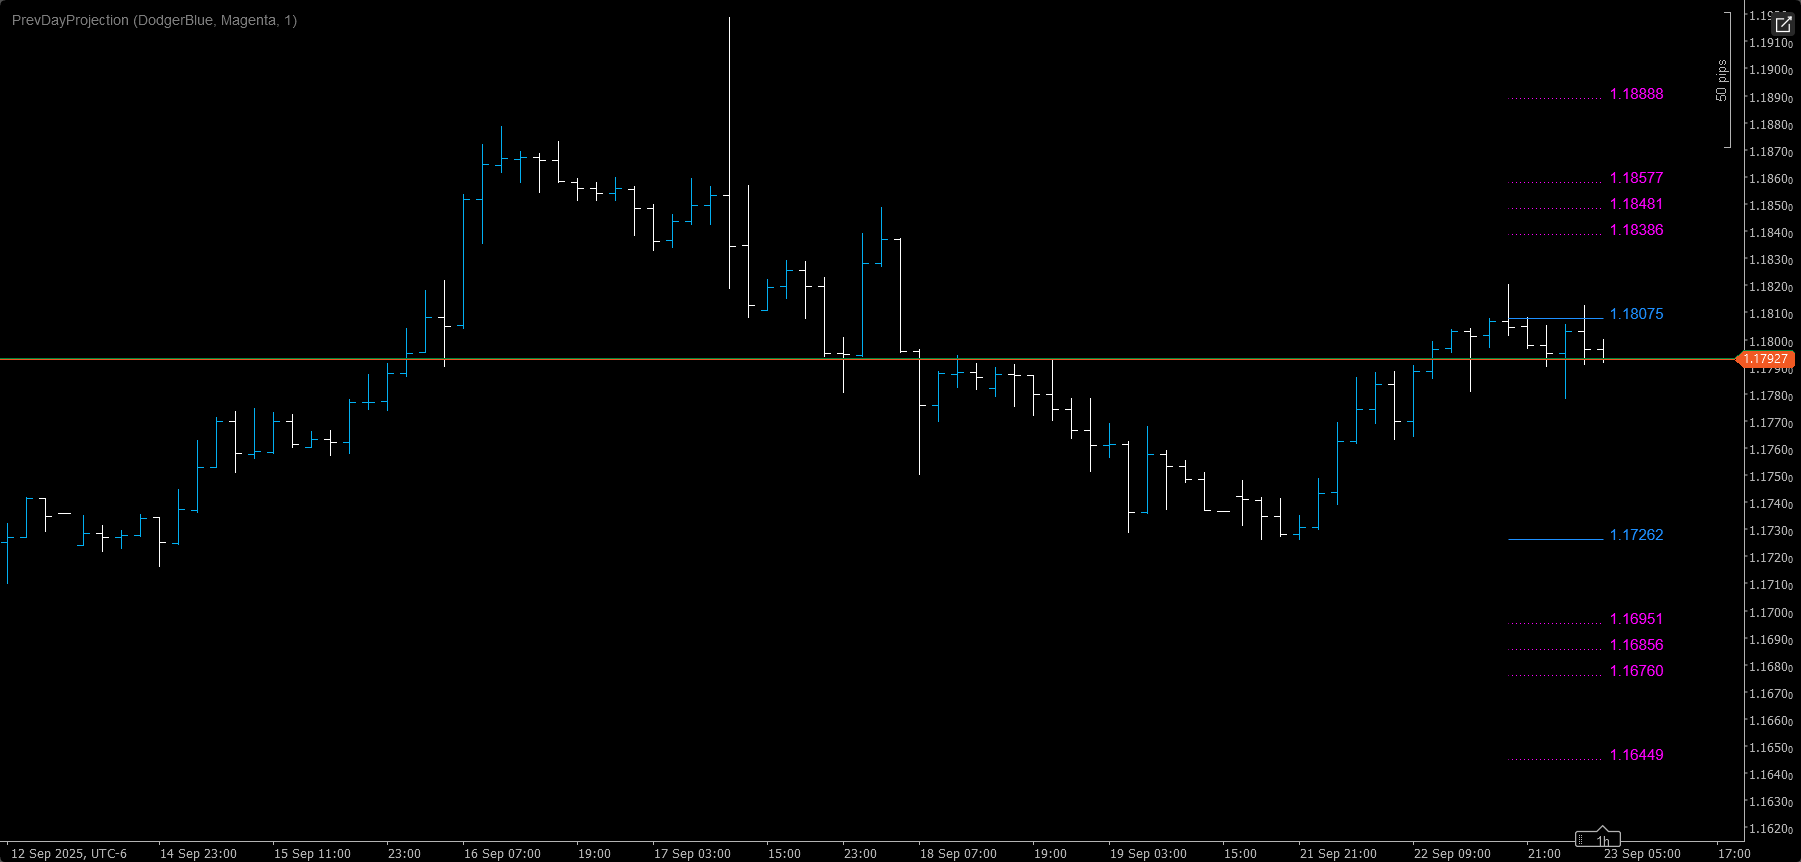
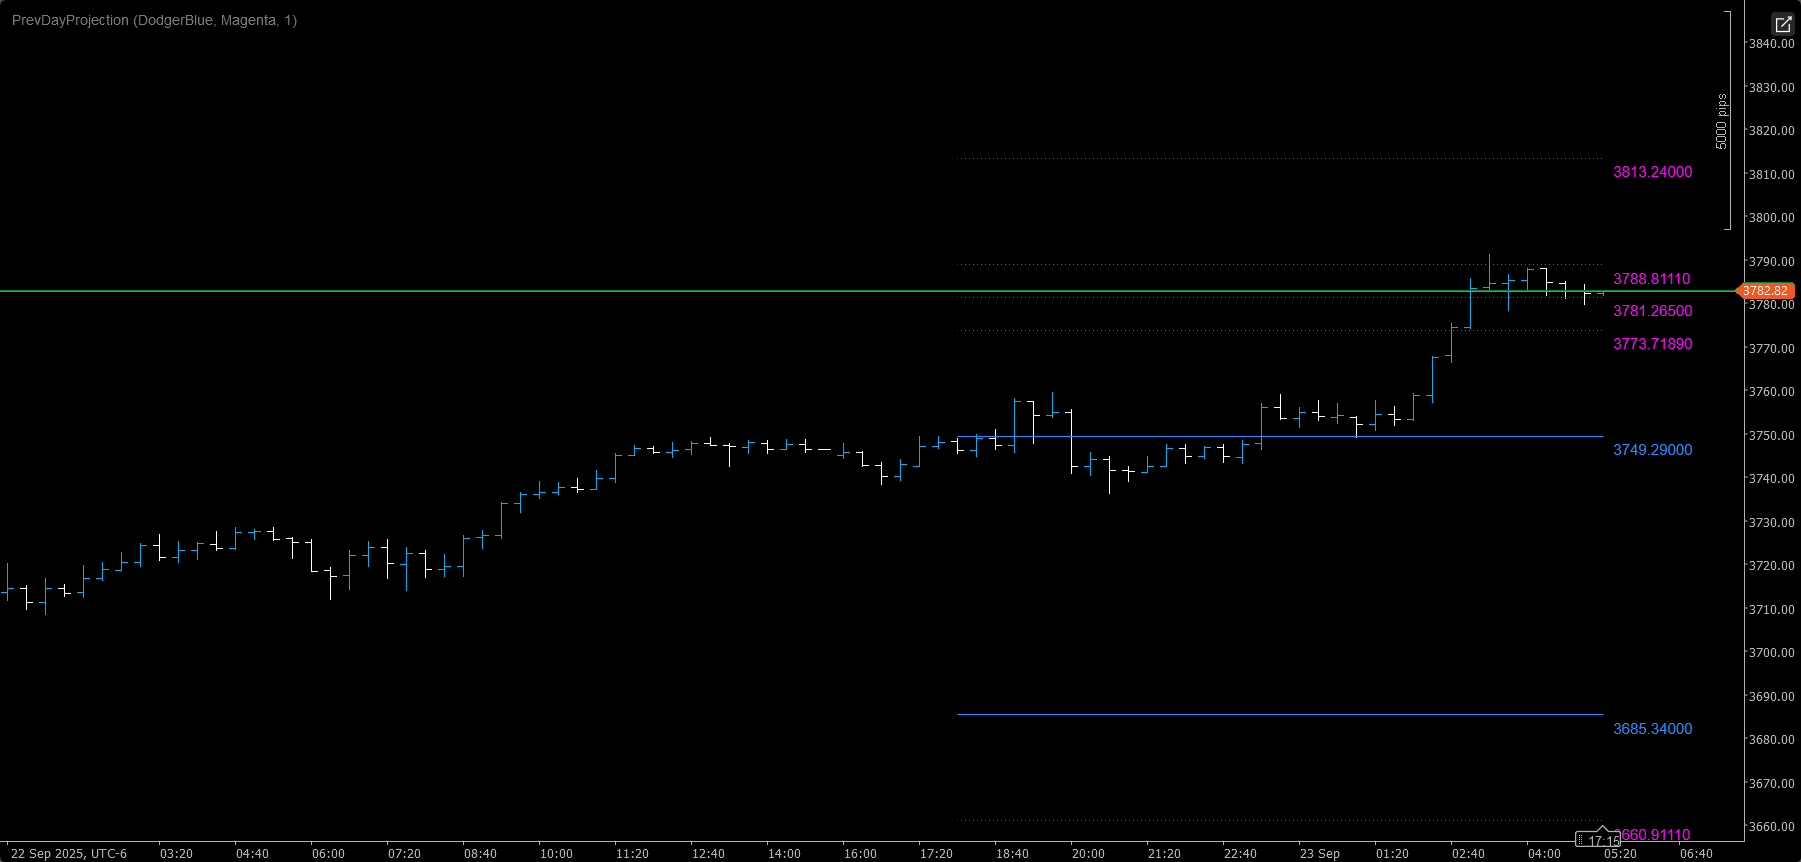
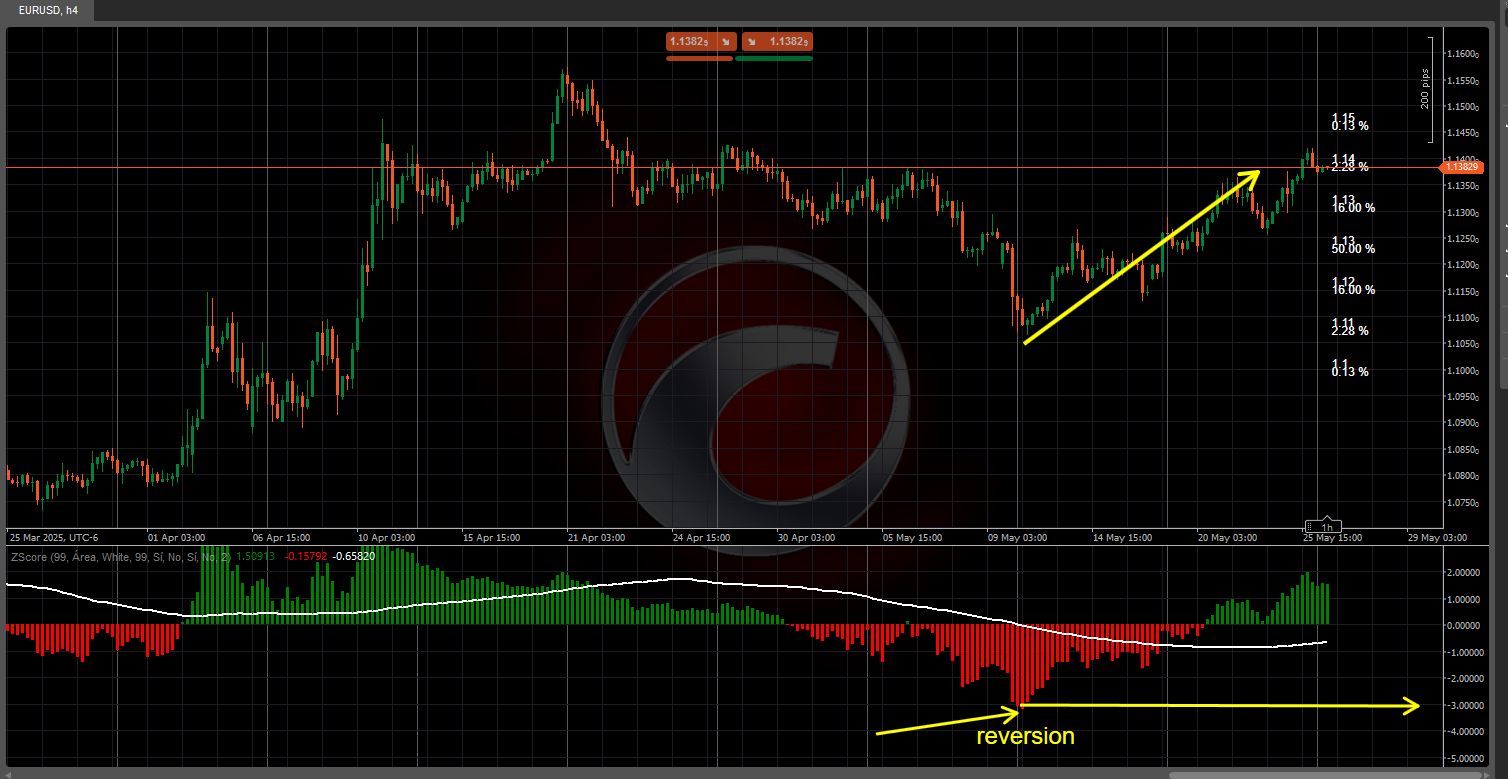
Previous Day Projection Levels

Unlock precision trading with dynamic Fibonacci projections based on yesterday’s price action.

This indicator automatically calculates the previous day’s high and low, determines the range, and then projects Fibonacci levels both above and below that range — giving you instant reference points for potential support, resistance, and breakout zones.

Key Features

  • 📅 Automatic Previous Day High & Low detection
  • 📏 Range-based Fibonacci projections at 38.2%, 50%, 61.8%, and 100% levels
  • 🔼 Above previous high: Four Fibonacci levels for bullish continuation targets
  • 🔽 Below previous low: Four Fibonacci levels for bearish continuation targets
  • 🎯 Segment-only lines starting from today’s first bar — no clutter across the chart
  • 🏷 Price labels at the right edge for quick, at-a-glance reference
  • 🎨 Customizable colors and line thickness to match your chart style

Why Traders Love It

  • Clear intraday roadmap: Know exactly where key levels are before the session starts.
  • Dual-direction analysis: Plan for both upside and downside moves.
  • Time-saving automation: No manual drawing or recalculation needed.
  • Works on any timeframe: From scalping to swing trading.

Perfect For

  • Day traders looking for precise breakout targets
  • Swing traders identifying key retracement zones
  • Anyone who uses Fibonacci levels as part of their strategy


💡 Tip: Combine this indicator with your favorite momentum or volume tools to confirm entries and exits around these projected levels.

0.0
Reviews: 0
Customer reviews
No reviews for this product yet. Already tried it? Be the first to tell others!
More from this author
FVG
The Indicator is a powerful tool for price-action traders seeking to identify and exploit short-term imbalances.
Indicator
Indices
Prop
Stocks
+3
Smooth Heiken Ashi
The Smooth Heiken Ashi indicator is a refined charting tool designed to filter out market noise and highlight true price
Indicator
Grid
NAS100
XAUUSD
+6
AutoFibRetracement
A powerful overlay tool designed to automatically plot Fibonacci retracement levels based on a custom window.
Indicator
Indices
Prop
Stocks
+3
Fractals
Fractals is a precision-engineered trading indicator for cTrader that reveals the hidden architecture of price action.
pATR
An indicator that redefines ATR by applying a percentile-based filter giving traders a grounded view of volatility.
Indicator
Indices
Breakout
Prop
+8
MarketRegimeAI
A cutting‑edge trading indicator that fuses AI and mathematics with adaptive logic to classify market regimes.
Indicator
Breakout
AI
Scalping
KaufmanEfficiencyRatio
A precision tool for measuring how efficiently price moves from point A to B.
Indicator
NAS100
Indices
XAUUSD
+7
InstitutionalSignalOscillator
A precision-engineered indicator designed for traders who demand signal integrity across volatile markets.
Indicator
Indices
Commodities
Stocks
+2
MARainbow
MARainbow gives you the edge with four customizable moving averages—each color-coded for instant recognition.
cBot
NAS100
Indices
XAUUSD
+4
VolatilityScalper
A trading robot designed for traders who want precision for high-volatility markets (XAUUSD, US500, US100, WTI, others.)
DEnvelopSystem
DEnvelop is a high-performance trading indicator engineered for scalpers and intraday strategists who demand precision.
Indicator
Indices
Prop
Commodities
+3
OBScope
A cutting-edge indicator designed to detect and visualize high-probability zones based on swing highs, swing lows.
cBot
XAUUSD
Breakout
ORB2
A high-performance cBot engineered to capture explosive moves in the gold market using the proven Opening Range Breakout
Indicator
Indices
Prop
Breakout
+3
RVI
A precision-crafted indicator that compares current volume to its historical average for the same time of day.
Indicator
Indices
XAUUSD
Breakout
+3
AnchoredVWAP
A precision overlay tool that combines session-aware VWAP logic and standard deviations.
You may also like
Rsi buy Sell Signal
Instant‑setup RSI scalper—designed for turbulent markets.
Indicator
Forex
Crypto
VegaXLR - Bar Close Alert Manager
Bar Close Alert Manager provides real-time alerts for bar closures with customizable notifications and automation.
VegaXLR - ZigZag Alerts
cTrader ZigZag Alerts: Precision Swing Detection, Alerts, and Fibonacci.
DMI 3 bar v2
Shows BUY & SELL signals for 3 & 4 BAR PATTERN (Morning star/ Evening star). It is adjustable and it will SHOW ARROWS.
Indicator
Indices
Commodities
Forex
Smart Floating Risk - Premium version
The Floating Risk Indicator is an essential tool for traders who prioritize risk management.
Fury Team E_M_A_su_TF
EMA ON TF (MULTI-TIMEFRAME)
KANDIKA HEAT MAP
Color-Based Market Pressure & Volatility Visualizer The Kandika Heatmap Indicator
Indicator
RSI
XAUUSD
Breakout
+4
ZScore Reversion
Z-Score: Measures price deviations from its mean. Spots overbought/sold (±2-3 SD) & reversals. Key for stats trading
FX Market Sessions
Easily visualise Forex sessions with start/end markers and high/low levels for Sydney, Tokyo, London, and New York.
Indicator
Signal
MACD
USDJPY
PulseTracker
Version 1.2: Advanced Trend Detection & Visualization System
Indicator
Indices
RSI
Signal
[Stellar Strategies] MARSI Signal Plotter
🚀📈 Plot buy/sell signals on Range Bars using Moving Averages and RSI. Clear, actionable trading insights.🚀📈
Indicator
Indices
RSI
Commodities
+1
OrderPrice-V3
A straightforward yet effective tool signals entry points for both buying and selling. Include 3 Moving Average
Bollinger Bands Breakout Oscillator (+ Alerts)
BB Breakout Oscillator with alerts! Spot trend reversals using Bollinger Bands. Bullish/Bearish crossovers Alerts.
Indicator
NAS100
NZDUSD
XAUUSD
+11
Market Info bY MohammadKHR
Daily High & Low with live Percentage change.
Indicator
Indices
RSI
XAUUSD
+7
RSI Divergence
Detects bullish and bearish divergences
KAMA
Custom KAMA Indicator – Optimized for Speed and Precision
zh-cn Variety Period time panel(multilanguage)
This indicator can be used to: change color, shape size, position, change font, increase or decrease, and other function
Indicator
Indices
Prop
Stocks
+5
New Way Sar - Free
The Parabolic SAR, or "Stop and Reverse," is a dynamic technical analysis tool