Indicator
forex
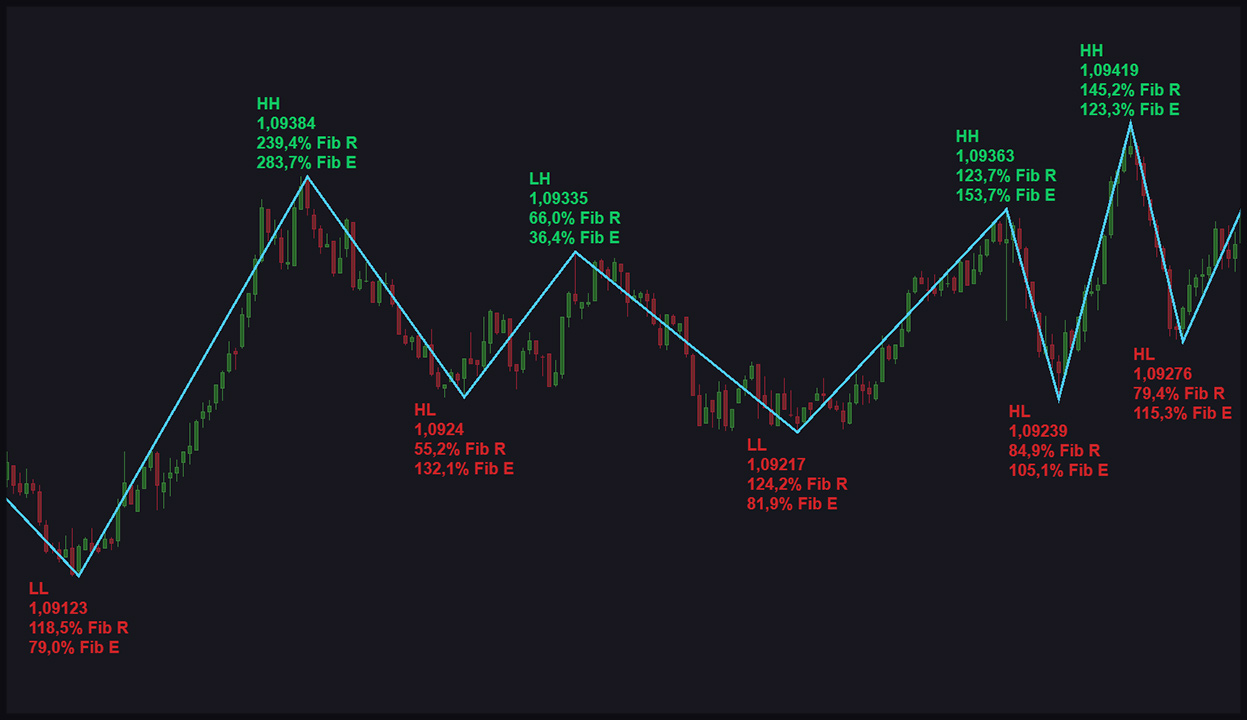
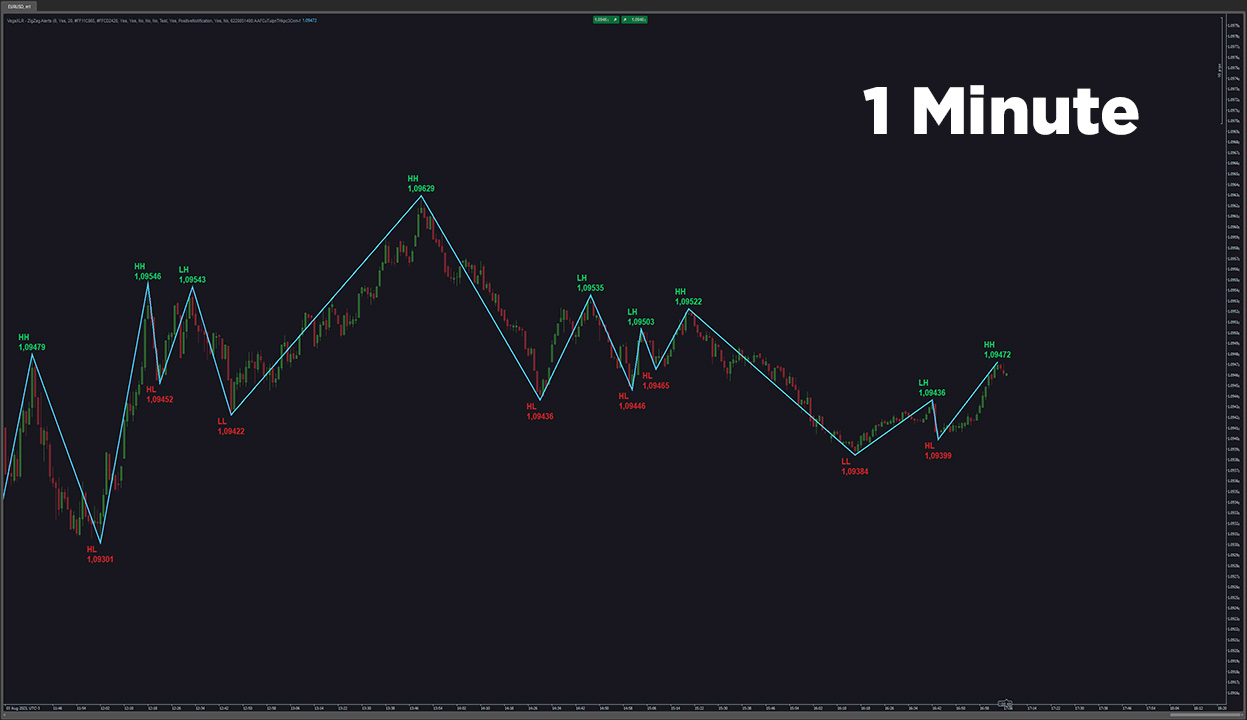
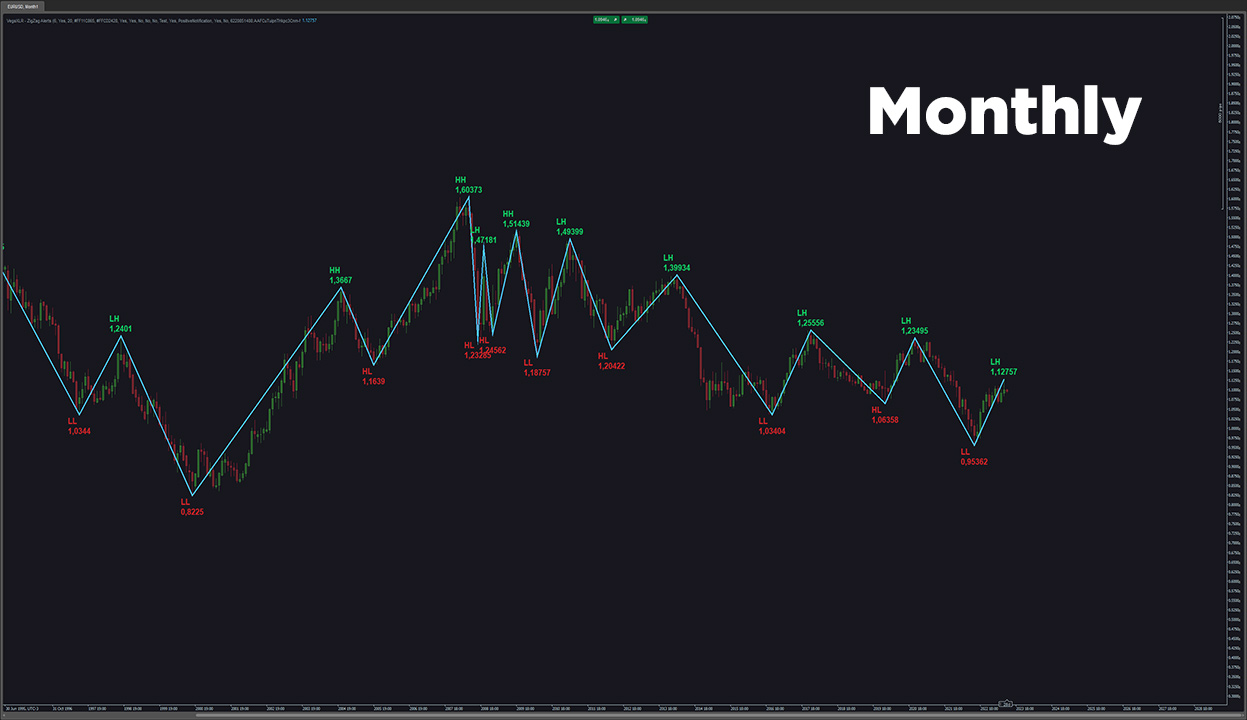
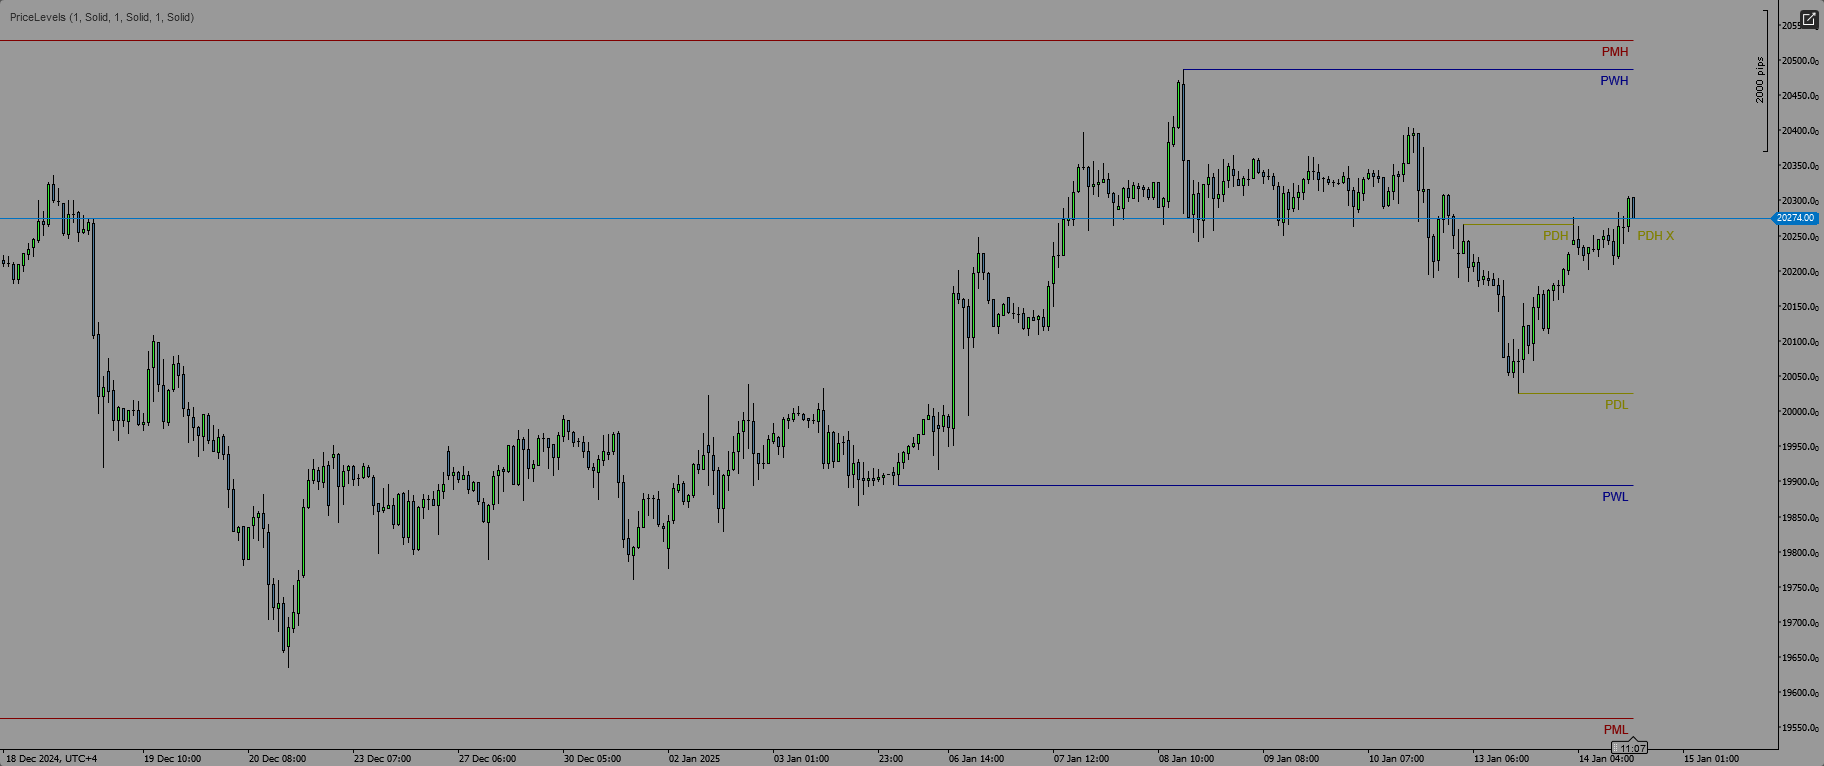
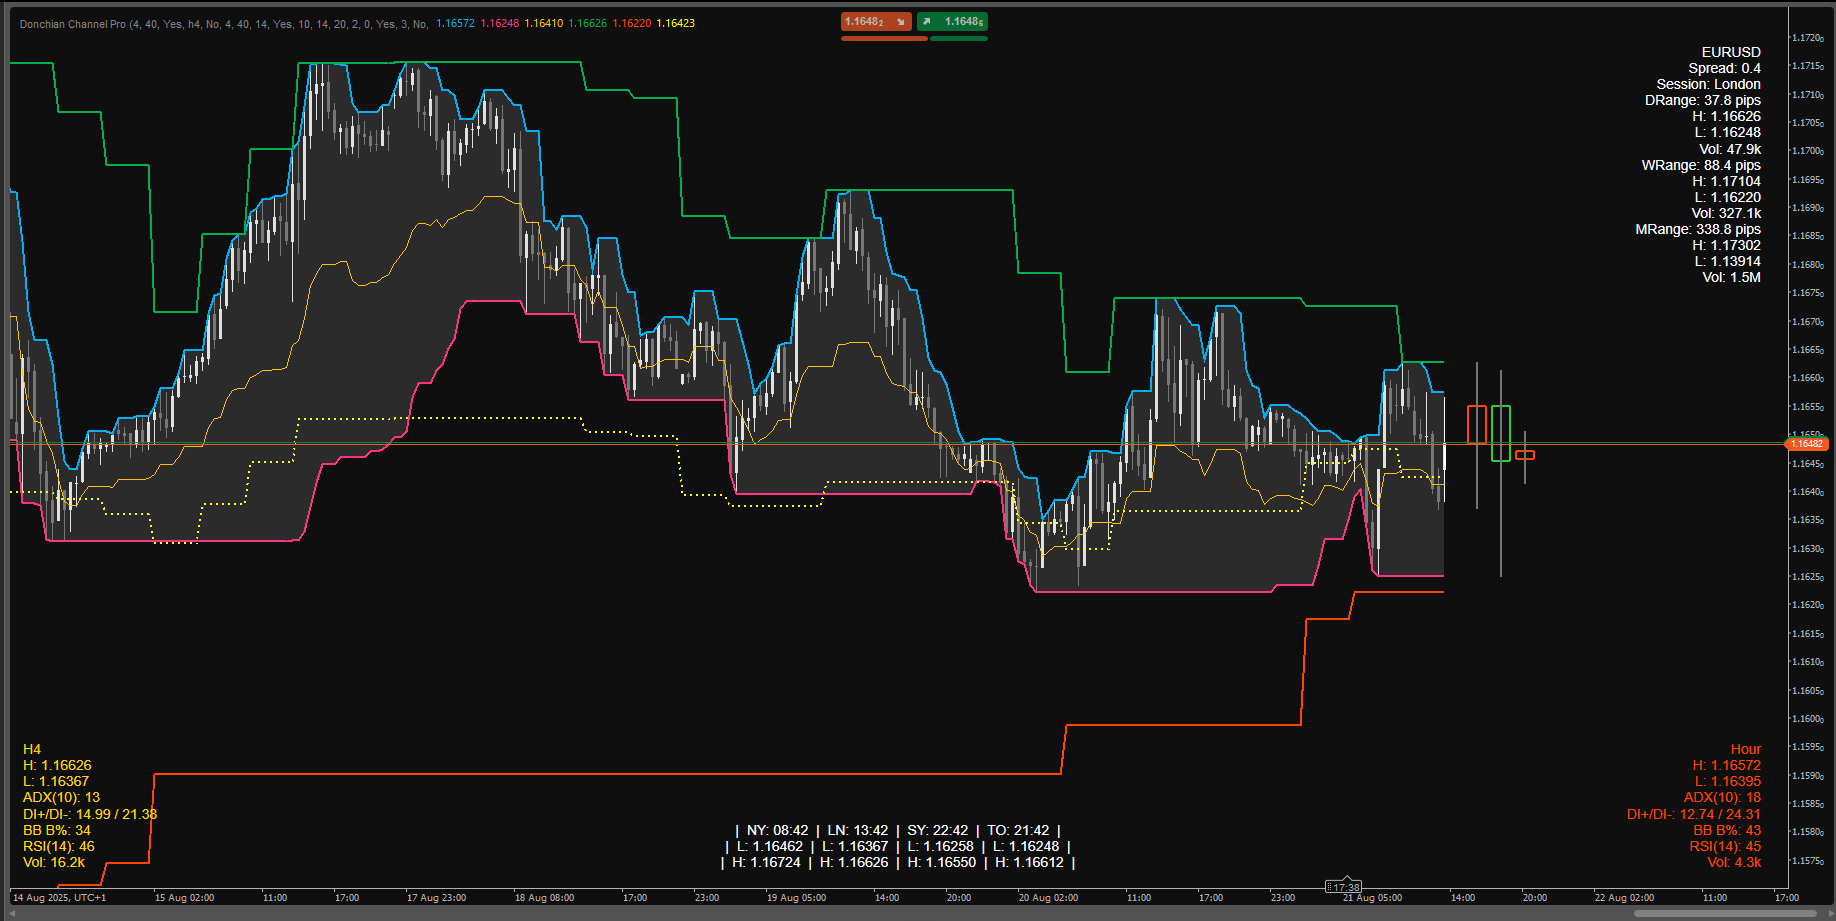
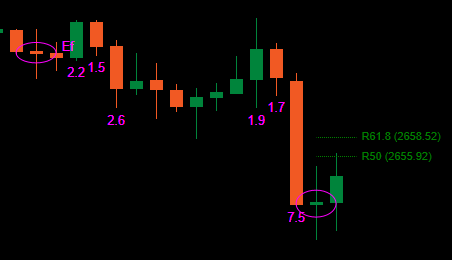
The cTrader ZigZag Alerts indicator helps you track price swings by plotting Higher Highs, Higher Lows, Lower Lows, and more. It also calculates Fibonacci retracements and expansions by comparing swings. The ZigZag line stays consistent across all symbols, timeframes, and price ranges for reliable analysis.
Key Features:
- Adjustable Sensitivity: Customize how the indicator detects swings based on market conditions.
- Label Options: Choose between abbreviated or full labels for clear visualization.
- Font & Color Customization: Modify text size and define bullish/bearish colors for better readability.
- Swing Labels & Prices: Display swing labels with corresponding prices for better insights.
- Fibonacci Levels: View Fibonacci retracement and expansion levels for improved entry and exit points.
- Alert Management: Pause all alerts instantly when needed.
- Custom Comments: Add comments that appear in alerts for easy identification.
- Multiple Alert Options: Receive alerts via sound, pop-ups, Telegram, or email.
- Swing-Specific Alerts: Get alerts for selected swing types and pause alerts for a set time.
- Fibonacci Alerts: Stay informed with alerts on Fibonacci retracements and expansions.
- Consistent ZigZag Line: Unlike other indicators, this maintains uniform swing detection across all timeframes and price ranges.
- User Guide: You can quickly access the user guide through a button on the chart.
cTrader ZigZag Alerts provides precise swing detection and alert customization, helping traders make informed decisions with confidence.
More from this author

Indicator
breakout
VegaXLR - Fixed Range Volume Profile
Identify key support and resistance levels through detailed volume distribution analysis.

Indicator
forex
VegaXLR - Chart Patterns Alerts
Enhance your trading strategy with automated detection and alerts for key chart patterns.
Indicator
forex
VegaXLR - Moving Average Alerts
A powerful cTrader indicator with customizable Moving Average alerts, notifications, and automated trading actions.
cBot
forex
VegaXLR - Risk Manager
Automate lot sizing with cTrader Risk Manager cBot for precise risk management in pending and market orders.
Indicator
forex
VegaXLR - Candlestick Patterns Alerts
Real-Time Candlestick Pattern Detection with Custom Alerts & Trend Analysis for cTrader
Indicator
forex
VegaXLR - cTrader Multi-Timeframe Pivot Pro
Customizable multi-timeframe pivot point indicator for cTrader with alerts, Fibonacci, CPR, and more!
Indicator
rsi
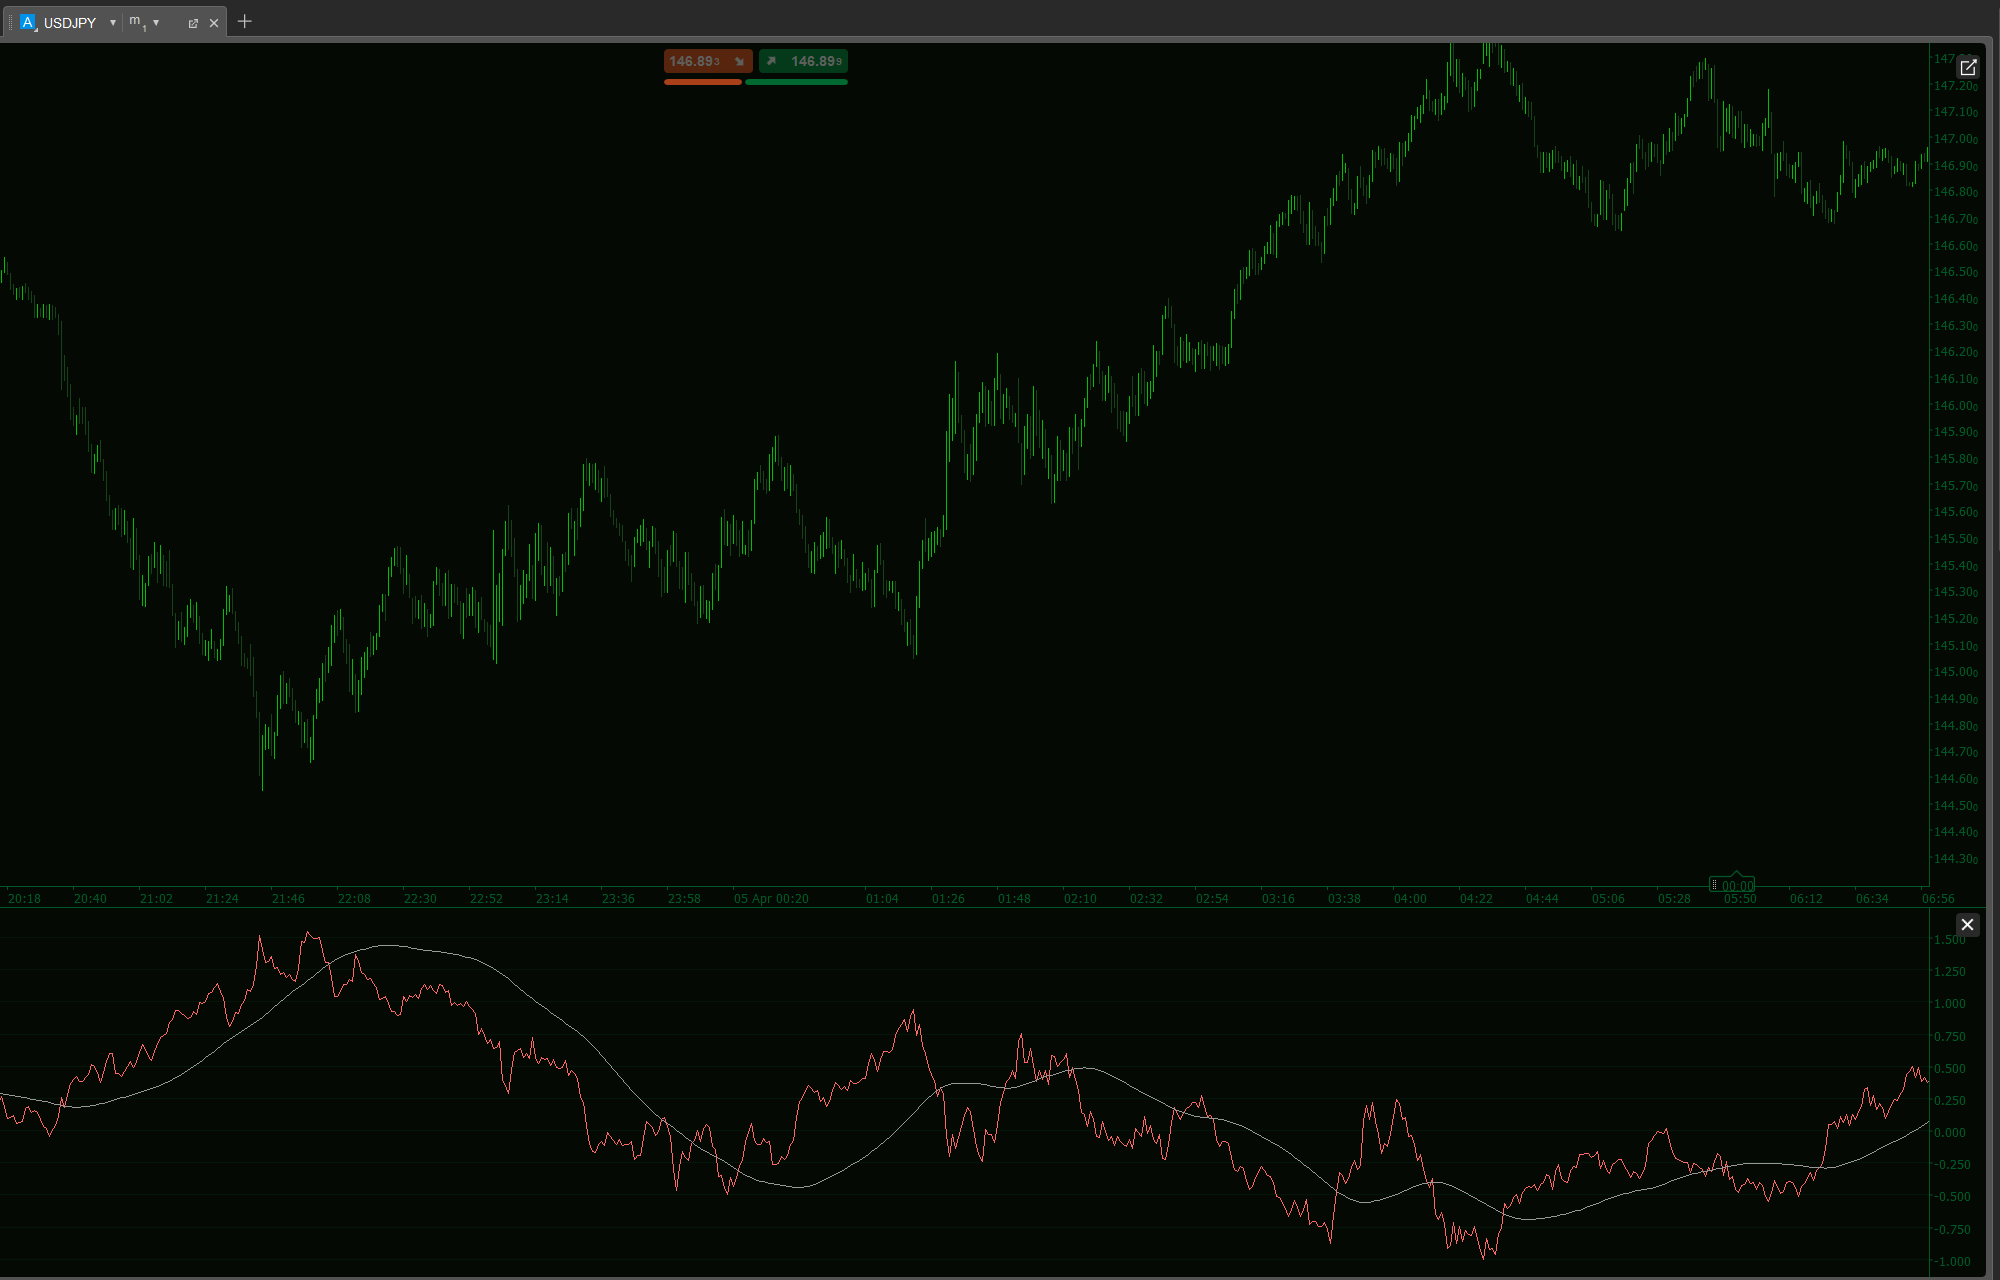
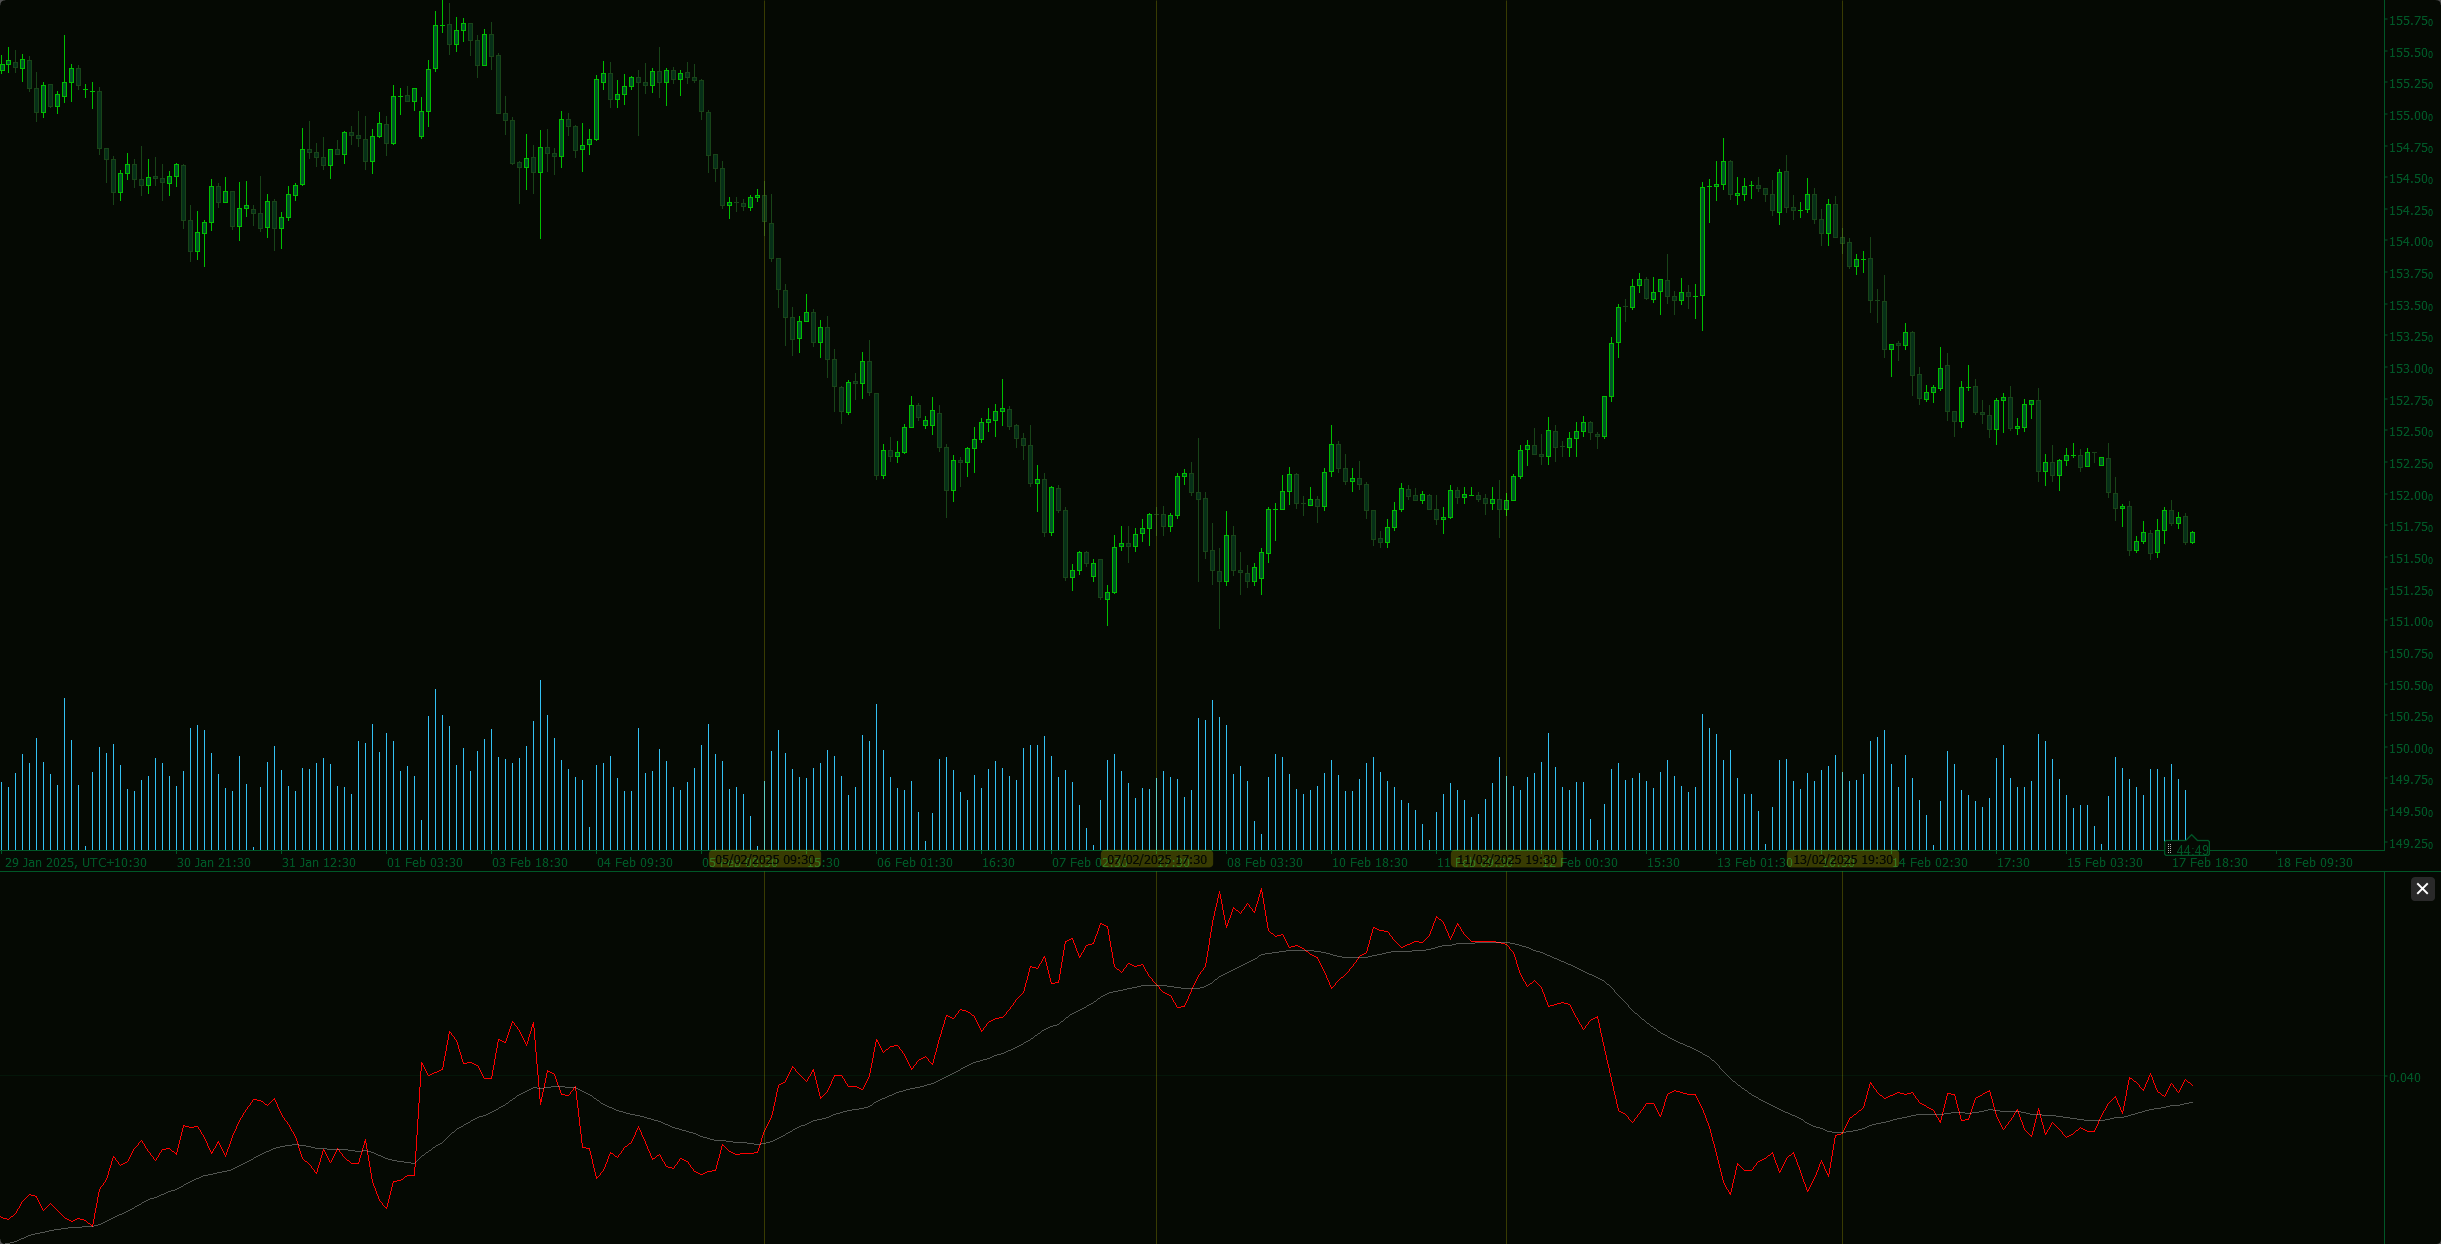
VegaXLR - RSI and StochRSI Alerts
VegaXLR's cTrader StochRSI identifies overbought/oversold RSI levels for precise trade entries.
Indicator
forex
VegaXLR - Auto Support and Resistance
cTrader Auto Support & Resistance detects key levels with Fibonacci analysis and sends real-time trading alerts.
cBot
forex
VegaXLR - Fibonacci Trading cBot
Automate Fibonacci trading with this cTrader cBot—advanced risk management, alerts, and seamless order execution.
Indicator
forex
VegaXLR - cTrader Pitchfork & Channel Enhancer
Enhance Pitchfork & Price Channels in cTrader with customizable Equidistant and Fibonacci levels.
Indicator
forex
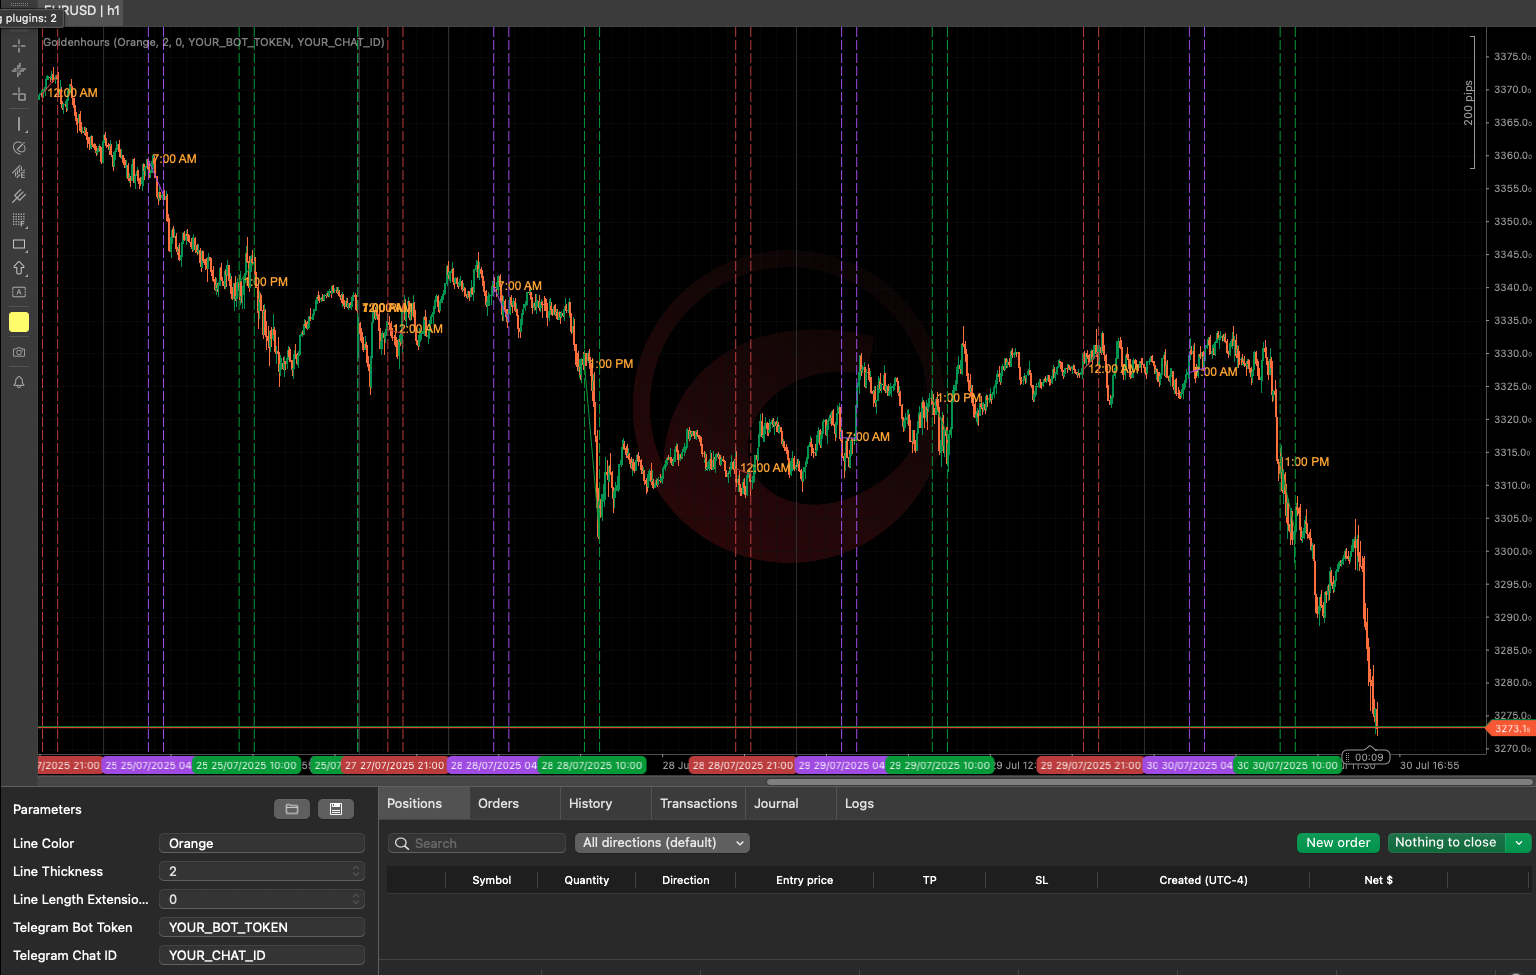
VegaXLR - Market Sessions Alerts
The cTrader Market Sessions Alerts Indicator marks global sessions, highlights key levels, and sends real-time alerts.
Indicator
forex
VegaXLR - Candlestick Patterns Pro
Identify 34 candlestick patterns, track trends across timeframes, and get instant alerts with this powerful trading tool

cBot
forex
VegaXLR - Trendline Trading cBot
This is a cBot that will detect trendlines on the chart and open trades when the price interacts with them.

cBot
rsi
VegaXLR - cTrader Account Protector
This is an advanced tool designed to protect your trading account by managing drawdown and run-up levels.
You may also like
Indicator
breakout
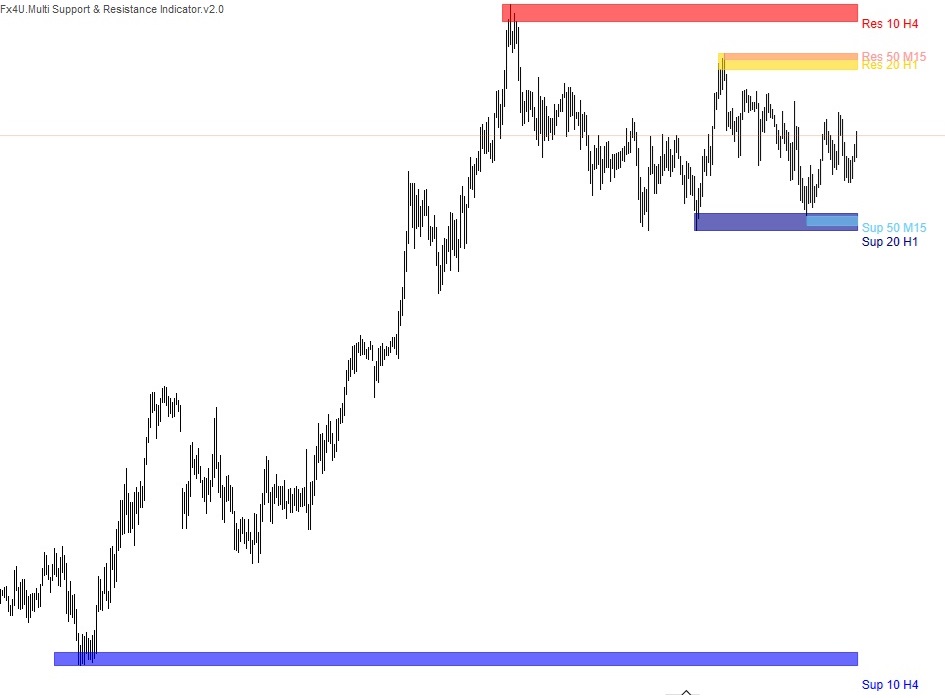
Fx4U.Multi TimeFrame Support & Resistance
Allow trader to visualize Support & Resistance across different timeframes,give trader an overview of the current market


.png)
Indicator
signal
Trend-reversal-indicator for cTrader
🔹 Trend-Reversal-Indicator for cTrader 🔹 The ultimate Renko chart tool!
!["[Hamster-Coder] Pivot Points (Demo)" logo](https://market-prod-23f4d22-e289.s3.amazonaws.com/6a1481e2-bd00-4037-bcf0-33495594f95a_Icon300.jpg)