MMXM Structure by Ludwig
"MMXM Structure by Ludwig" logo
21/08/2025
1
Desktop
SinceΒ 16/03/2025
Traded volume
17.81M
Pips won
59.92K
Sales
23
Free installs
423

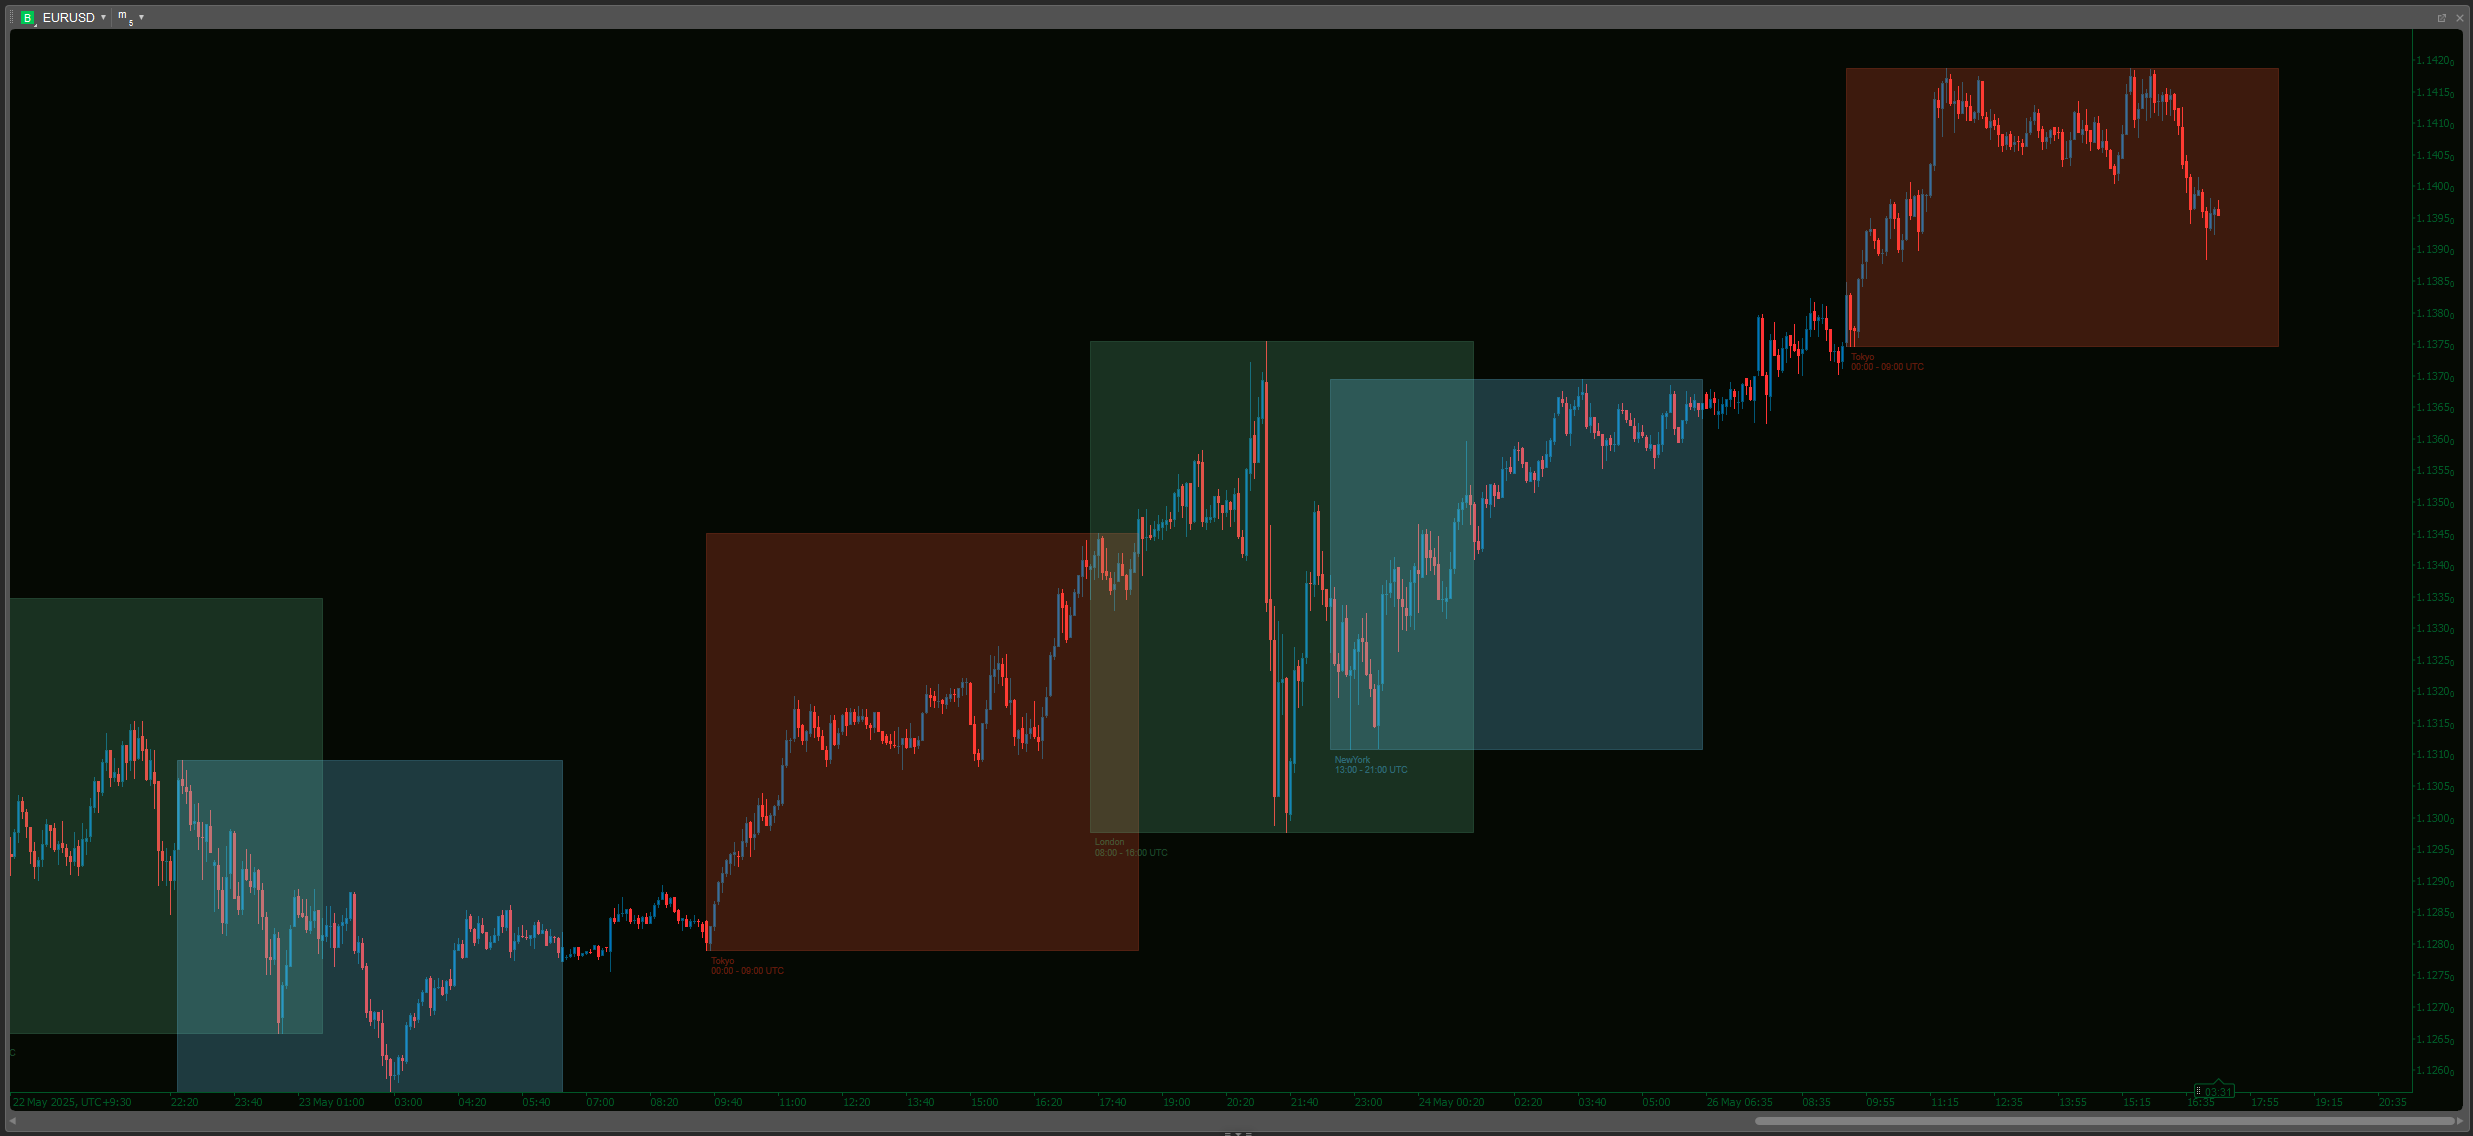
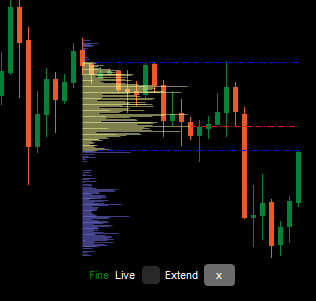
This MMXM Structure is essentially a market structure swing mapping tool that traders could use to identify sell setups (or buy setups) based on swing highs/lows and price extremes.

The MMXM Structure is an advanced price action analysis tool designed to map market structure and highlight potential trading opportunities with precision.
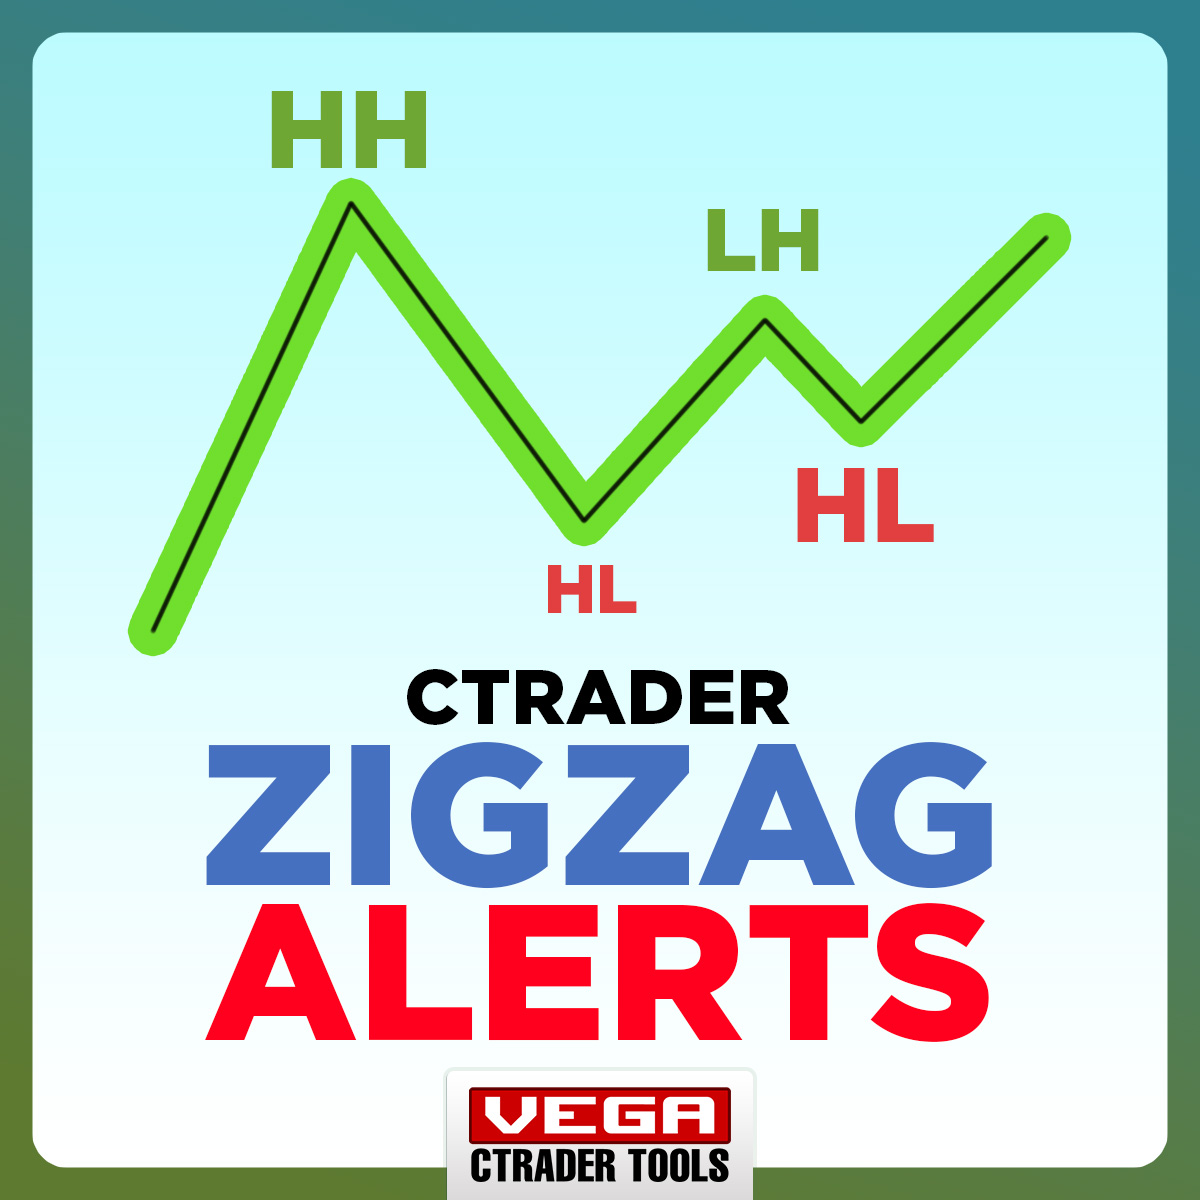
This indicator automatically detects and marks swing highs and swing lows over a configurable lookback period, connecting them with a ZigZag framework to make market direction and structural changes immediately visible.

For sell-side setups, the indicator emphasizes upper market extremities where price has reached significant resistance or exhaustion points. These are displayed in red, serving as potential short-entry reference levels. The tool also projects body envelope extremity lines, showing the maximum and minimum candle body reach within a swing, allowing traders to assess whether price is overextended before reversal.

Key Features:

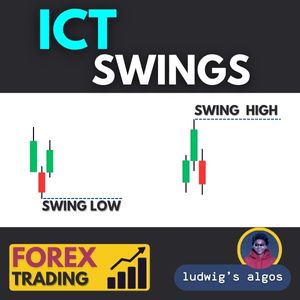
  • Automated Swing Detection: Identifies and marks pivot highs and lows without lagging repaint artifacts.
  • ZigZag Structure Visualization: Connects pivot points to make trend flow and structural breaks easy to read.
  • Upper Extremity Markers (Sell Focus): Highlights significant highs that may serve as supply zones or resistance.
  • Body Envelope Extremities: Plots dotted reference lines above and below swings to gauge price extension.
  • Extension Line Projection: Optionally extends the latest swing line to the current bar for live price tracking.
  • Labeling Option: Displays exact price levels at swing points for precision targeting.
  • Customizable Appearance: Adjustable colors, lengths, and display options for individual trading styles.

How to Use for Selling or Buying:

  1. Wait for an upper extremity marker (red) to form at a significant high or low.
  2. Confirm potential reversal with additional confluence (e.g., rejection candle, divergence, or key level).
  3. Use the extremity and ZigZag trend line as a resistance reference.
  4. Enter short or long positions with stops above the last swing high or low and targets set near the next swing low or high or structure break.


If you have any questions or run into any issues, feel free to contact me. I'm happy to help You!


Disclaimer:

By using my algorithms, you acknowledge that trading involves inherent risks and that past performance does not guarantee future results. It is essential that you have a solid risk management strategy in place and, above all, that you remain disciplined in adhering to stop-loss levels. Failure to manage risk properly can lead to significant losses. I am not responsible for any financial outcomes resulting from the use of these algorithms. Trade responsibly and always follow proper risk management practices.

Bless up! πŸ™Œ

More from this author
VALID Hi and Lo
ICT Valid High & Low Detector – Multi-Pair, Multi-Timeframe
Order Block detector PRO
Order Block PRO β€” Smart Institutional Zone Detector
AlphaTrend Pro by LudwigICT
Indicator
XAUUSD
Commodities
Forex
+3
Silver Bullet by LudwigICT
Indicator
Indices
XAUUSD
Prop
+8
FREE Squeeze Momentum from TradingView
Squeeze Momentum - Anticipate explosive market moves before they happen
Indicator
Indices
Commodities
Forex
+2
Advanced Swings
ICT Advanced Swings Indicator – Multi-Timeframe Precision
cBot
XAUUSD
Commodities
Forex
+3
Volatility Sniper Breakout BETA
Volatility Sniper Breakout Bot (Beta) – Intelligent Breakout Trading for Volatile Markets
cBot
Scalping
FRAMEWORK
ICT Framework cBot – Advanced Trading Automation for Any Pair & Timeframe
Indicator
Grid
RSI
Breakout
+18
Logarithmic Framework by LudwigICT
Indicator
Grid
NAS100
RSI
+16
Smart Money Breakout Channels
Smart Money Breakout Channels by LudwigICT β€” cTrader/cAlgo Indicator
DIGITAL IMPLEMENTATION SYSTEM
LudwigICT – Digital Root & IDR (cTrader Automate)
ADVANCED ICT + ADR + AWR SUITE PRO
ADVANCED ICT + ADR + AWR SUITE PRO (The Ultimate All-in-One Toolkit for Price Action Traders)
Indicator
VWAP
RSI
XAUUSD
+9
Turtle Soup ICT Strategy
Turtle Soup ICT Strategy – Smart Liquidity Trap Detection for cTrader
Indicator
NAS100
NZDUSD
XAUUSD
+14
Volume Profile Pivot Anchored
Anchor volume profiles to pivots with POC, VAH, VAL and real-time insights for clearer trade decisions.
True Deviation System
True Deviation System – Precision Meets Professional Trading
Indicator
VWAP
RSI
Breakout
+7
Anchored VWAP by LudwigICT
Anchored VWAP (Auto hi-lo) by LudwigICT
Indicator
VWAP
XAUUSD
Forex
+2
Dynamic Swing Anchored VWAP
Indicator
XAUUSD
Forex
EURUSD
+2
ALMA Smoothed Gaussian Moving Average
ALMA Smoothed Gaussian Moving Average (ASGMA) – by LudwigICT
You may also like
Indicator
Breakout
Commodities
Forex
+3
MAGIC BLOCK STRATEGY
Block Liquidity,indicator.Block Order, Liquids Stops, Signal Sentiment,signal correction
Indicator
Indices
ATR
Forex
+1
[Stellar Strategies] Market Regime Filter
Filters market regimes (trend/range/pullback) using MAs, ADX, ATR/BBW Vol, opt. Volume. Helps adapt strategy. πŸ“‰πŸ“ˆ
Indicator
NAS100
NZDUSD
Breakout
+12
Samurai Breakout Pro II
βš”οΈFull breakout trading workstation: session box, EP/TP/SL levels, on-chart βœ“/βœ— outcomes, pro-level analytics and moreβš”οΈ
Indicator
NAS100
Breakout
XAUUSD
+12
Cross EMA Pro
Cross EMA Pro – Trend Reversal Indicator
Indicator
Indices
Breakout
Supertrend
[CB] Pivot Points Pro
You can use the cTrader Pivot Points Pro indicator to find a good pullback entry in a trend
Indicator
Signal
Half Trend BT
Half Trend BT by BullittTraders
LT Flexible Volume Profile
Flexible Volume Profile, designed with performance in mind.
Previous Day Liquidity Zones (PDH - PDL)
Useful indicator for traders who want to visualize key price levels based on previous daily highs and lows.
Market Session V3_NSC
Version 3: Full control of session display including start and end times of all 3 sessions!
Reko Wic
Visualize global Forex trading sessions with clear time blocks for better timing and strategy planning.
FVG
The Indicator is a powerful tool for price-action traders seeking to identify and exploit short-term imbalances.
SpreadCalculator - BossFXTrader
Spread Calculator to calculate the difference between two prices or values.
Top-rated
Free
VWAP Pro
Advanced VWAP with up to 30 anchored levels, multiple timeframes, memory mode, standard deviation bands & simple GUI
SupertrendHTF
Overlay higher-timeframe SuperTrend to filter noise, follow real trends, and avoid lower-timeframe whipsaws. As
Indicator
Signal
TendSignal_indicator
Trend following signal
Indicator
Prop
Commodities
Stocks
+2
Light-Version BrickAlgo TrendPulse
πŸš€ Simplify Your Trading Decisions With Powerful Technical Analysis.
VegaXLR - ZigZag Alerts
cTrader ZigZag Alerts: Precision Swing Detection, Alerts, and Fibonacci.
pATR
An indicator that redefines ATR by applying a percentile-based filter giving traders a grounded view of volatility.