Indicator
forex
eurusd
usdjpy
"4 Currencies V2_NSC" logo
4 Currencies V2_NSC
0.0
03/09/2025
0
Desktop
"4 Currencies V2_NSC" uploaded image"4 Currencies V2_NSC" uploaded image"4 Currencies V2_NSC" uploaded image"4 Currencies V2_NSC" uploaded image

If you've spent any time in the Forex markets, you know how tricky it can be to figure out which currency is genuinely driving a move, especially when you're looking at multiple pairs. I often found myself wanting a clearer way to see the individual performance of major currencies, not just how one pair was behaving.

That’s why I developed this Relative Currency Strength indicator.

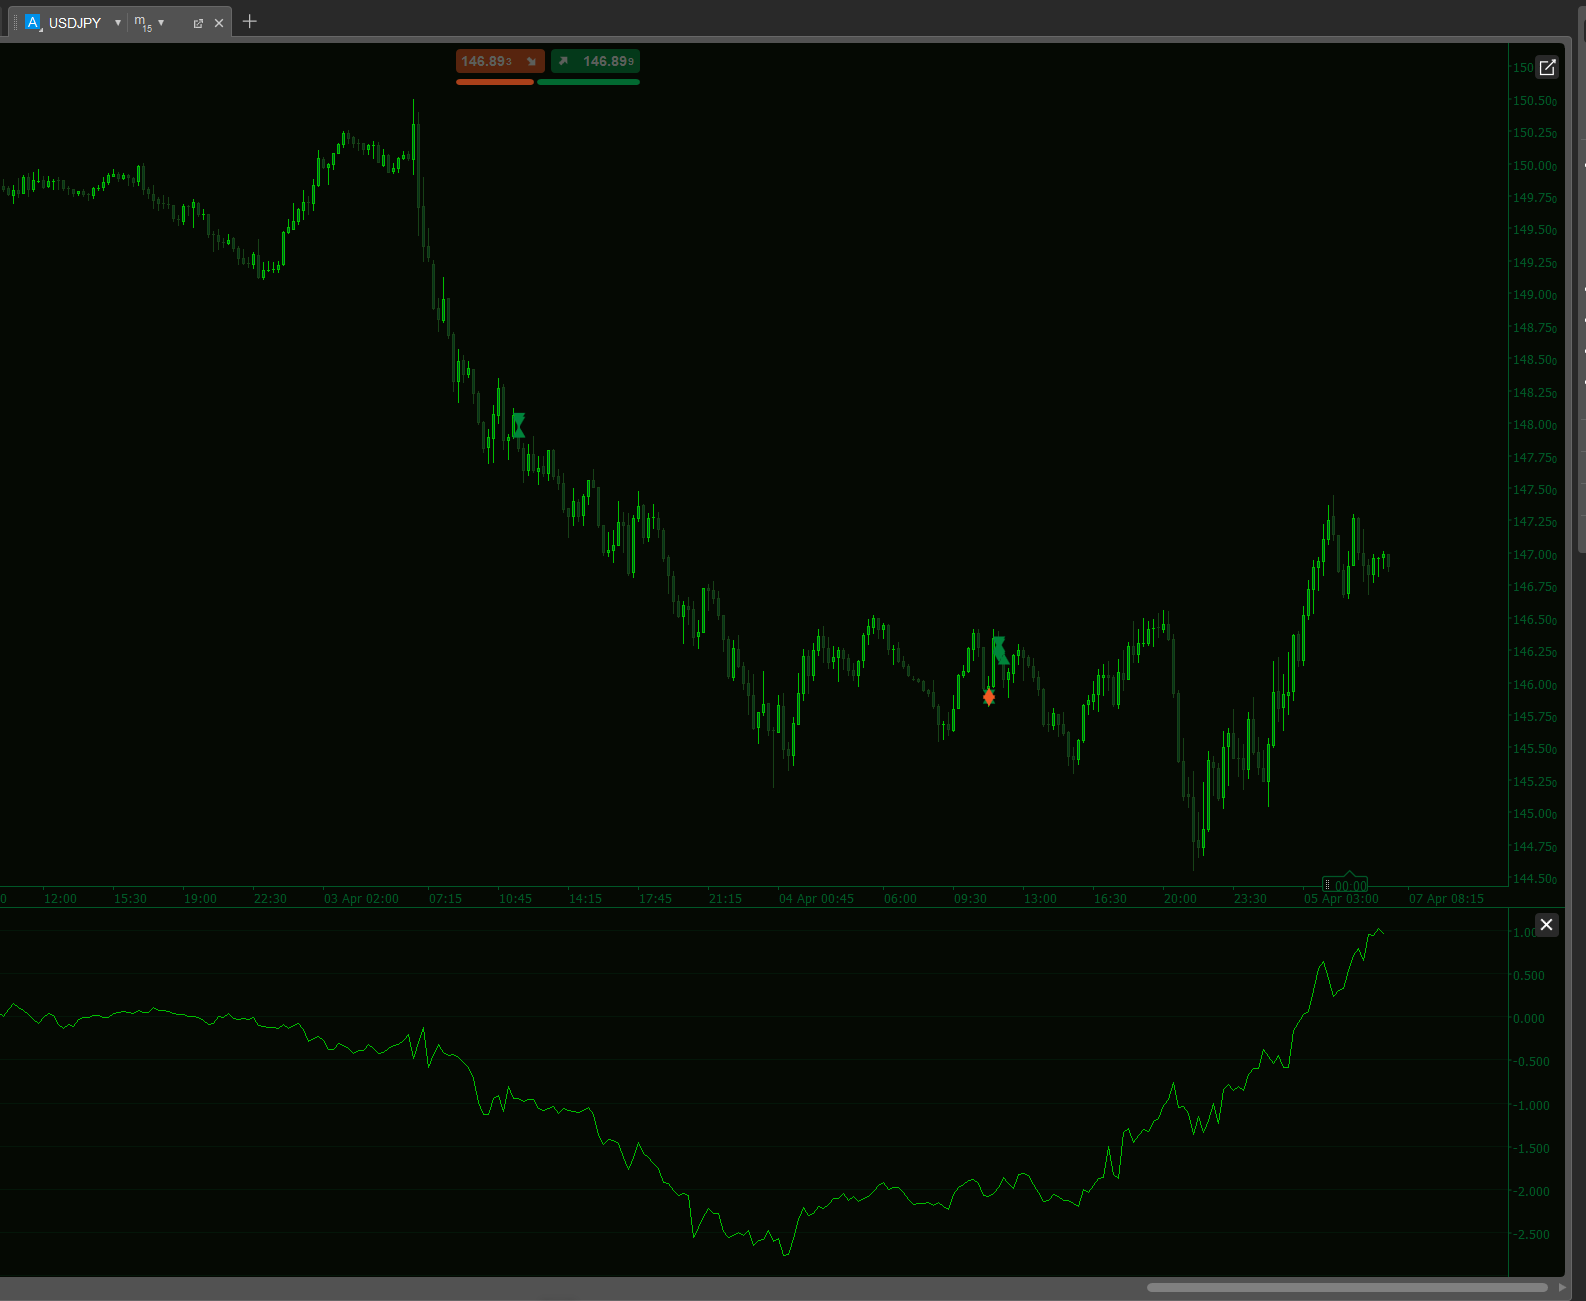
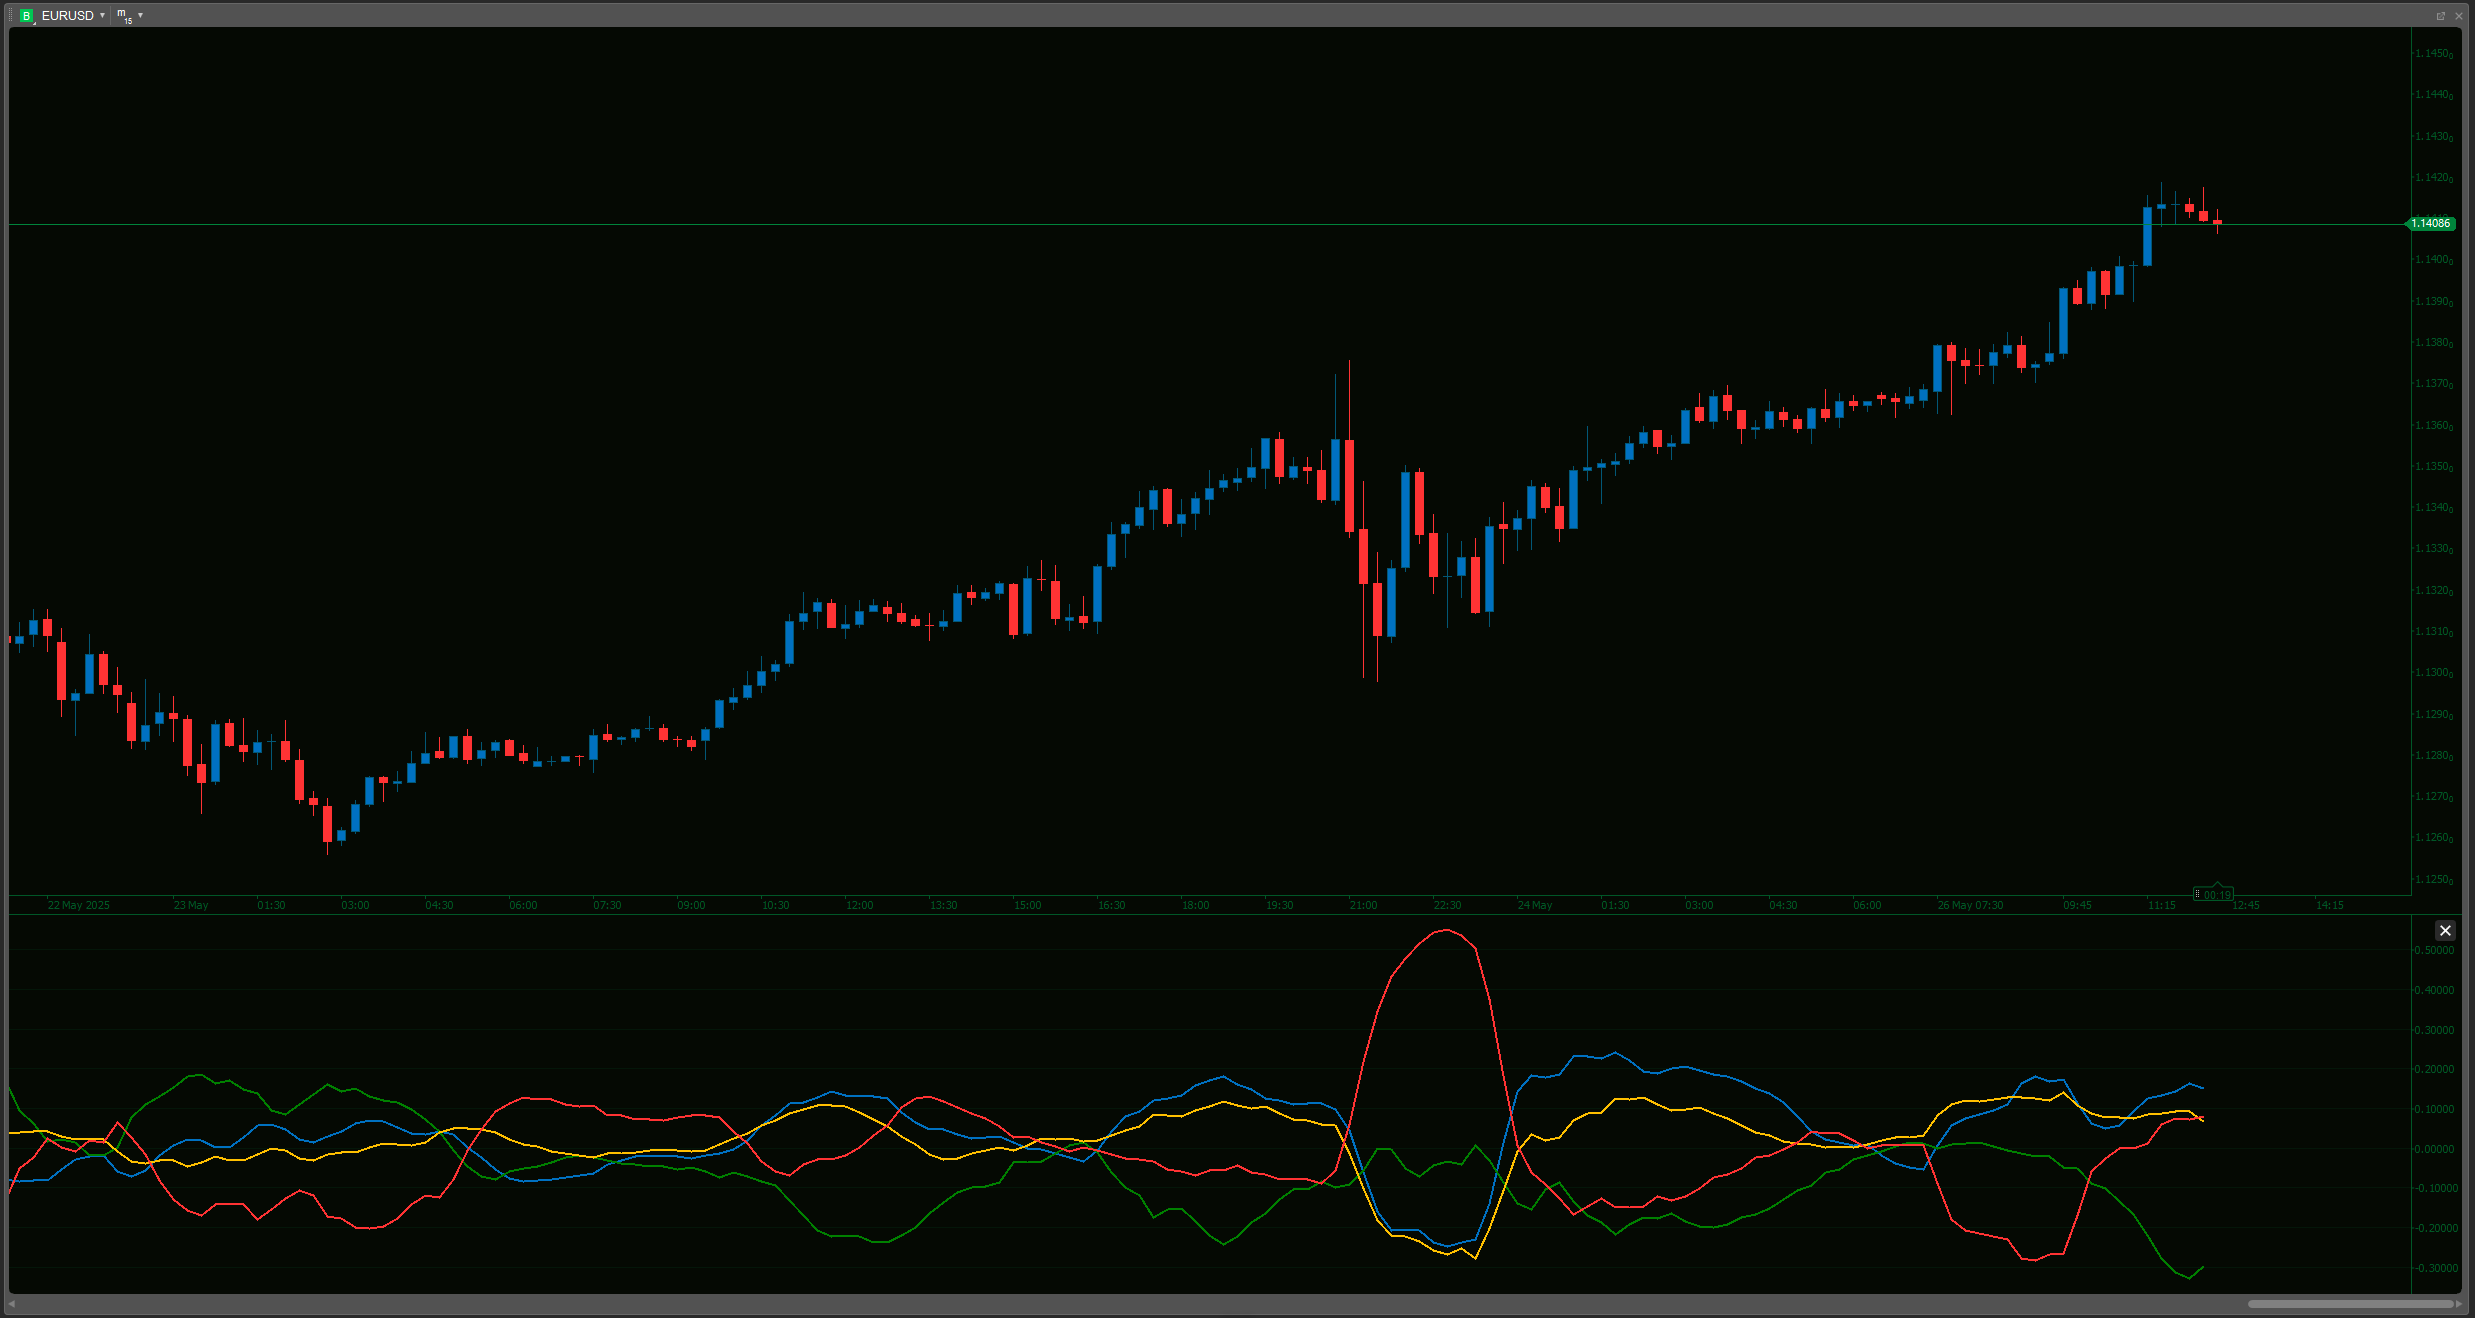
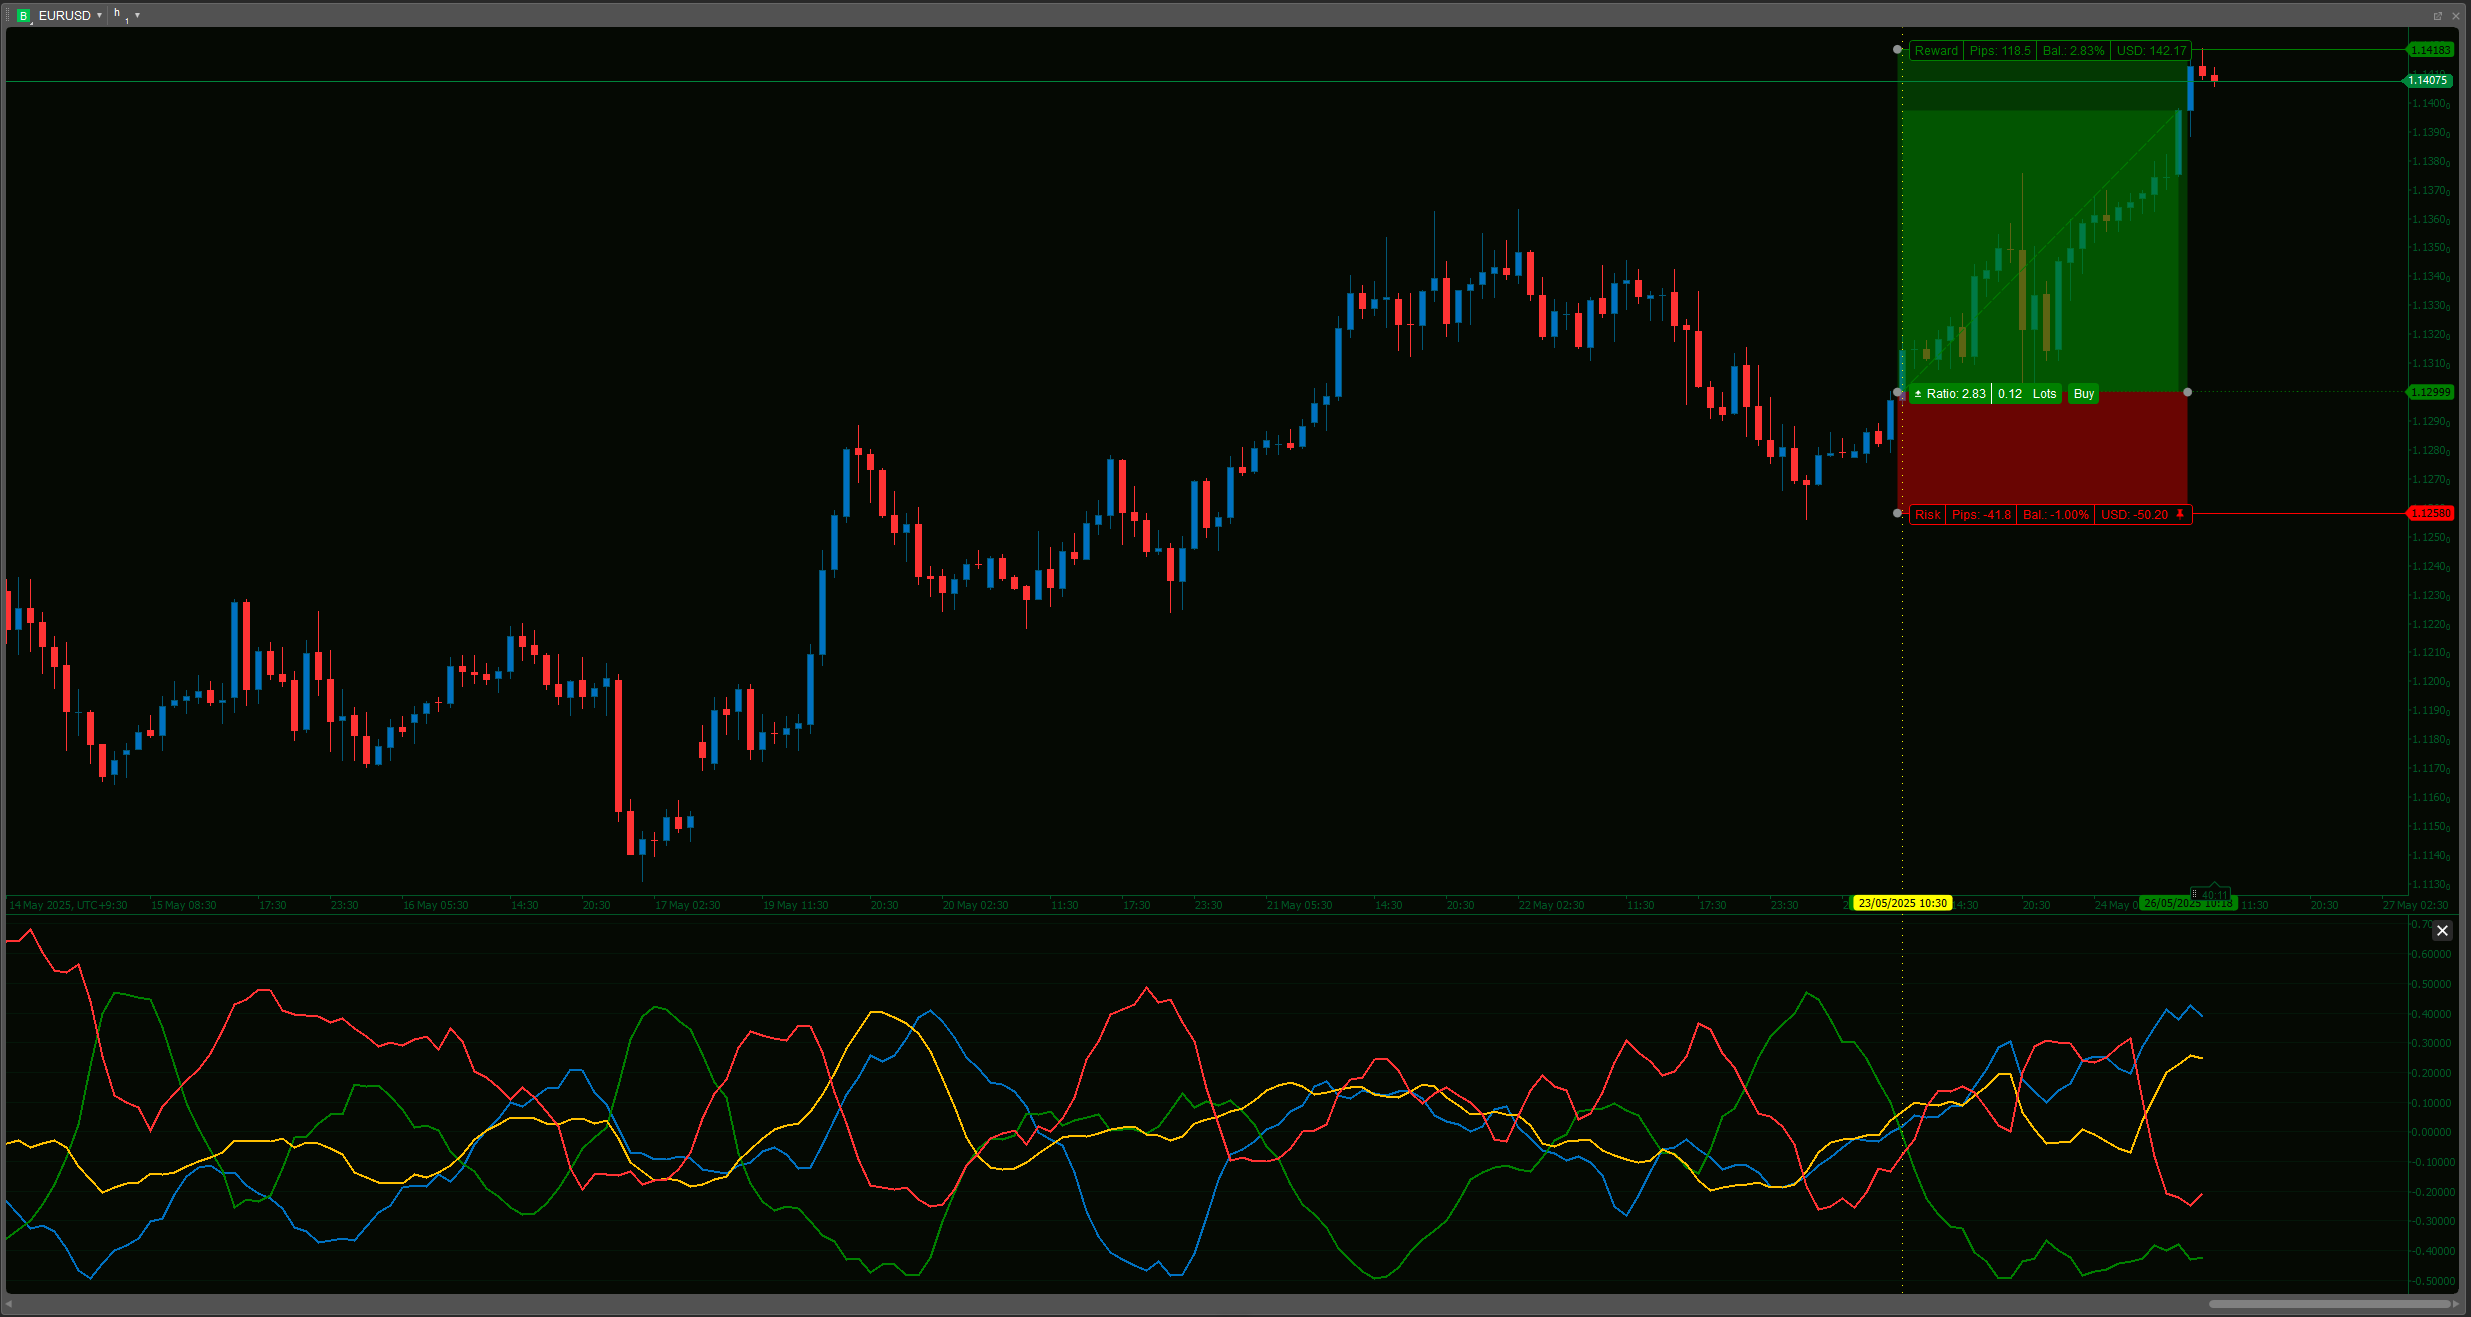
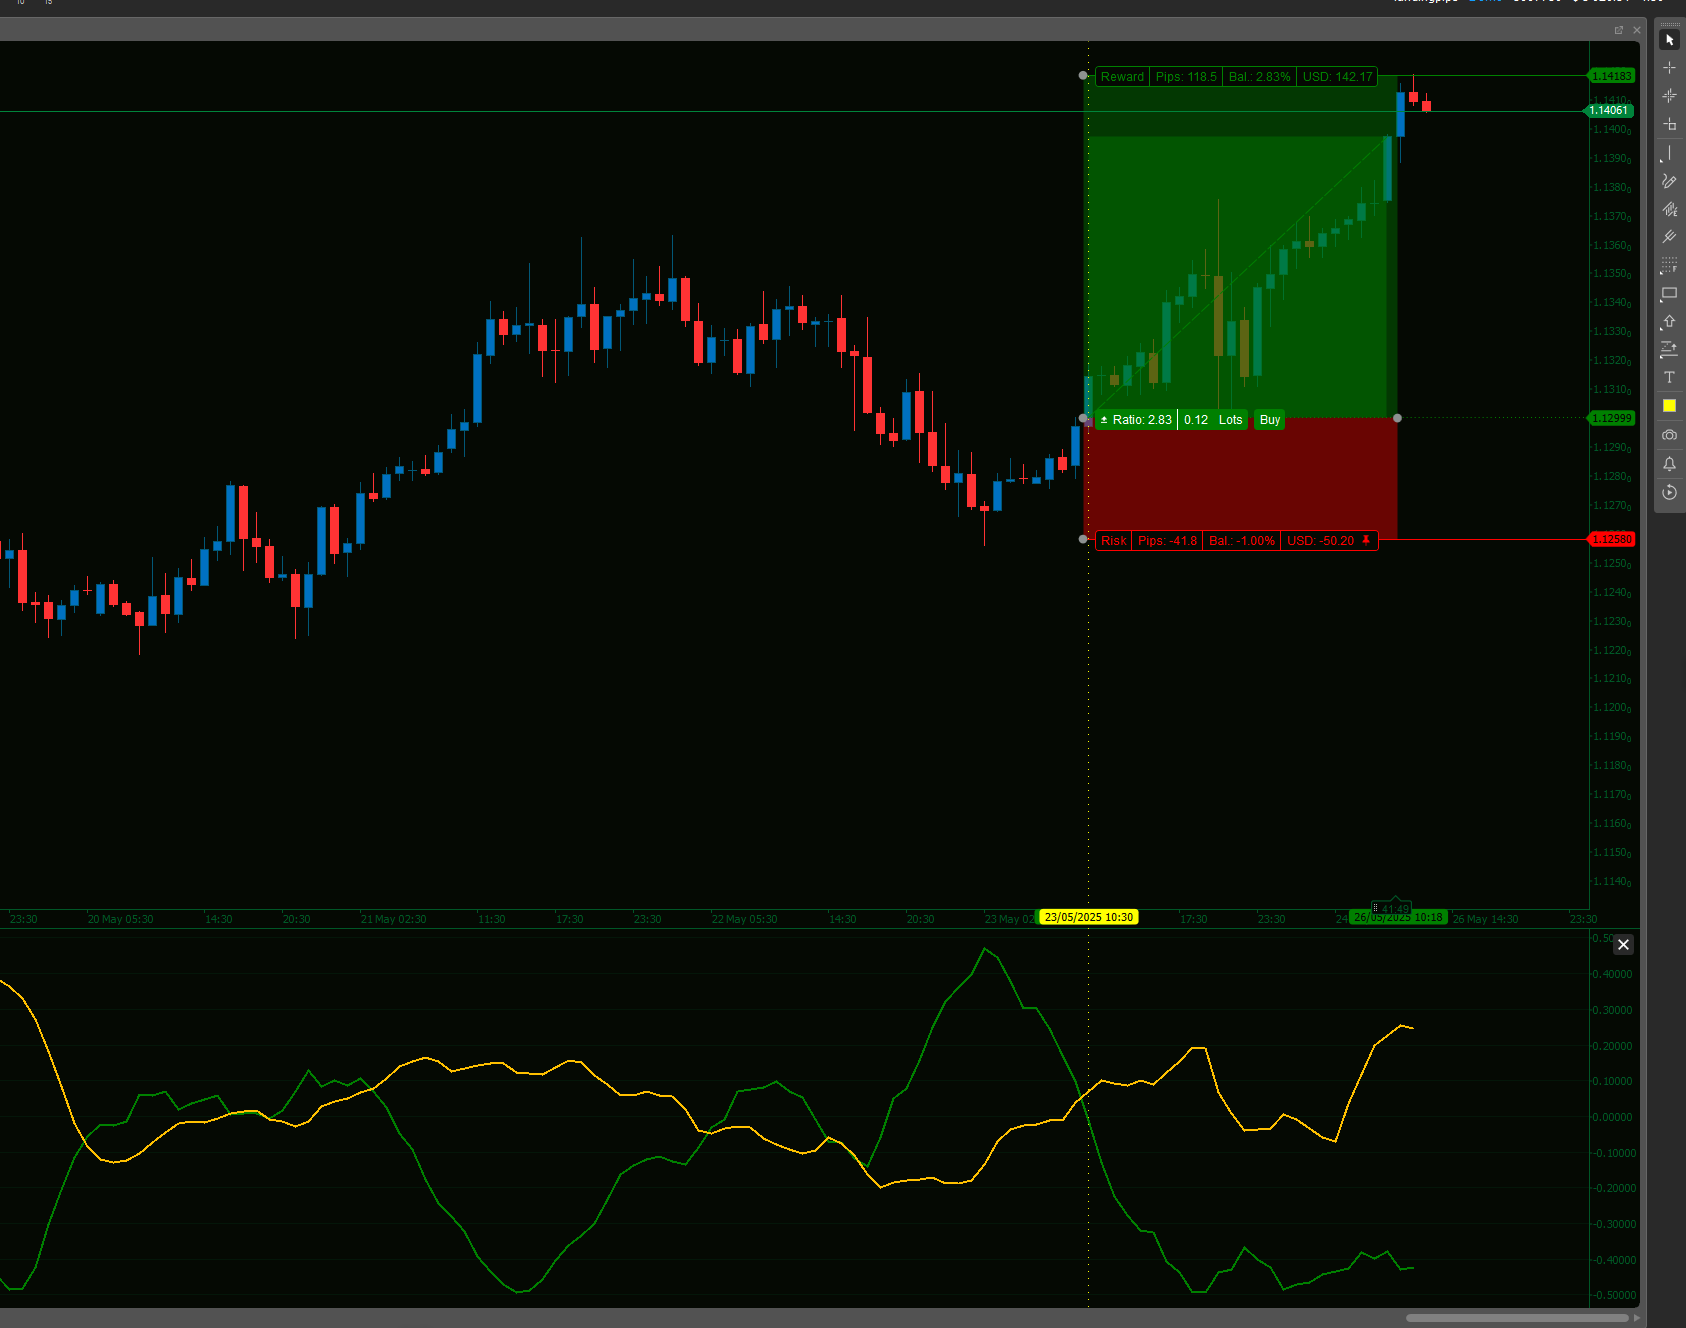
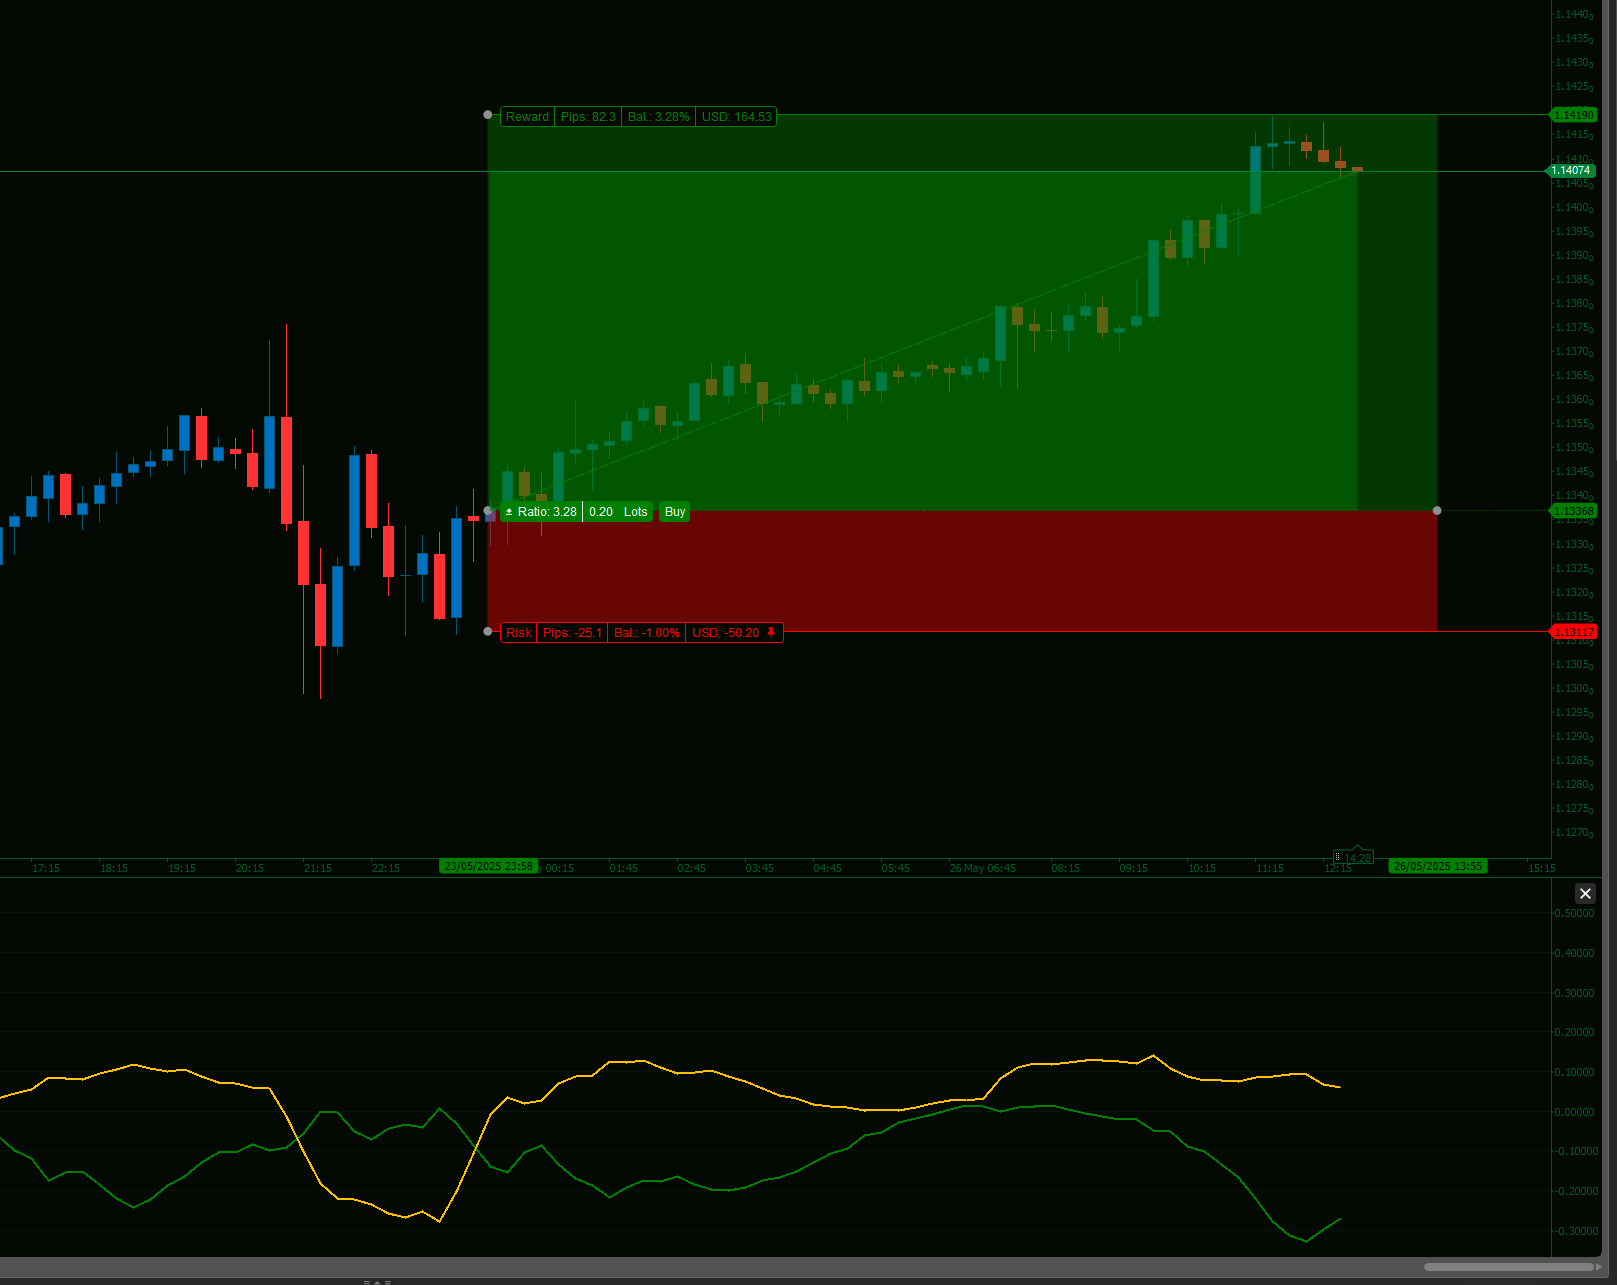
The idea is pretty straightforward: it aims to measure and display the relative strength of the AUD, USD, EUR, and JPY. It does this by looking at how each of these currencies is performing against a basket of the others (specifically across pairs like AUDUSD, AUDEUR, AUDJPY, EURUSD, EURJPY, and USDJPY) over a lookback period that you can define.

How I've found it helpful, and how it might help you:

  • Better Pair Selection: Sometimes, seeing that, for instance, AUD is consistently strengthening while JPY is weakening can give you a nudge to take a closer look at AUD/JPY. It can help filter down the pairs you focus on.
  • Understanding Market Drivers: When a pair like EUR/USD moves, is it mostly USD strength or EUR weakness? This indicator can give you some perspective on that, helping you understand the broader flow.
  • Tailor to Your Style:
    • You can adjust the LookbackPeriod (default is 14 bars). A shorter period will be more responsive, a longer one will show more established trends.
    • There's also a SmoothingPeriod (default is 5 bars) which applies an EMA to the strength lines. This can help reduce some of the noise if you prefer a smoother output. If you want the raw calculation, just set smoothing to 0.
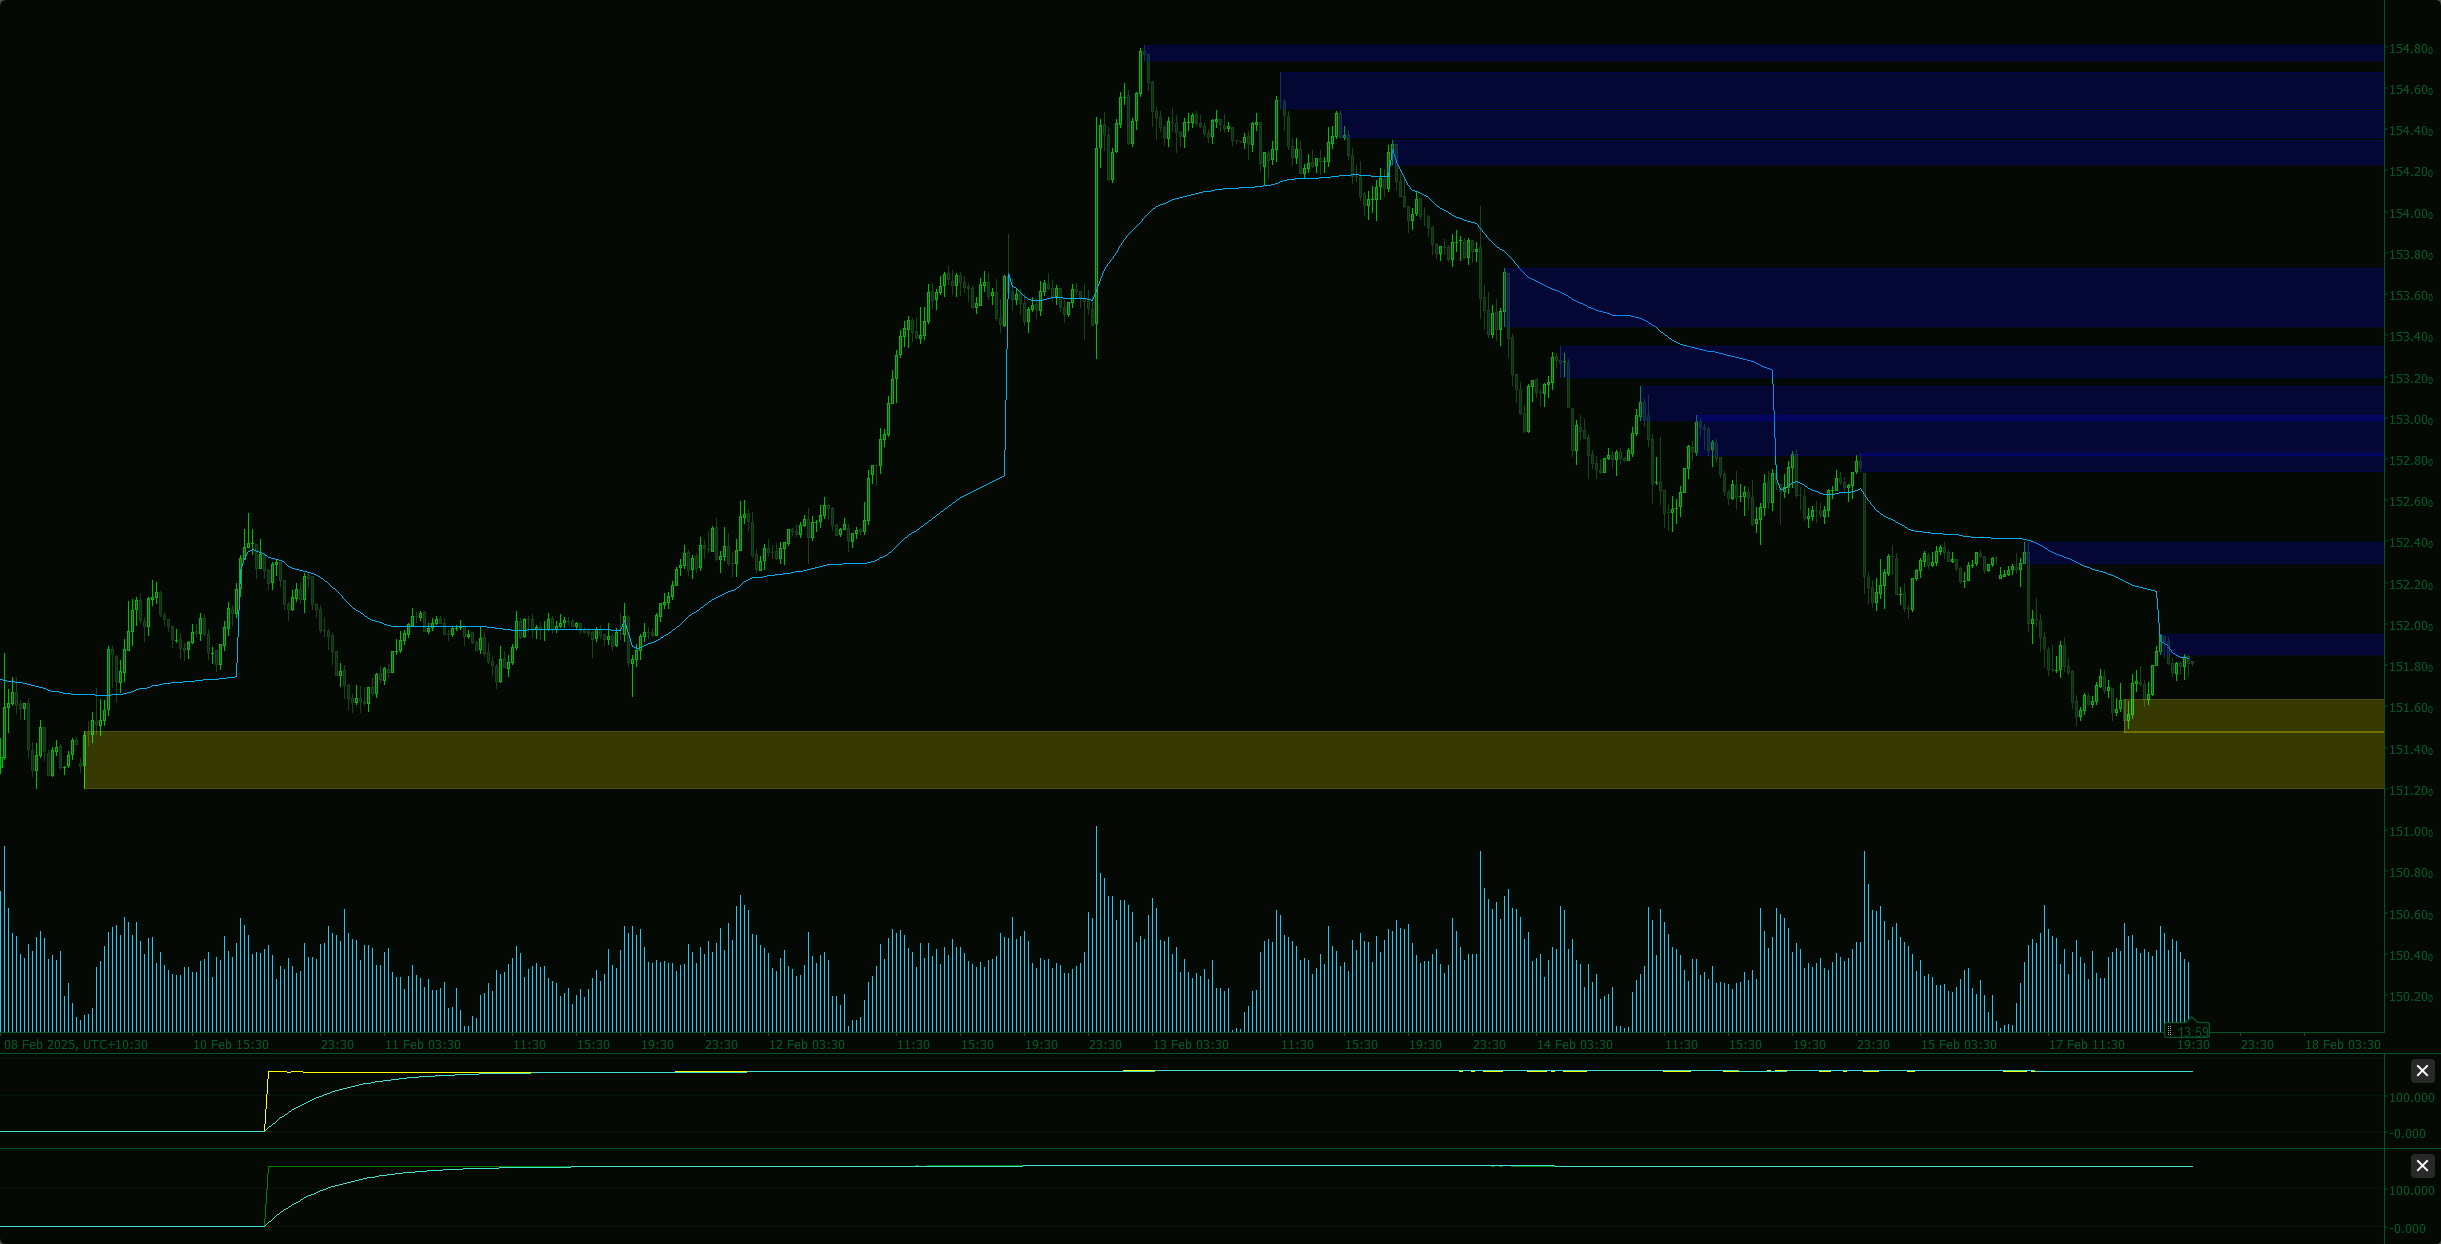
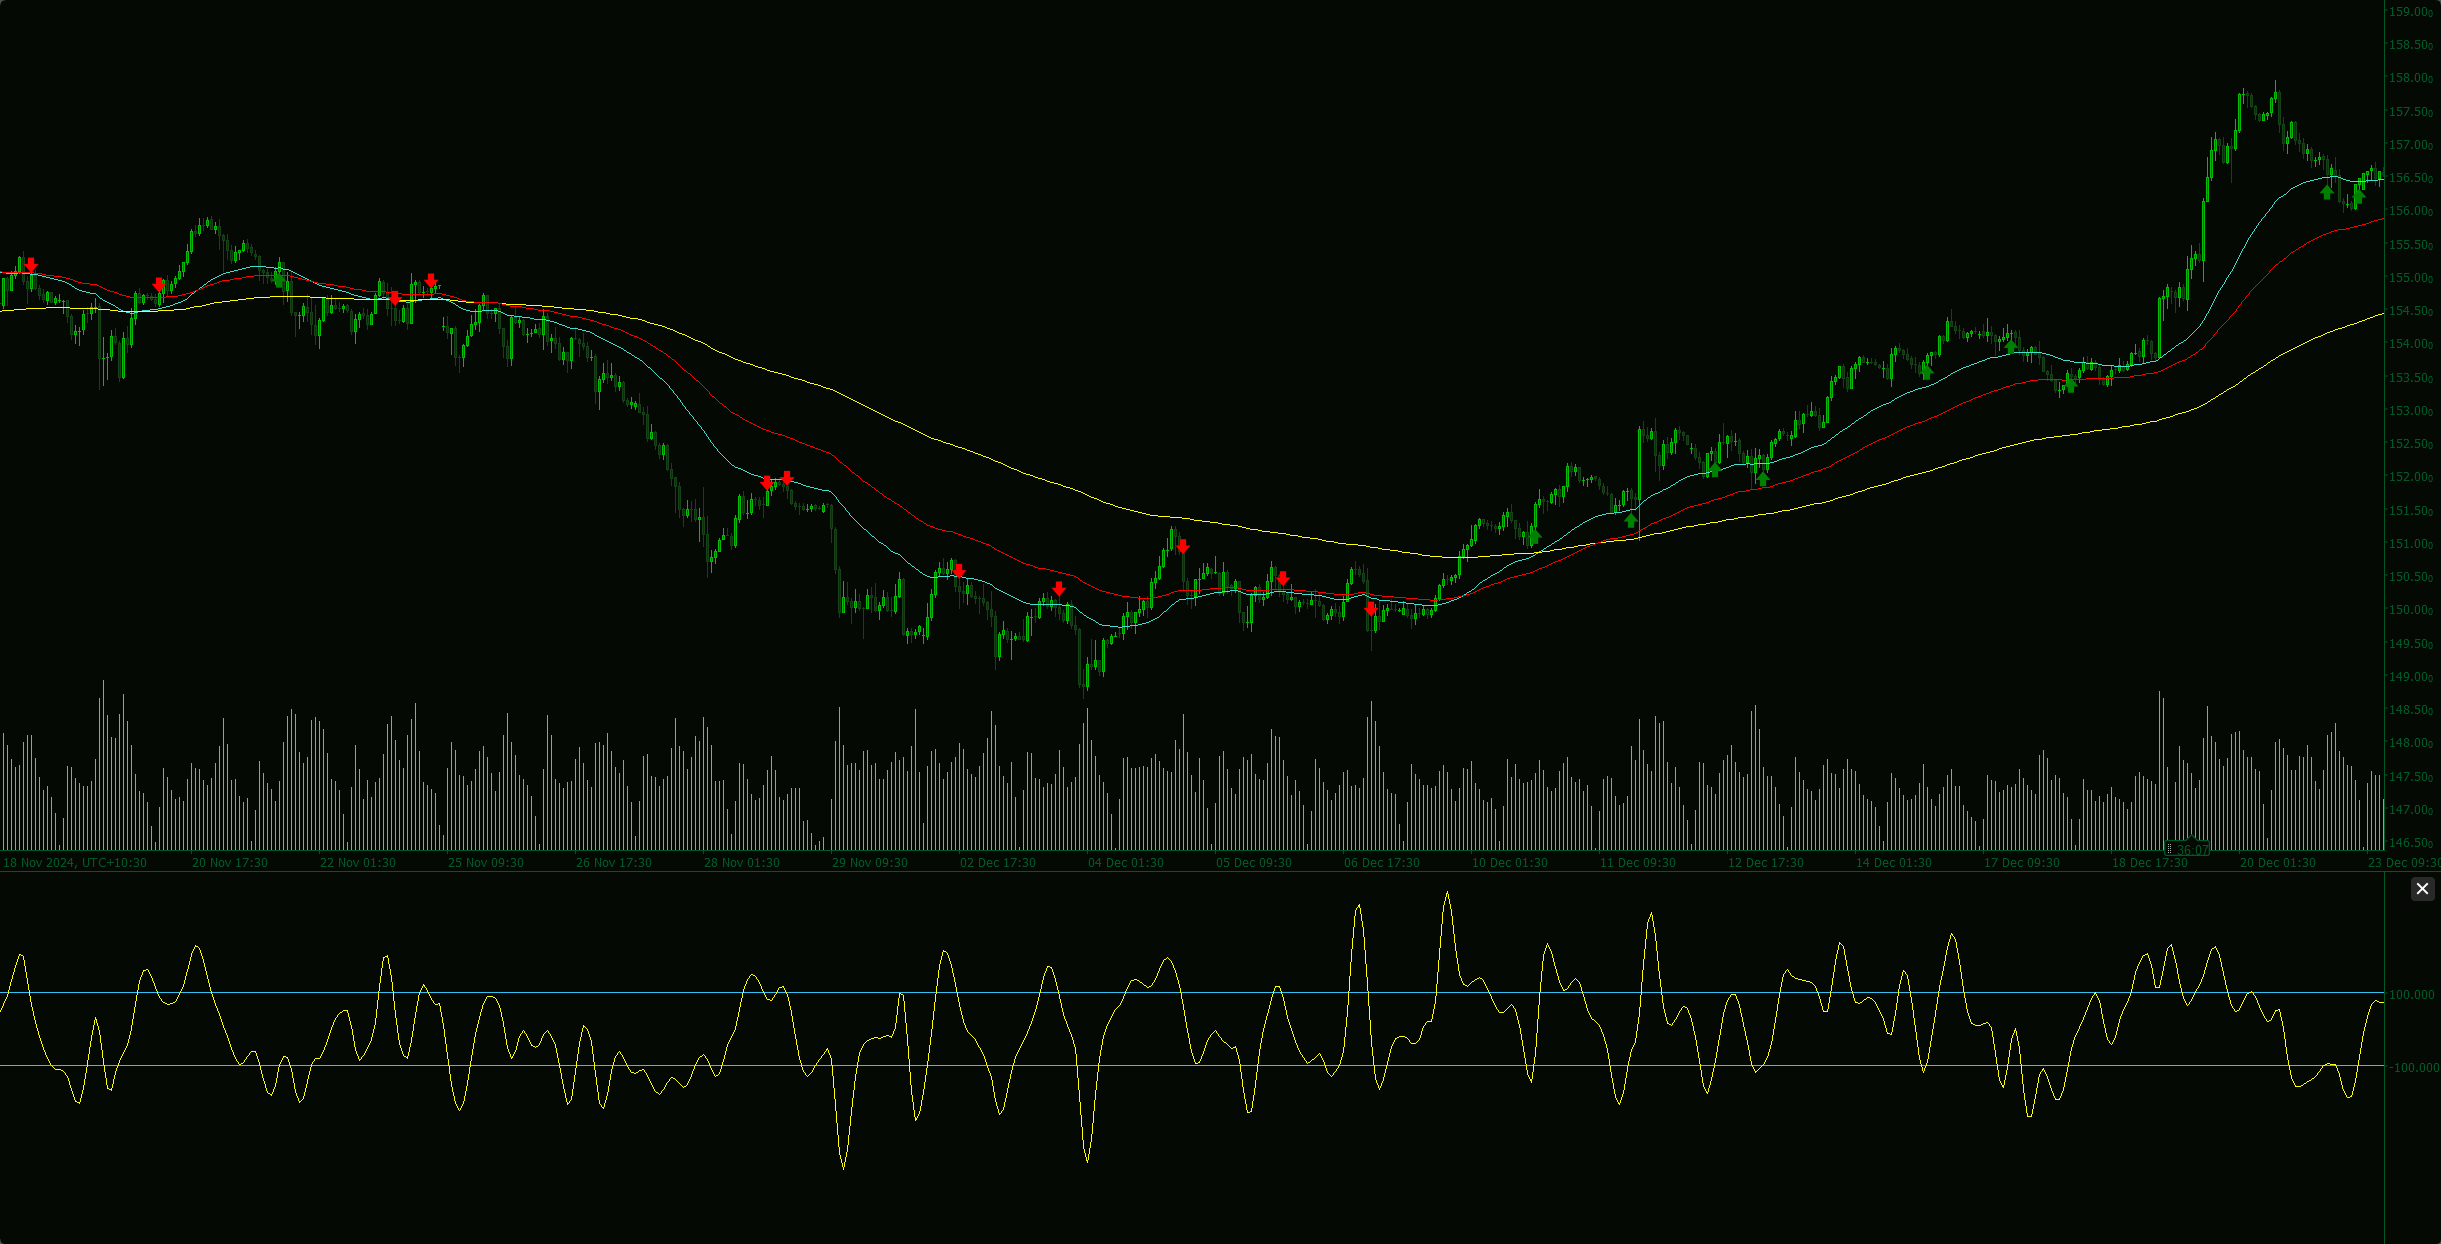
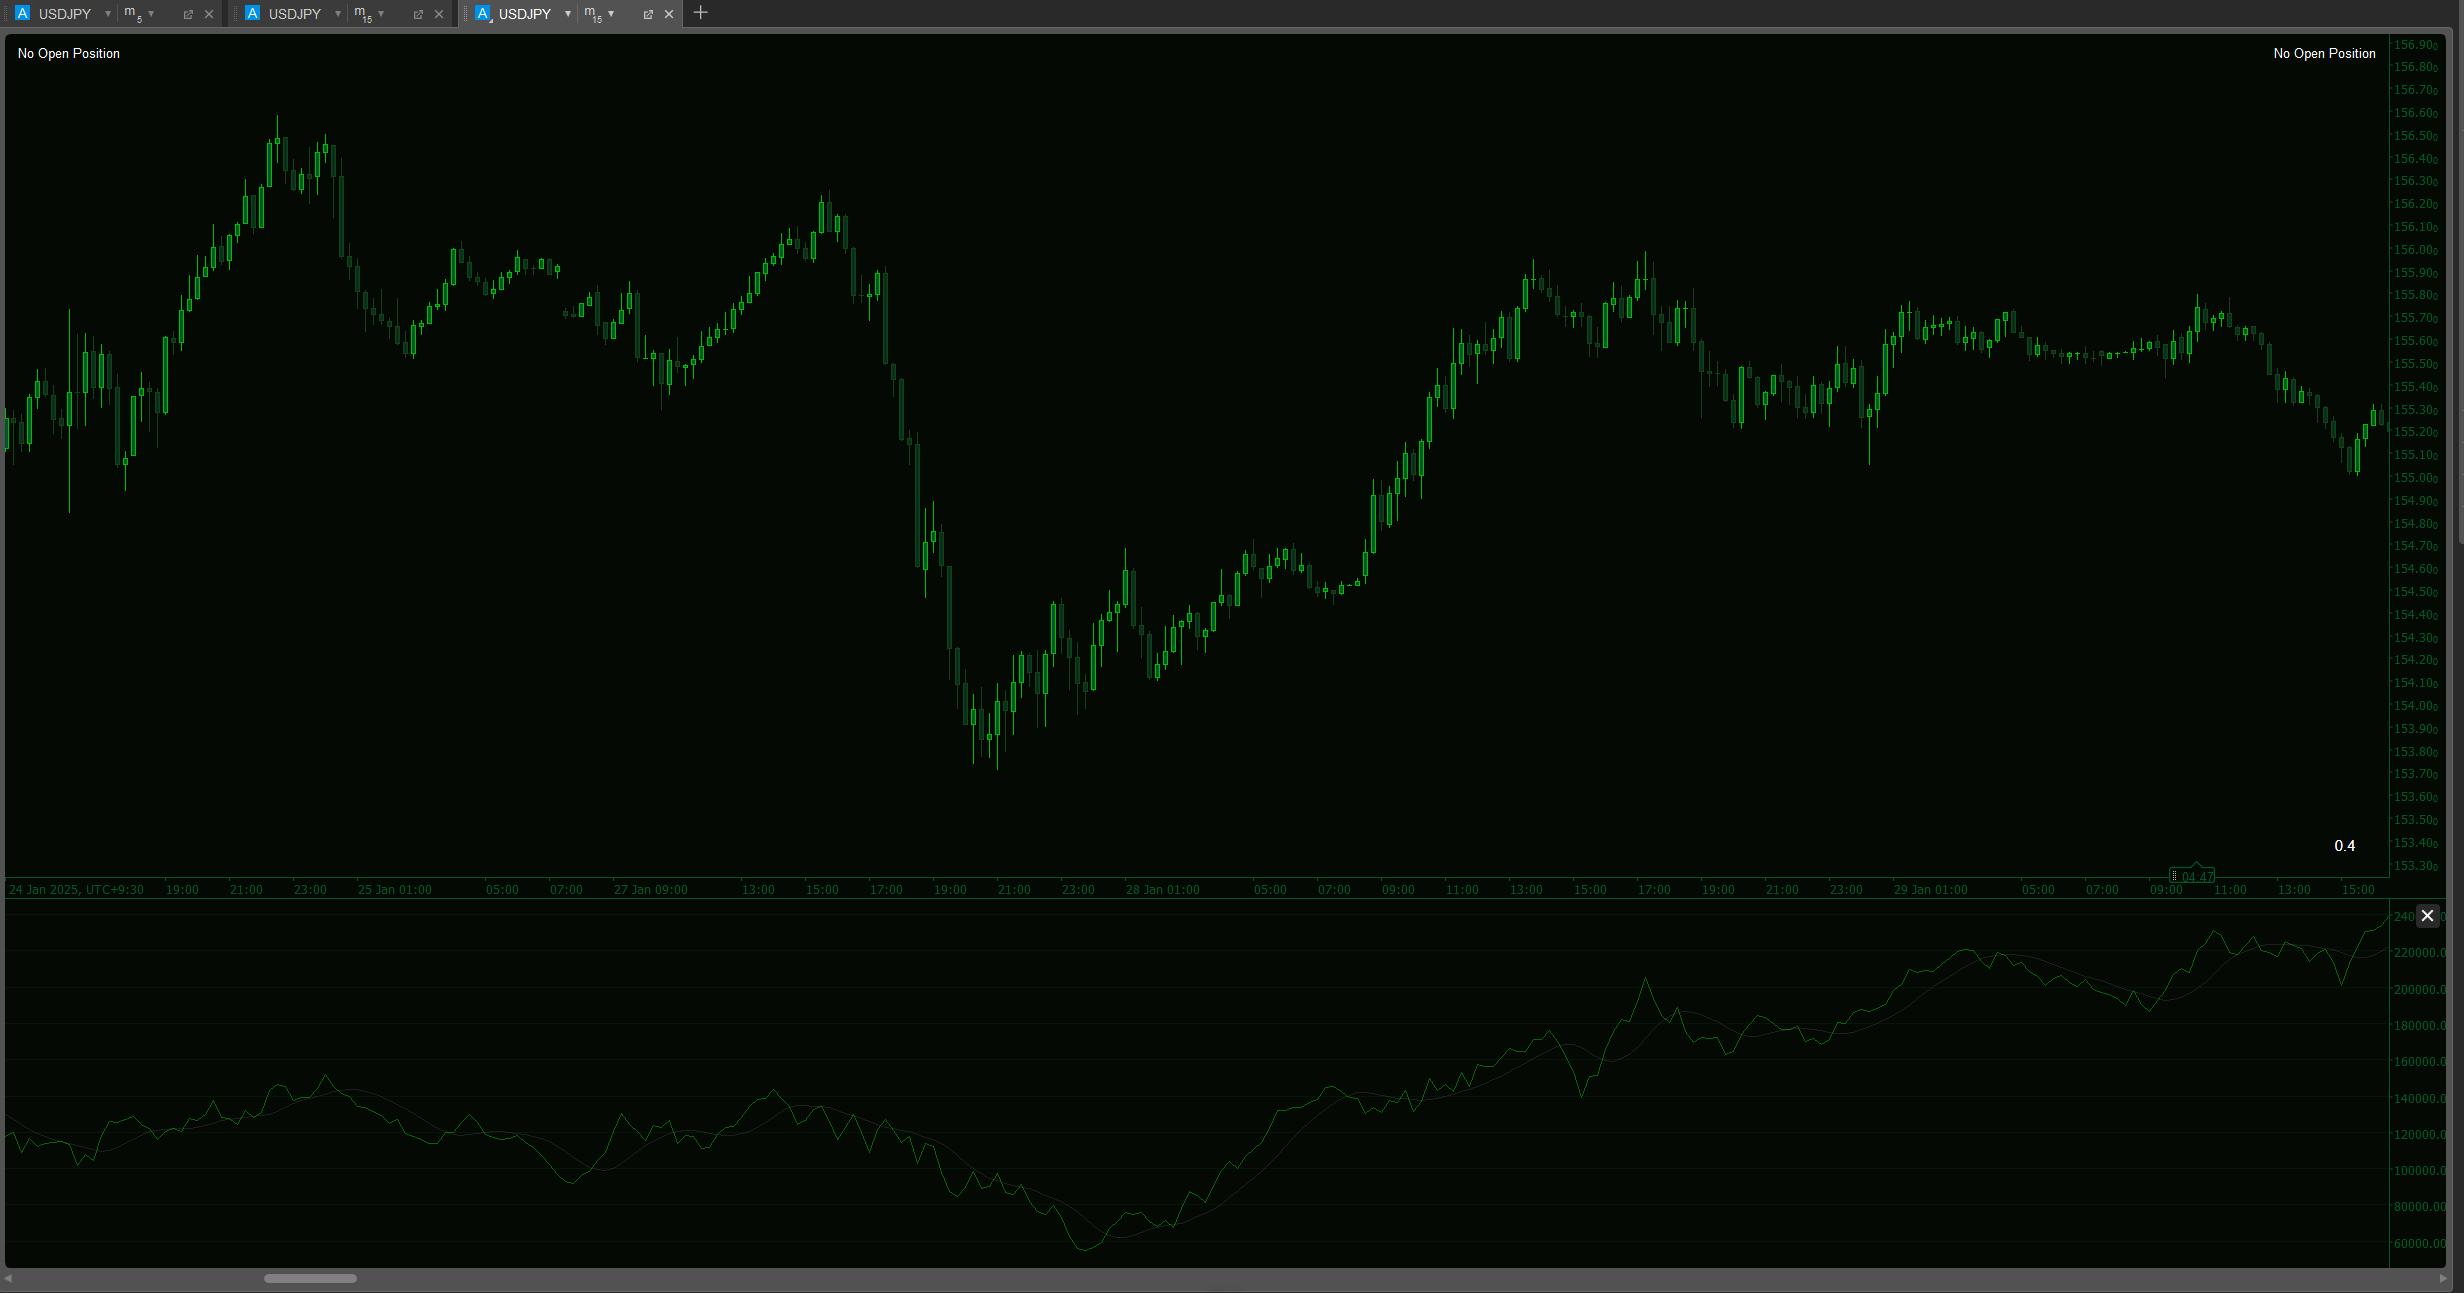
  • Clear Visuals: It plots each currency's strength as a separate line in its own window below your main chart, so it doesn’t clutter up your price action.
  • Reliable Data: The calculations are done on the close of each bar, so the lines won't repaint or change once a bar is complete.

No indicator is a crystal ball, and this one is no different. It's a tool. I've found it to be a useful part of my analysis process, especially for confirming ideas or getting a quick overview of what the major currencies are up to.

Heads up, given that this indicator is pulling data for all currency pairs to effectively calculate true relative strength, this indicator can be resource heavy and break Ctrader at times if you have other resource heavy indicators as well. I have had this occur once in the past month on my 5 year old PC so it should not happen regularly. But if it does, a simple refresh of the window timeframe or a simple adjustment of the period settings by +/-1 will force a recalculate and the indicator will appear again.


--------------------------

Please feel free to check out my other indicators!

https://ctrader.com/products/1181

https://ctrader.com/products/1182

https://ctrader.com/products/1180

https://ctrader.com/products/1015

https://ctrader.com/products/555

https://ctrader.com/products/553

https://ctrader.com/products/554

https://ctrader.com/products/552

https://ctrader.com/products/557

https://ctrader.com/products/845

https://ctrader.com/products/848

https://ctrader.com/products/847

https://ctrader.com/products/846

https://ctrader.com/products/551

https://ctrader.com/products/574

https://ctrader.com/products/573

https://ctrader.com/products/556

https://ctrader.com/products/558

https://ctrader.com/products/559

https://ctrader.com/products/560

More from this author
Market Sessions - Free
Track major trading sessions (Tokyo, London, New York) with customizable colors and visual sessions on your chart.
Supply Demand V1-Premium
Auto-detect supply & demand zones, remove broken levels, and trade smarter with real-time alerts. Precision made simple.
Supply Demand - BasicV1
Supply and demand zones. They're important. Here's a free version to get you started!
MTF Candle Window - On Chart
The Multi-Timeframe Candle Indicator displays candles from multiple timeframes in one window, enhancing market analysis!
VWAP - London Open
VWAP Set to London Open
Volume Profile Triple Line - POC Median Mode
The Advanced Volume Profile Indicator calculates POC, Median, and Mode, revealing key price levels for smarter trading.
Market Sessions V2_NSC
Market Session V2: Full Control. colors, history, session/text toggles, font size. Elevate your strategy!
MTF Candle Countdown
Stay ahead with a real-time countdown to candle closes on all key timeframes: 5m, 15m, 30m, 1H, 4H, and Daily.
VWAP Tokyo Open
VWAP Set to Tokyo Open
Supply Demand Premium V2_NSC
The long awaited new and improved Supply Demand Premium V2 indicator. Unlock greater trading opportunities now!
Open Trade PipsV1
This indicator tracks the unrealised amount of pips in your open positions.
Market Session V3_NSC
Version 3: Full control of session display including start and end times of all 3 sessions!
Indicator
forex
indices
eurusd
+2
US Dollar Index
US Dollar Index
Indicator
indices
commodities
CCI - With Arrows and 40 80 EMA Logic_noSourceCode
The Advanced CCI & EMA Indicator combines the CCI with 40 & 80 EMA logic to generate precise arrows signaling direction
Open Trade ProfitV1
A simple indicator that tracks the value of your open trades in pips.
Indicator
usdjpy
signal
On Balance Volume USD - Combined
See USD demand in one line—Composite OBV fuses six major FX pairs into a clear momentum gauge.
Indicator
forex
indices
eurusd
+1
DXY w HMA
DXY HMA Indicator
Commodity Channel Index Smoothed w Alerts_NSC
Smoothed CCI alerts! Audio & arrow signals for +/-100 crosses. Custom sounds & arrow filters. Precision trading!
You may also like
Order Flow
Volumen Delta", es una representación visual del flujo de órdenes basada en el volumen de transacciones.
Area of Interest
Area of Interest with the power of AI to detect the market interest.
Premium Discount Zones
Premium Discount Zones" spots key areas (🟣Premium/🟢Discount) using recent highs/lows & volume..............
Top-rated
BarSentiments
This Indicator is a technical analysis tool that measures the strength and direction of market sentiment
Indicator
forex
indices
gbpusd
+13
ORDERFLOW_SKIA_Plynuly
This Indicator will show you Direction, Distance, and Time;
Donchian Channel Pro
Tracks N-period highs/lows, HTF overlay, HUDs with ADX, RSI, session clocks. Customizable for precise trading.
RSI Divergence Pro
This an RSI Divergence indicator which fulfill seller's need.
ictkillzonesfromnovem
ICT ALL KİLL ZONES, LONDON , ASİA, NY AM, NY LUNCH, NY PM
Indicator
signal
FractalArrowBuySell
Fractal Arrow Buy and Sell Indicator
ScalpingSignalIndicator
Scalping signals with EMA/RSI/ATR logic. Visual cloud shows precise entry and exit zones. Built for M1/M5 scalpers.
Renko Moving Average Cross Indicator
The Renko Moving Average Cross indicator combines classic EMA crossover signals with Renko-filtered prices.
IR Coral
Coral indicator
Indicator
prop
scalping
MM-HTF Bars
Shows bars from different Time Frame on zoom out and hides the current bars. Perfect tool for Multi TF "Market Reply"
Indicator
forex
ai
prop
+7
Vwap Manav Indi Button
Automated VWAP bot executes trades at key volume-weighted average price zones with adaptive risk management
MA Sabres
Conquer the markets with MA Sabres! This indicator spots trend flips with MAs and cool Sabre shapes & alerts.
Market Sessions V2_NSC
Market Session V2: Full Control. colors, history, session/text toggles, font size. Elevate your strategy!
Indicator
signal
macd
TradingViewMACD
Enhance your trading strategy with our customizable TradingViewMACD indicator. Optimize and elevate your market analysis