
ZigZag Smart Alert DEMO for cTrader
DEMO VERSION – 24 hours free trial!
This is a DEMO version of the ZigZag Smart Alert indicator for cTrader.
You can use all features for 24 hours after installation.
After the trial period, the indicator will expire and display a message.
To get the full version, search for "ZigZag Smart Alert" in the cTrader Store.
Key Features:
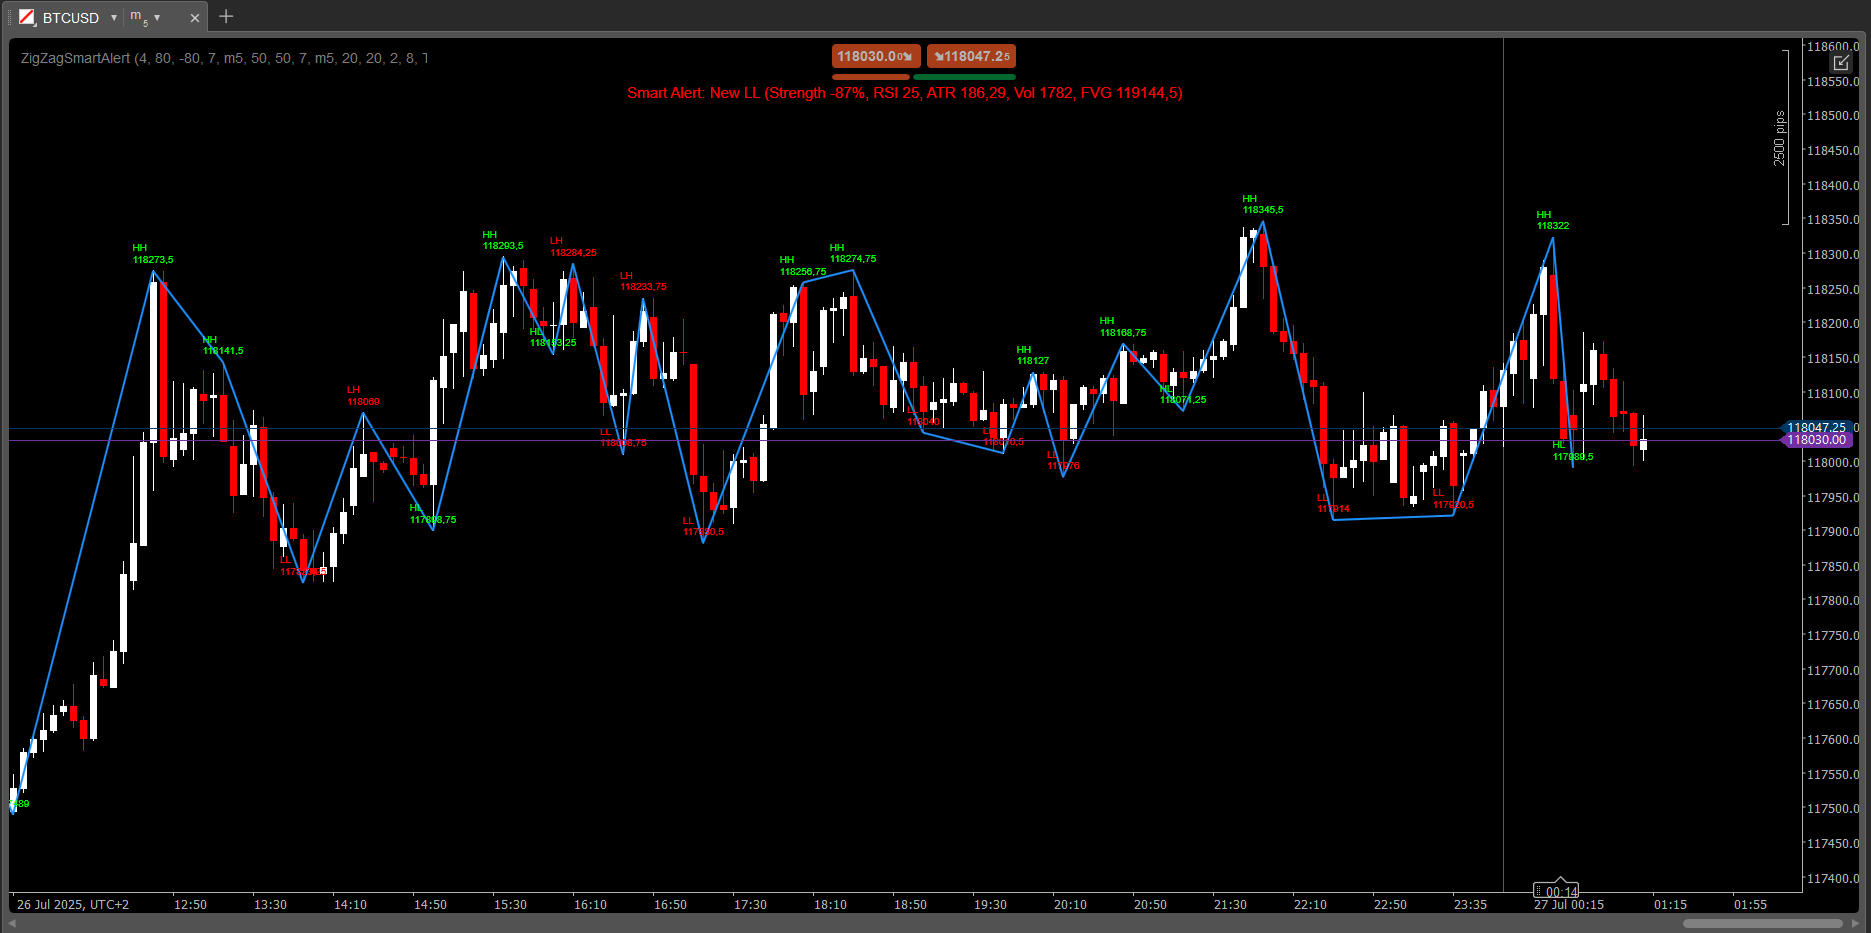
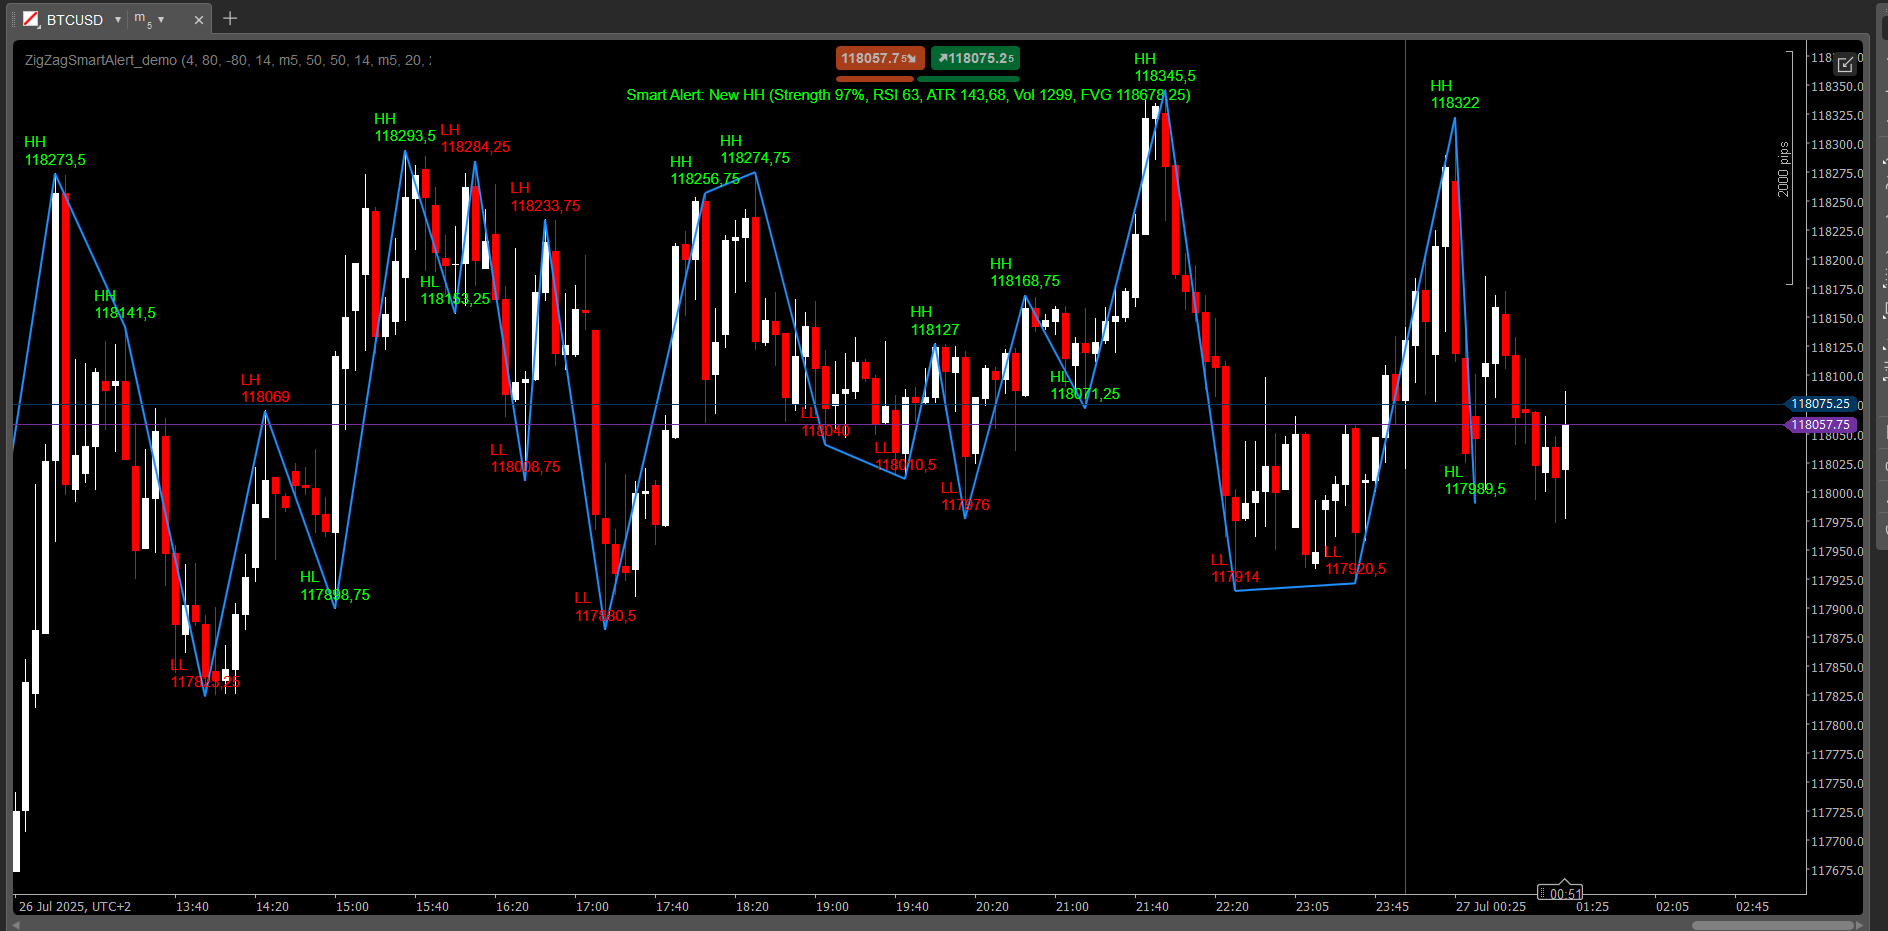
- Smart Multi-Filter Alerts:
- Receive sound and/or visual alerts only when a new swing (HH/LL) appears and all your custom filters are met (candle strength, RSI, ATR, volume, FVG).
- Entry arrows show you exactly where the signal occurred.
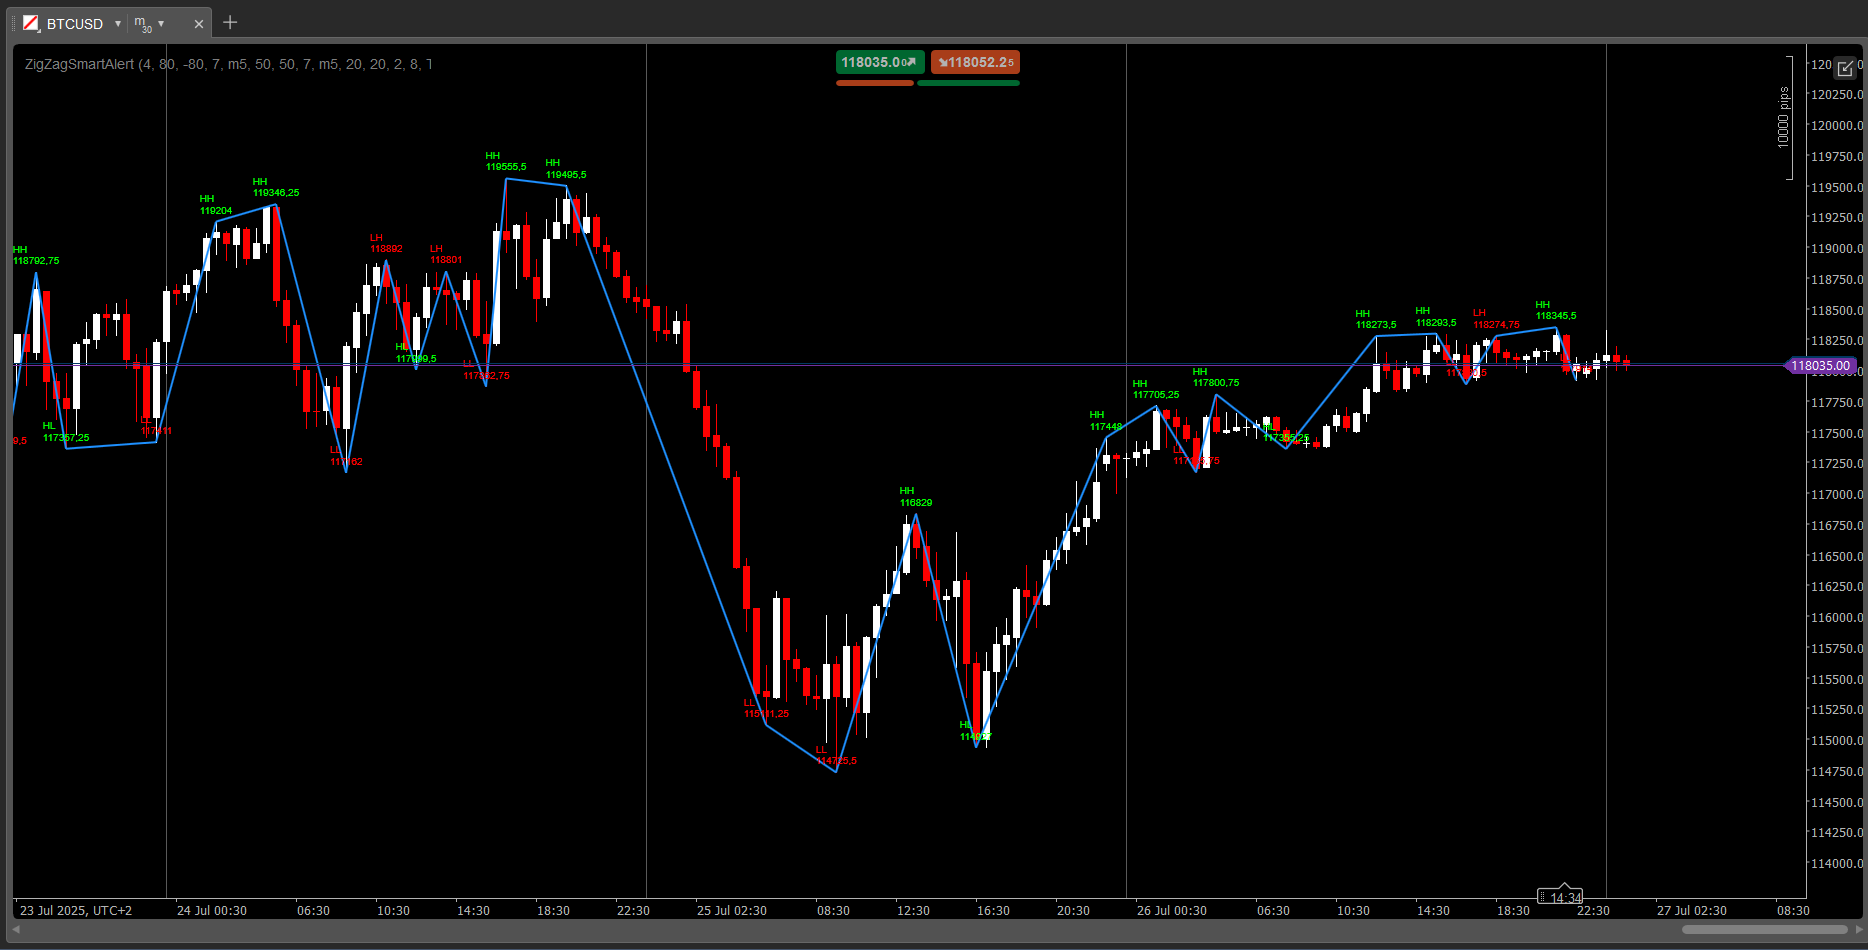
- Classic ZigZag Structure:
- Detects and labels all swing highs and lows (HH, HL, LH, LL) with customizable colors and font size.
- Adjustable sensitivity and line thickness.
- Fair Value Gap (FVG) Integration:
- Alerts only when a swing is confirmed by price closing above/below the nearest FVG.
- RSI, ATR, Volume Filters:
- Set your own thresholds and timeframes for RSI and ATR.
- Filter signals by candle strength and tick volume.
- Export Swings to CSV:
- Save all detected swings (index, time, type, price) to a CSV file for further analysis or journaling.
- Easy to Use, Fully Customizable:
- All parameters are available in the settings panel.
- Works on any instrument and timeframe.
How it works:
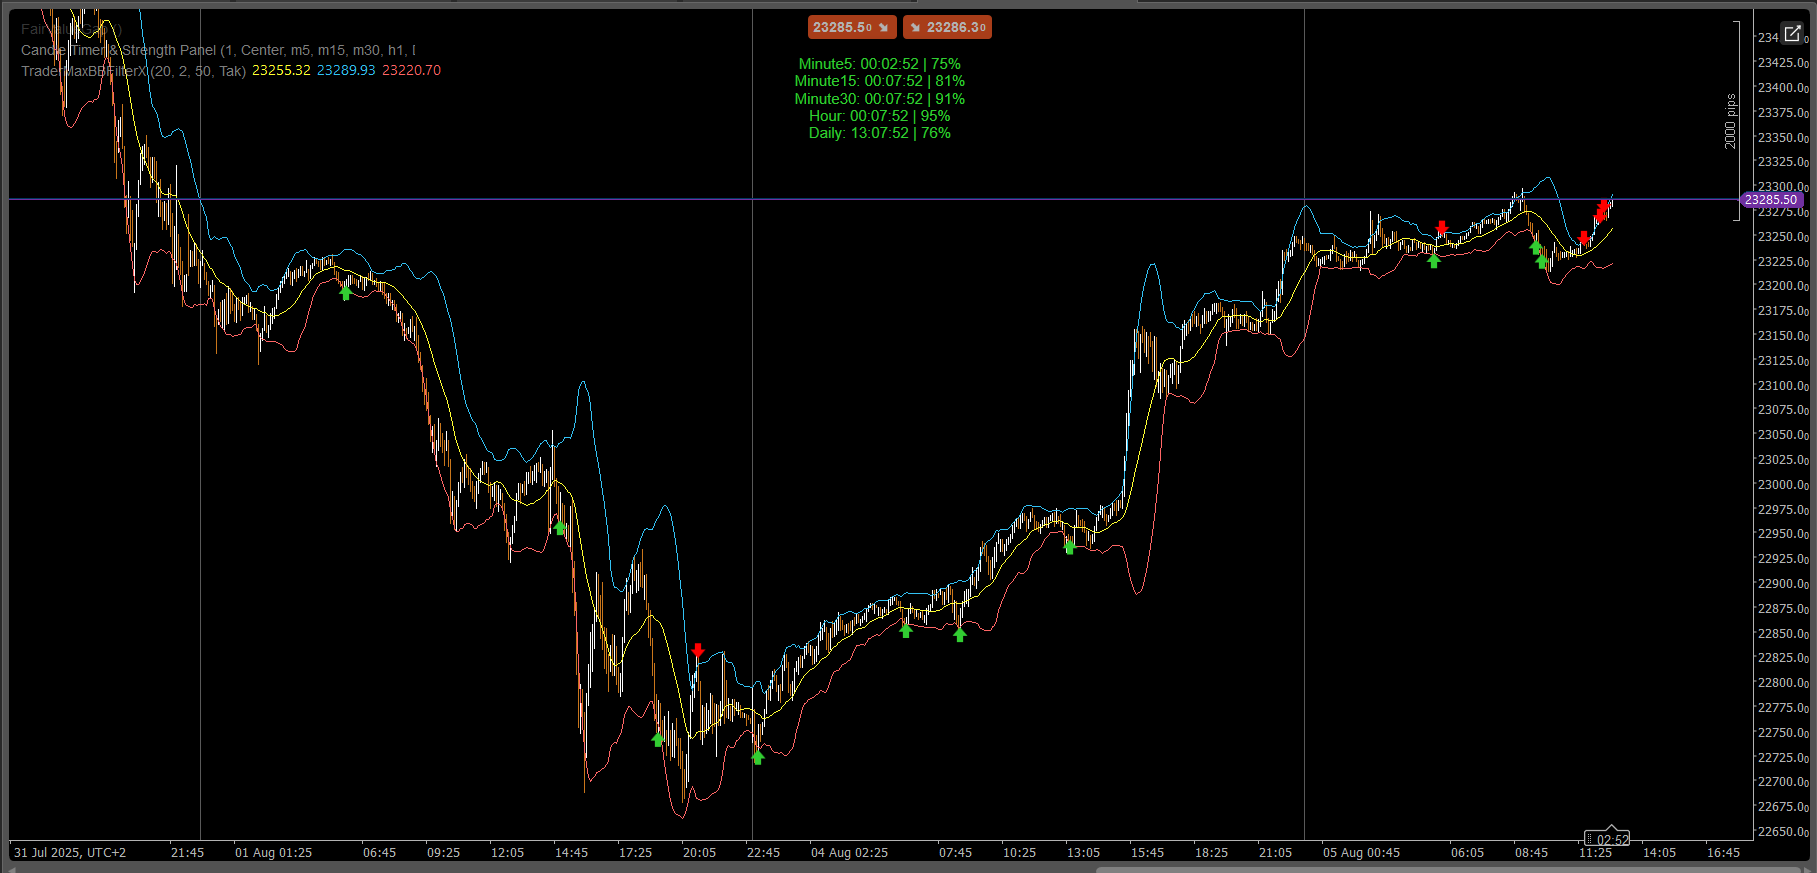
- The indicator scans the chart for local highs and lows based on your chosen sensitivity.
- Each swing is labeled as HH, HL, LH, or LL, and connected with a ZigZag line.
- When a new HH or LL appears and all filter conditions are met, you get an instant sound and/or visual alert, and an entry arrow is drawn on the chart.
- All swings can be exported to a CSV file for your records.
Recommended settings for different trading styles:
Scalping (e.g. M1, M5):
- ZigZag Sensitivity: 4
- RSI Period: 7
- RSI TimeFrame: M5
- RSI Thresholds: 80/20
- ATR Period: 7
- ATR TimeFrame: M1
Daytrading (e.g. M15, M30):
- ZigZag Sensitivity: 4
- RSI Period: 14
- RSI TimeFrame: M15
- RSI Thresholds: 70/30
- ATR Period: 14
- ATR TimeFrame: M15
Swing trading (e.g. H1, H4):
- ZigZag Sensitivity: 4
- RSI Period: 14–21
- RSI TimeFrame: H4
- RSI Thresholds: 70/30
- ATR Period: 14
- ATR TimeFrame: H4
You can adjust these settings to fit your own strategy and market conditions.
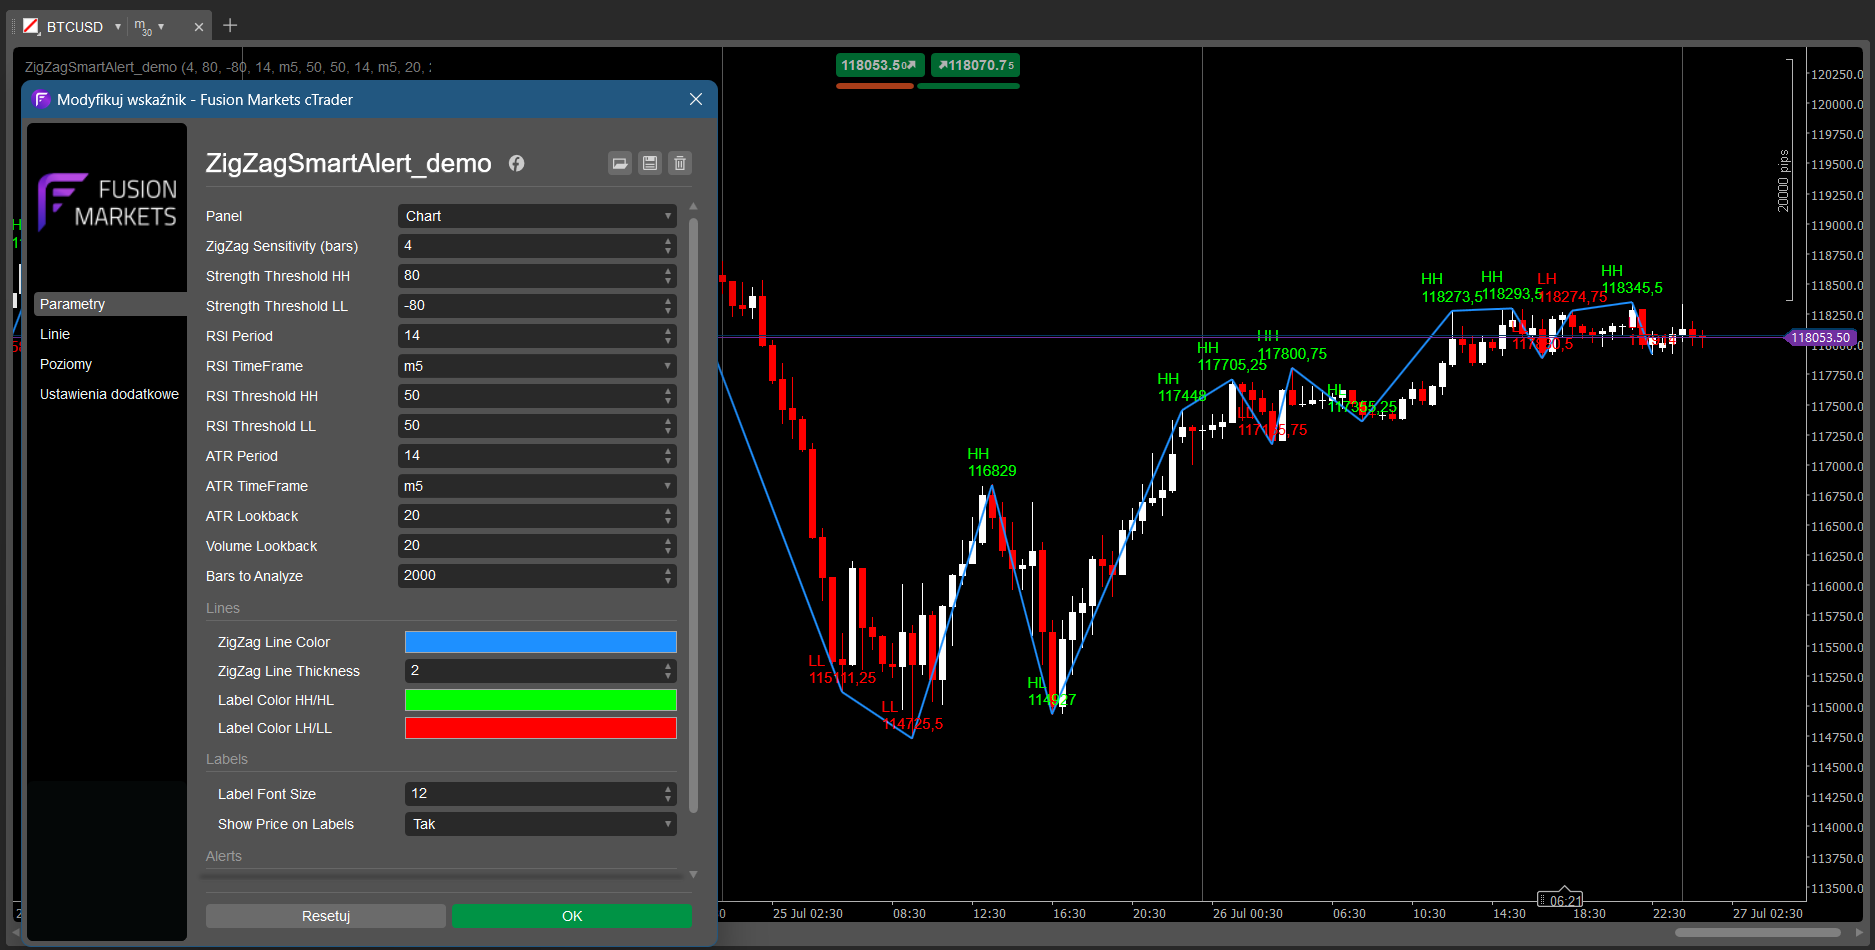
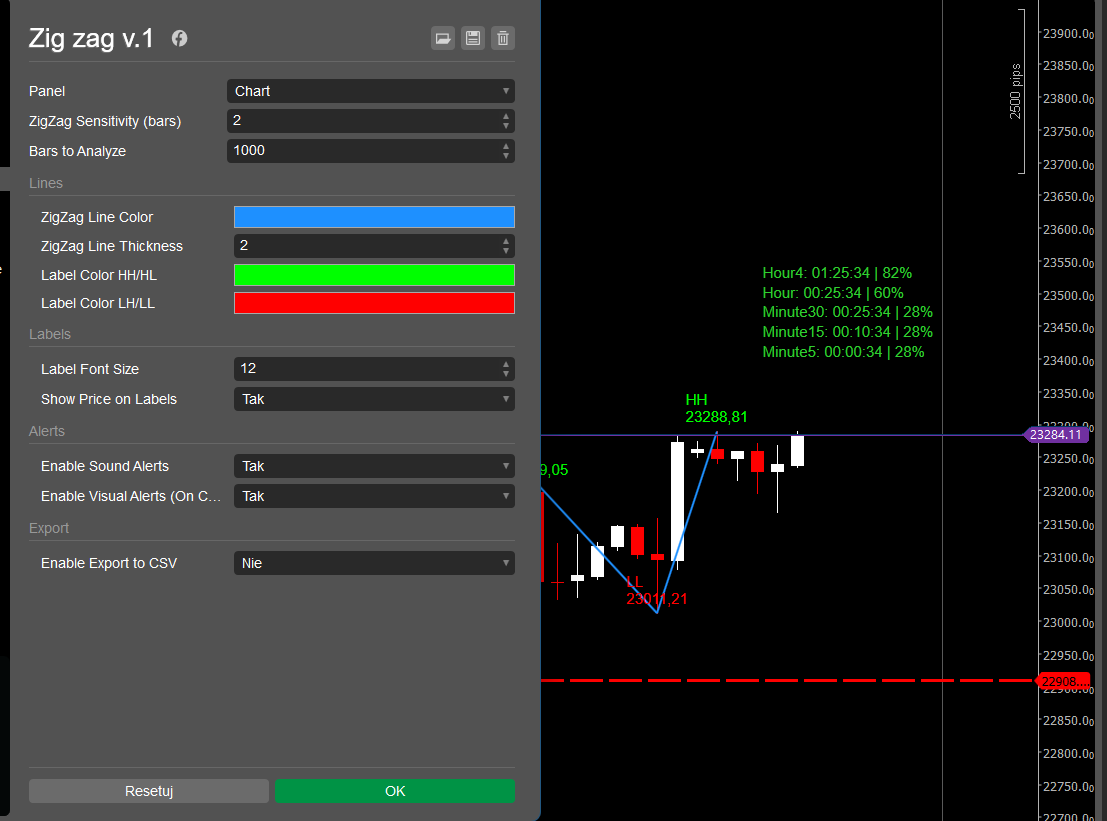
Parameters:
- ZigZag Sensitivity (bars)
- Strength Thresholds (for HH/LL)
- RSI Period & TimeFrame, RSI Thresholds
- ATR Period & TimeFrame, ATR Lookback
- Volume Lookback
- ZigZag Line Color & Thickness
- Label Colors & Font Size
- Show Price on Labels (yes/no)
- Bars to Analyze
- Enable Sound Alerts (yes/no)
- Enable Visual Alerts (yes/no)
- Enable Export to CSV (yes/no)
Why choose ZigZag Smart Alert?
- Get only the best signals – no more noise, only high-probability setups.
- Perfect for price action, SMC, ICT, and swing trading strategies.
- See exactly where to enter – with entry arrows and full context.
- Easy to use, fully customizable, and professional look.
Try ZigZag Smart Alert and take your swing trading to the next level!
Other indicators by this author:
- Candle Timer & Strength DEMO
- Candle Timer & Strength FULL
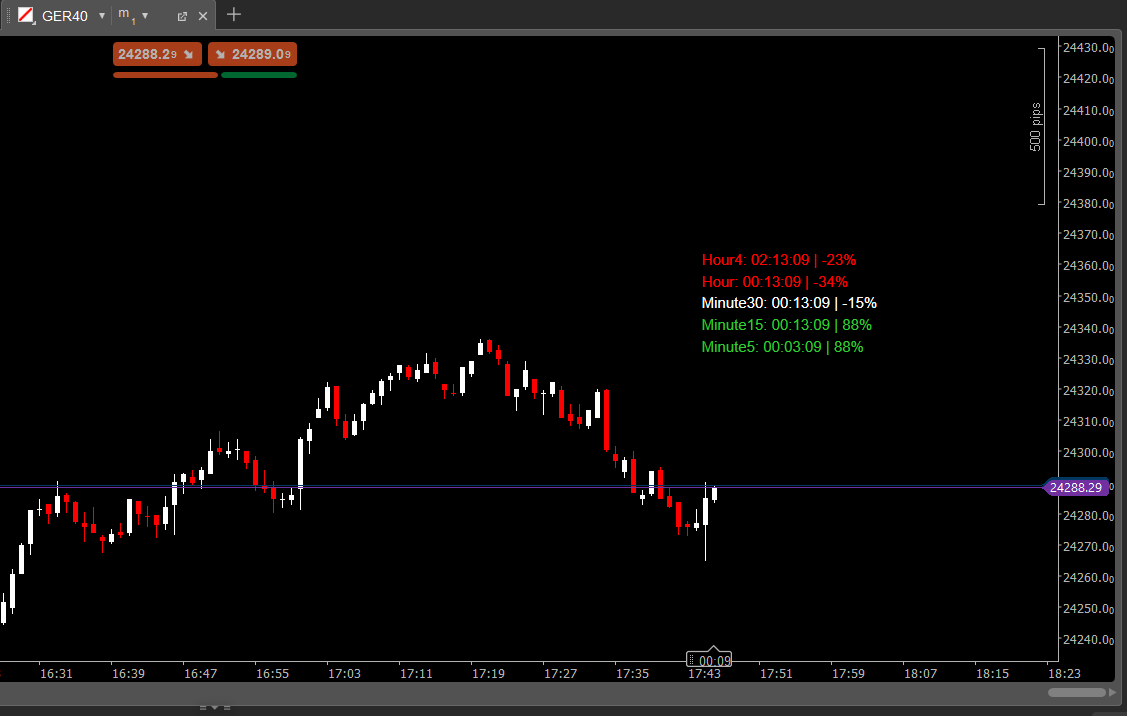
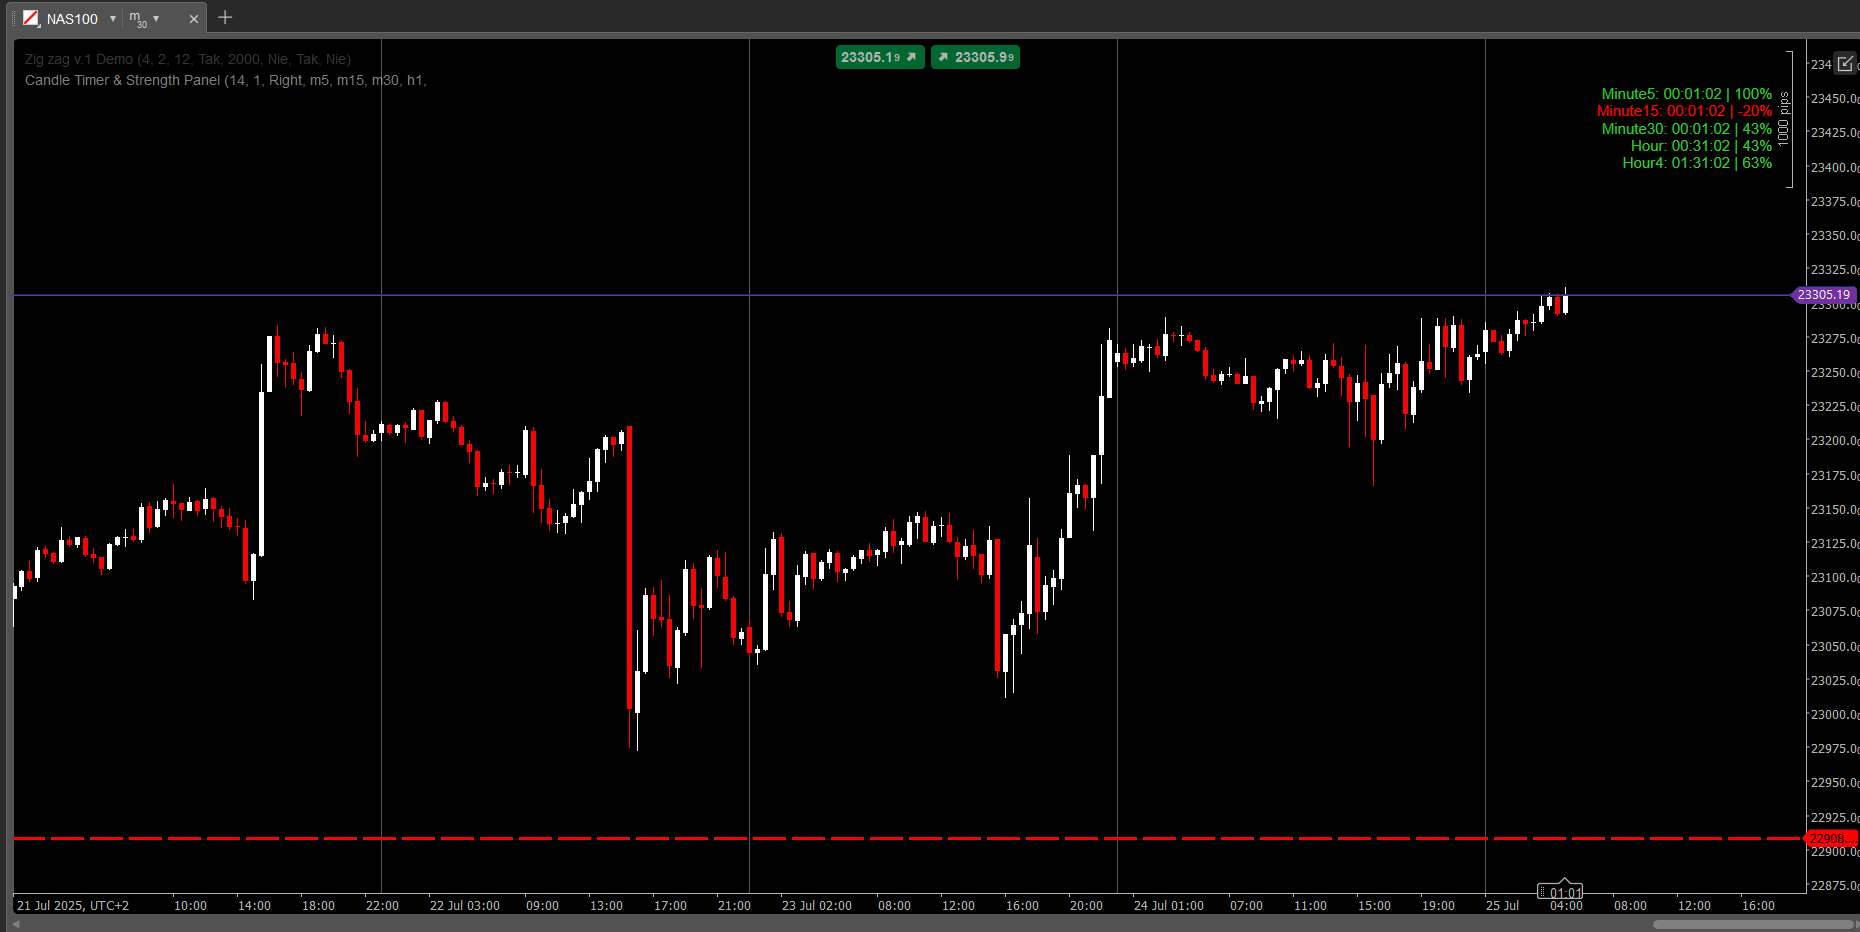
- Candle Timer & Strength Panel
- FVG MultiTF Tracker
- ZigZag Pro DEMO (add your link)
- ZigZag Pro FULL (add your link)
📩 Questions? Suggestions? Discount?
Contact available in my profile: Robikobud
https://ctrader.com/pl?search=kobud.222&u=kobud.222
http://www.youtube.com/@Robi22-22


.jpeg)