▁▂▃▄▅▆▇ █ 10,000+ traders (institutional + retail) █ ▇▆▅▄▃▂▁
- Choose our TOP indicators in cTrader 🏆
- ✨ Exclusive precision for superior results ✨
- 📈 Our algorithms —with the highest-rated visuals 🎯—
- have been successfully implemented in 2 quant funds
▁▂▃▄▅▆▇ █████████████████████████████ ▇▆▅▄▃▂▁
_______________________________________________
_______________________________________________
📌 Market Structure Indicators
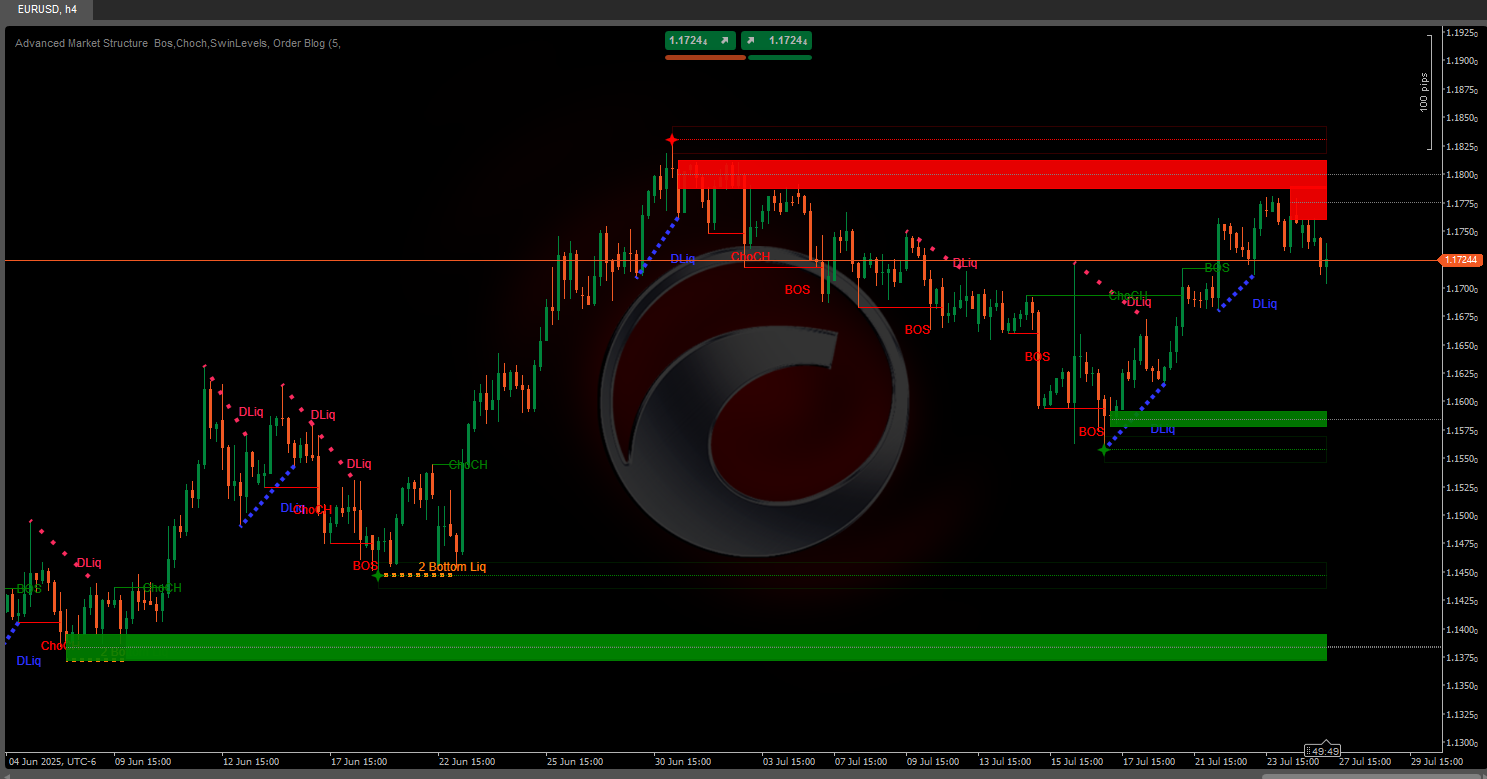
· ✅ AdvancedMarket Structure: Bos, Choch, SwinLevels, Order Blocks, Market Structure& Liquidity Finder
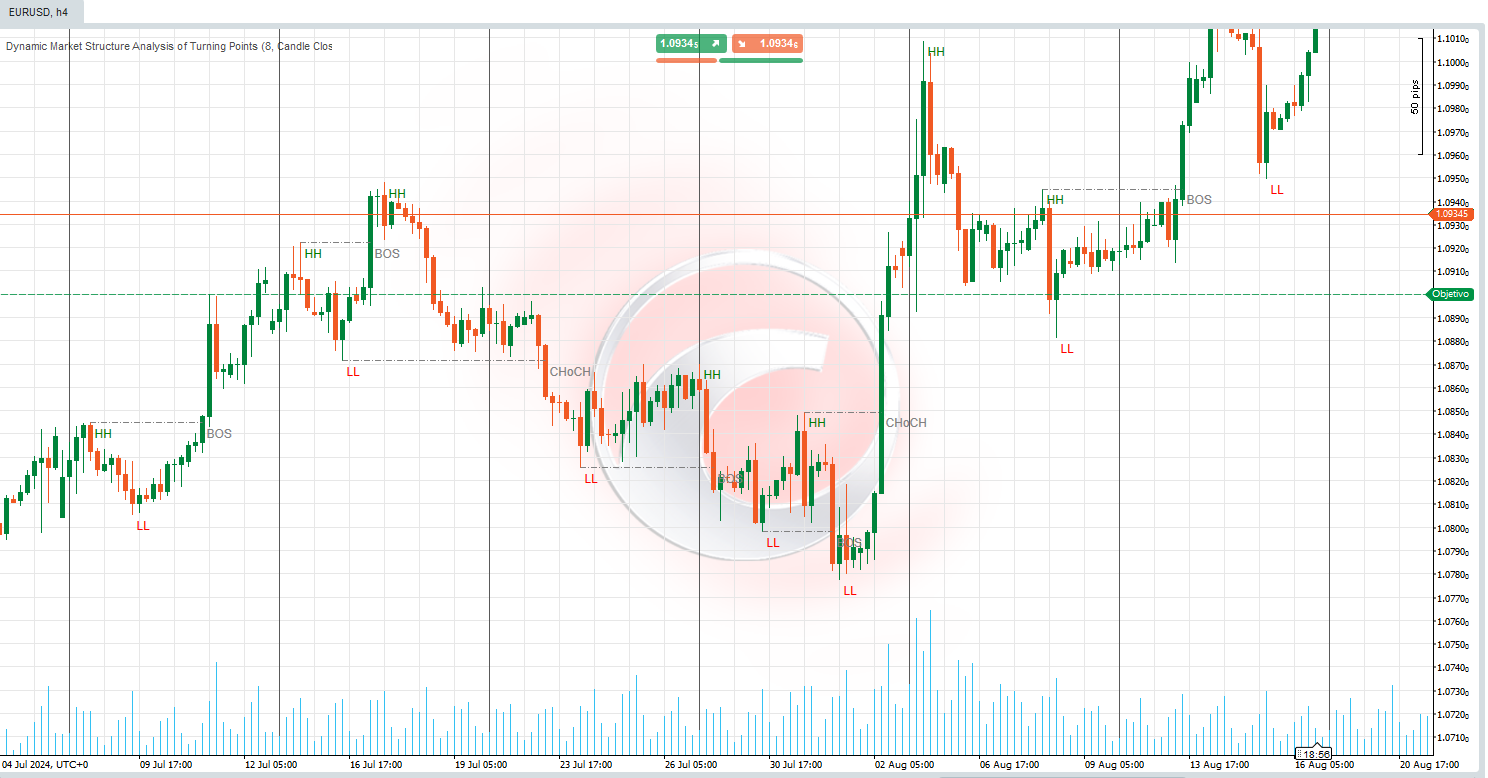
· 🔄 Dynamic Market StructureAnalysis of Turning Points
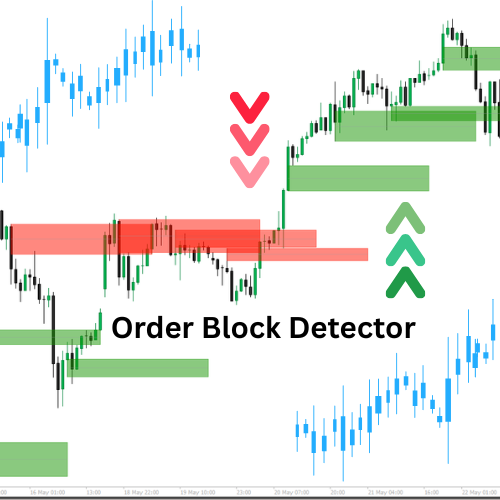
· 🧱 Order Block
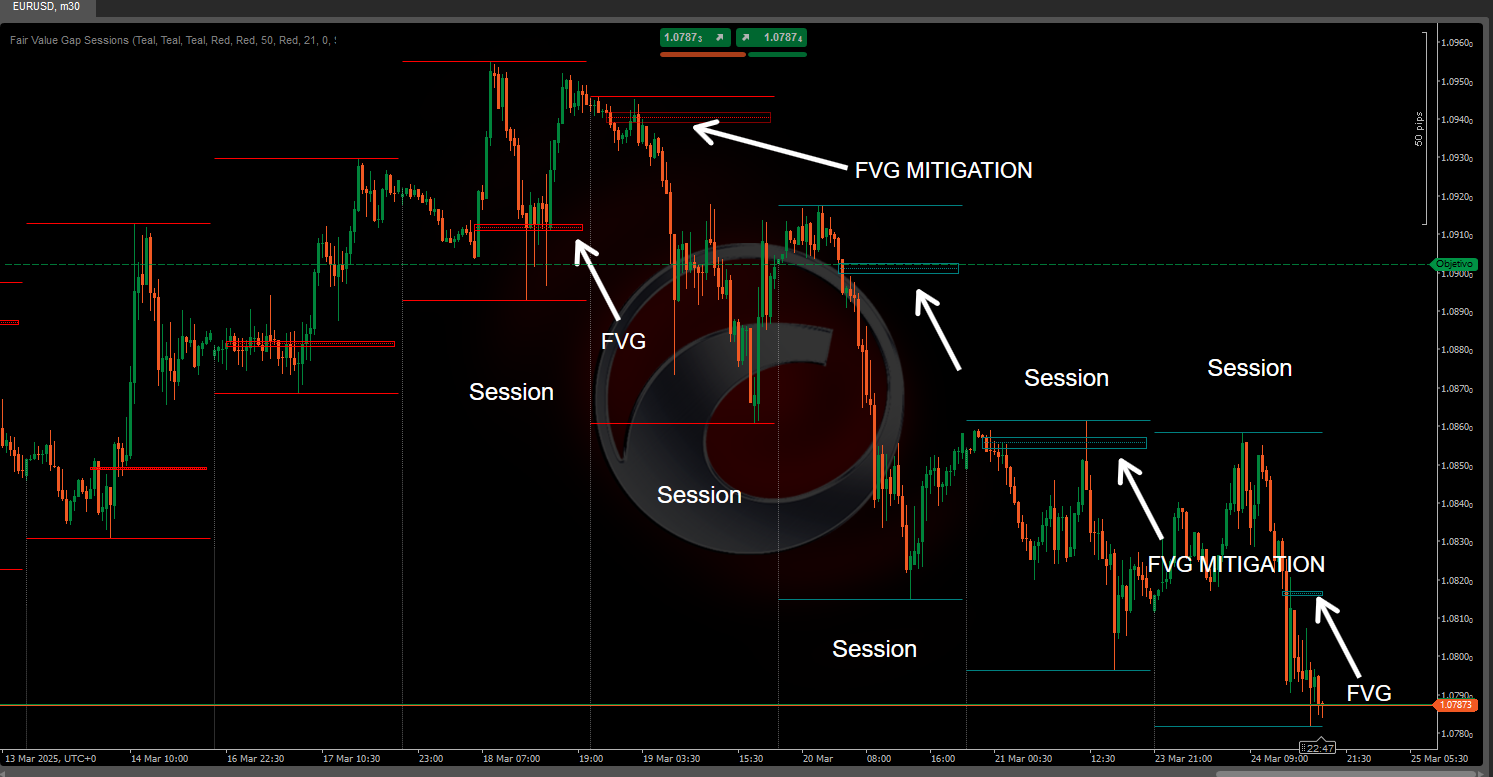
· ⚖️ Market Imbalance
· ⛓️ BOS & CHOCH
· 🧠 ICT Power of 3
______________________________________________________________-
Store cBots : 🧠 Gold & BTC BreakoutSession Pivots 🧠
_______________________________________________
🔚 Smart Exit Systems
_______________________________________________
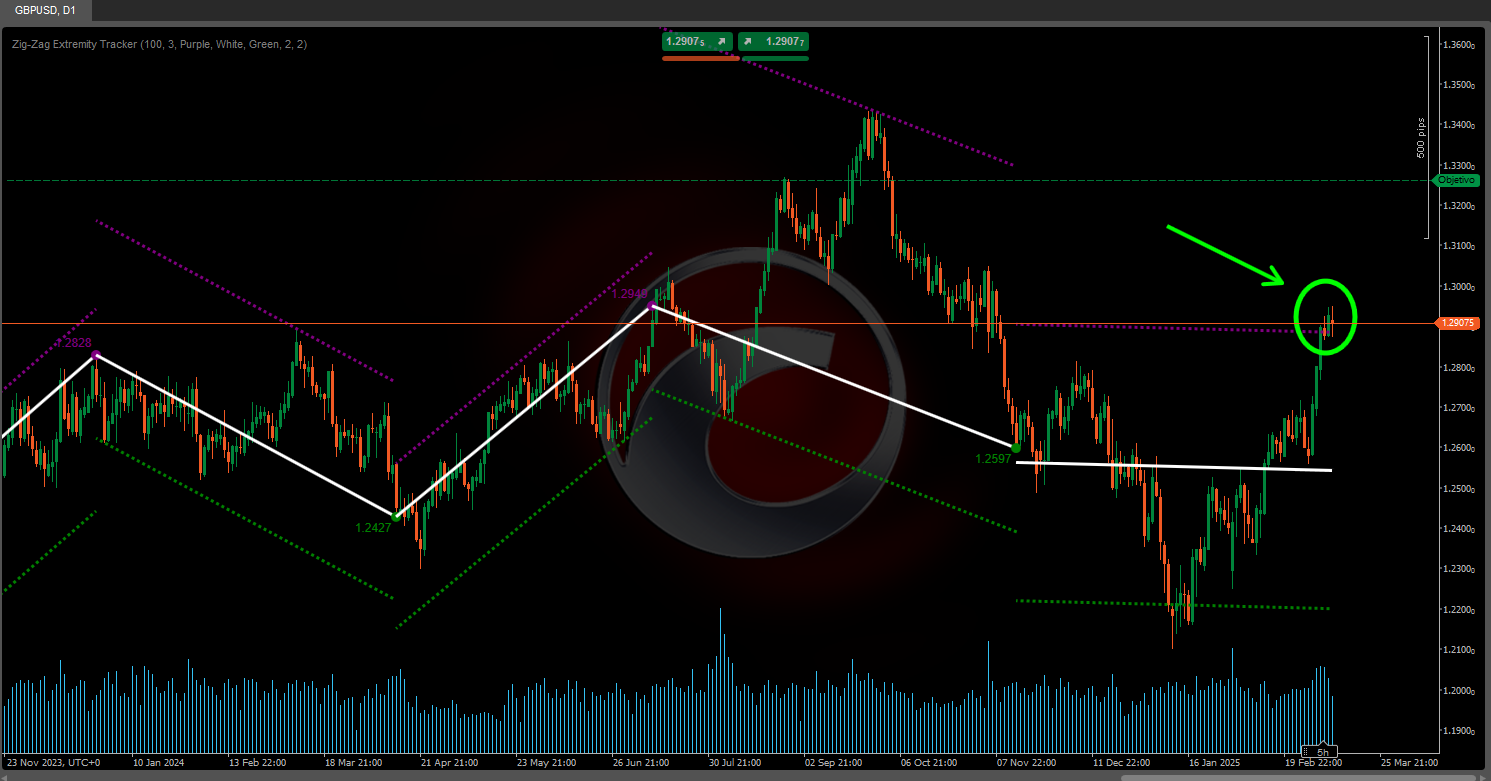
📐 ZigZag Indicators
· 🔍 ZigZag Price LiquidityProjection
· ➖ ZigZag
_______________________________________________
🧱 Support & Resistance Indicators
· 🟩 SmartTrend Support &Resistance Lines
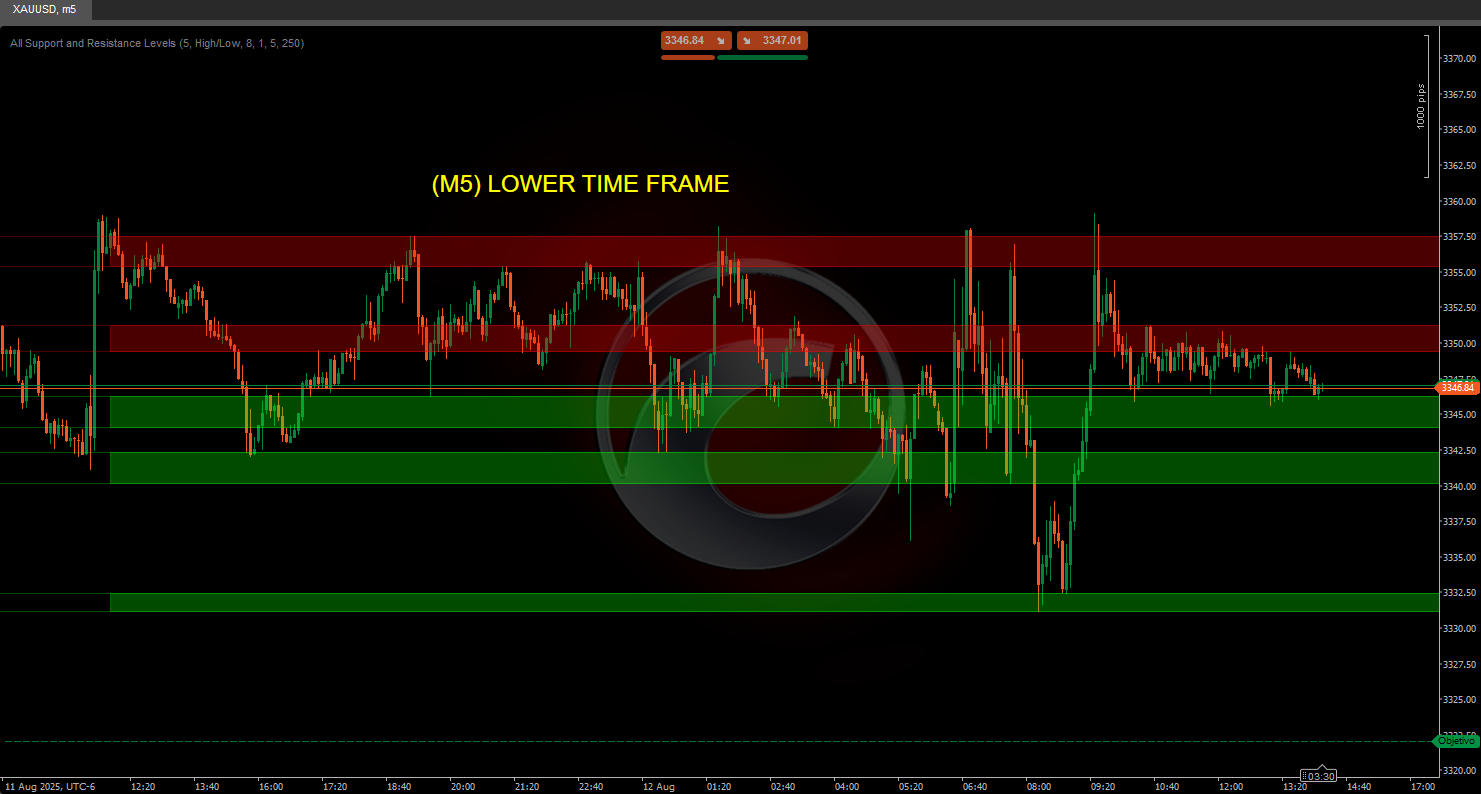
· 🧱 All Support and ResistanceLevels
_______________________________________________
📊 Trend & Channel Indicators
· 📊 Supertrend
_______________________________________________
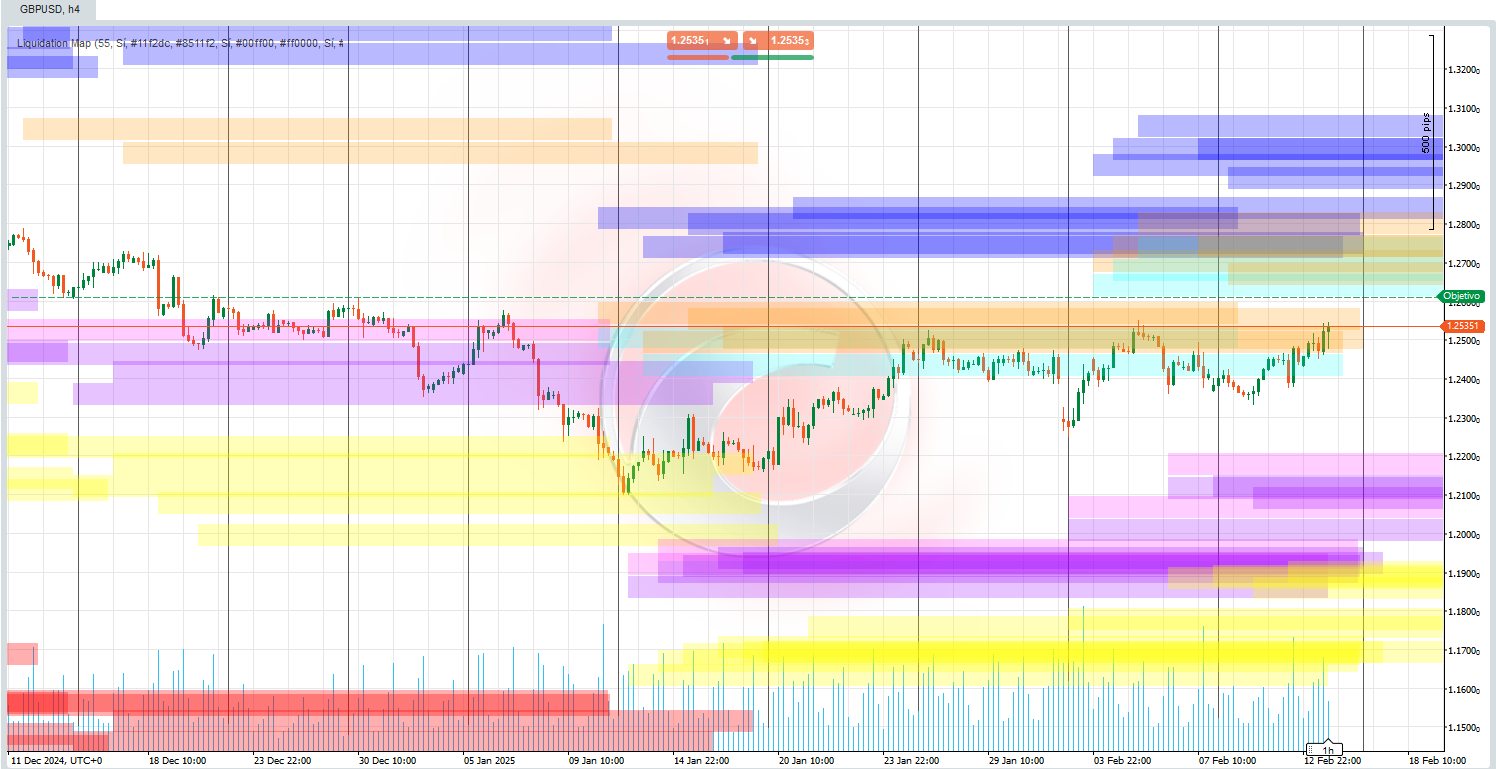
💧 Volume & Liquidity Tools
_______________________________________________
⚡ Momentum & RSI Indicators
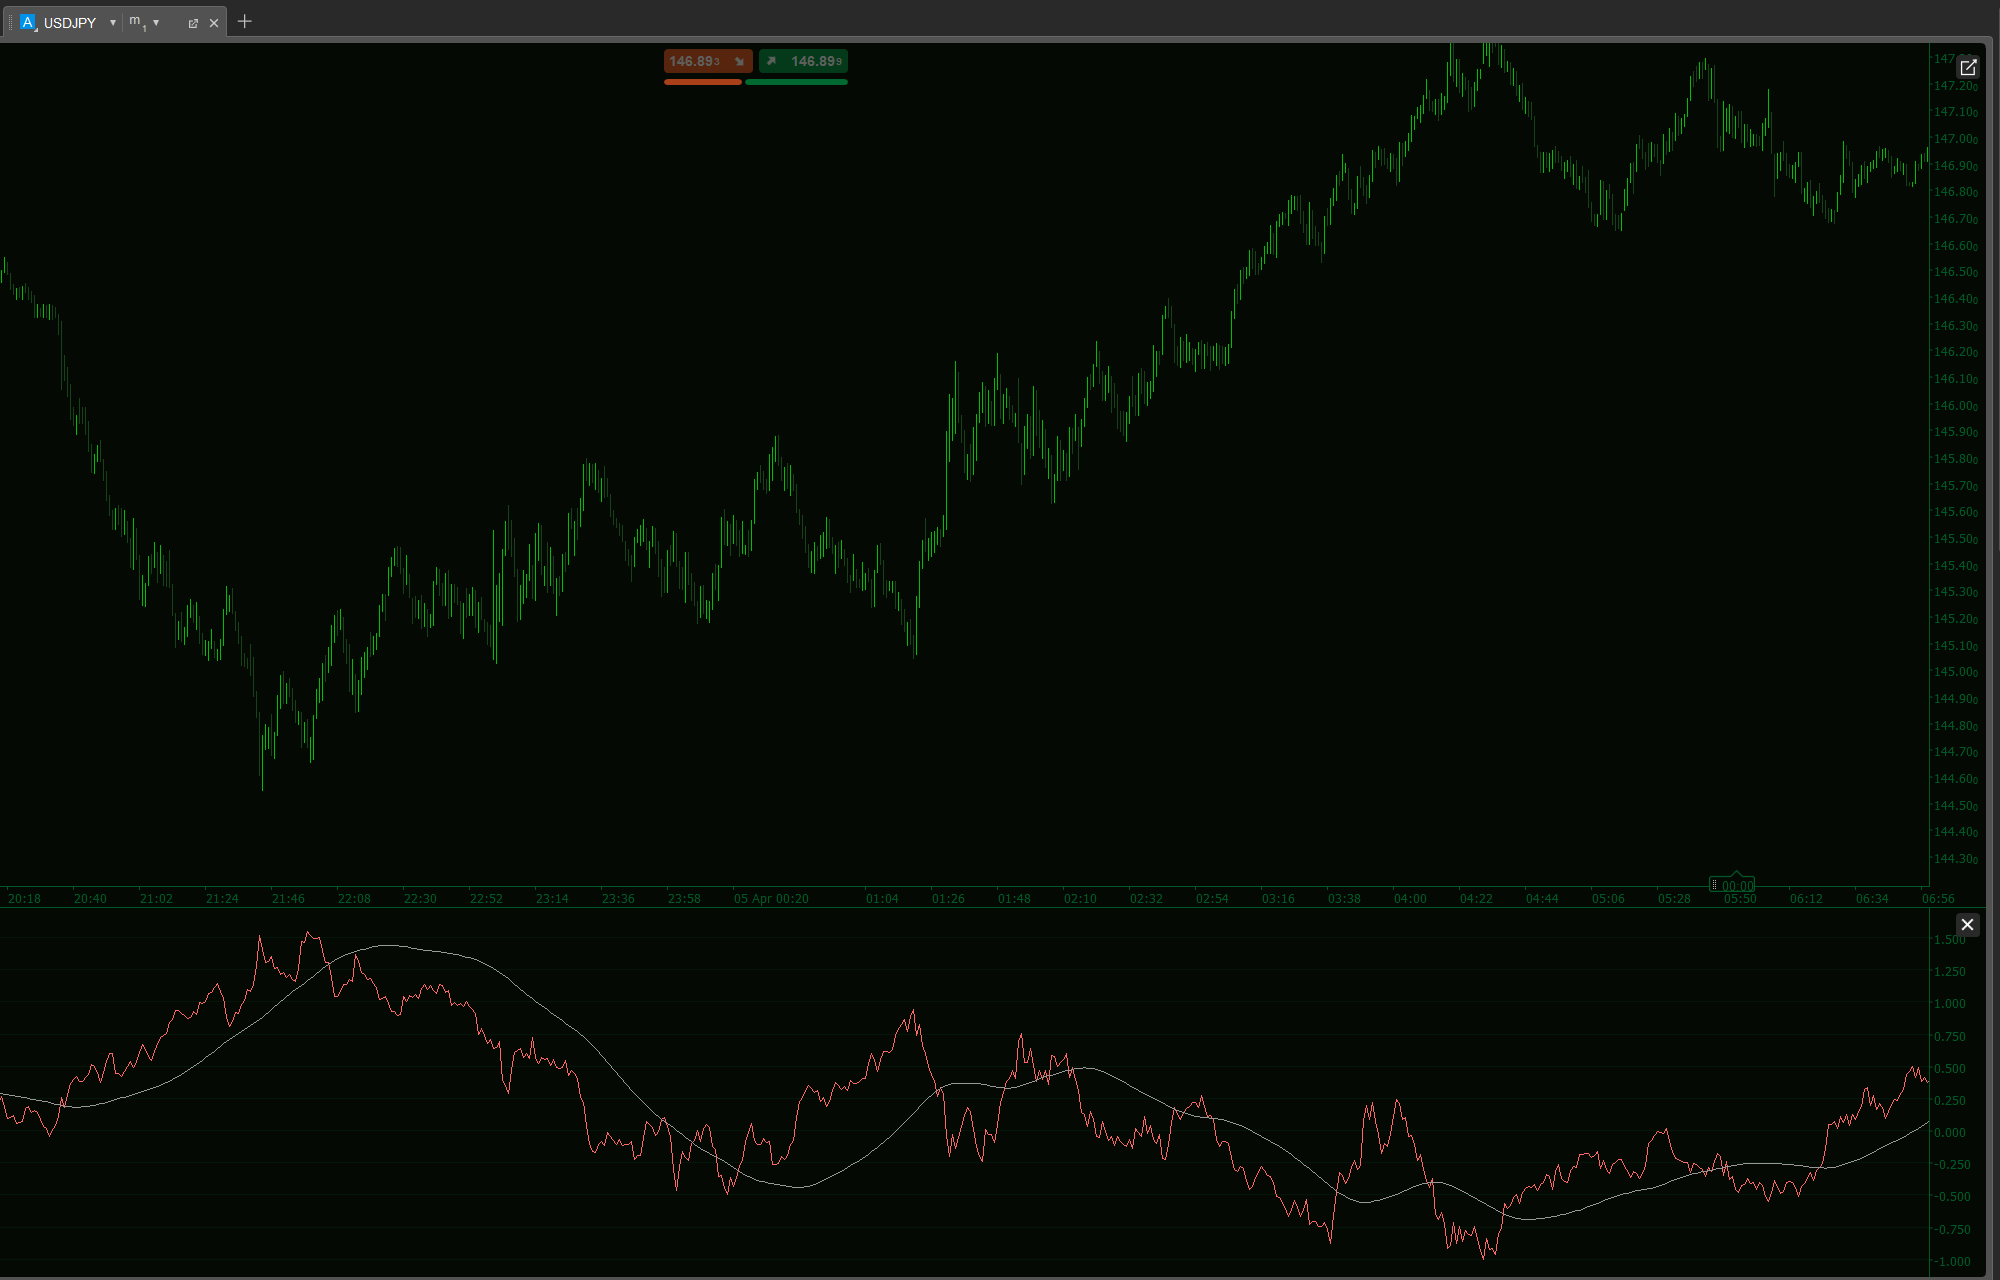
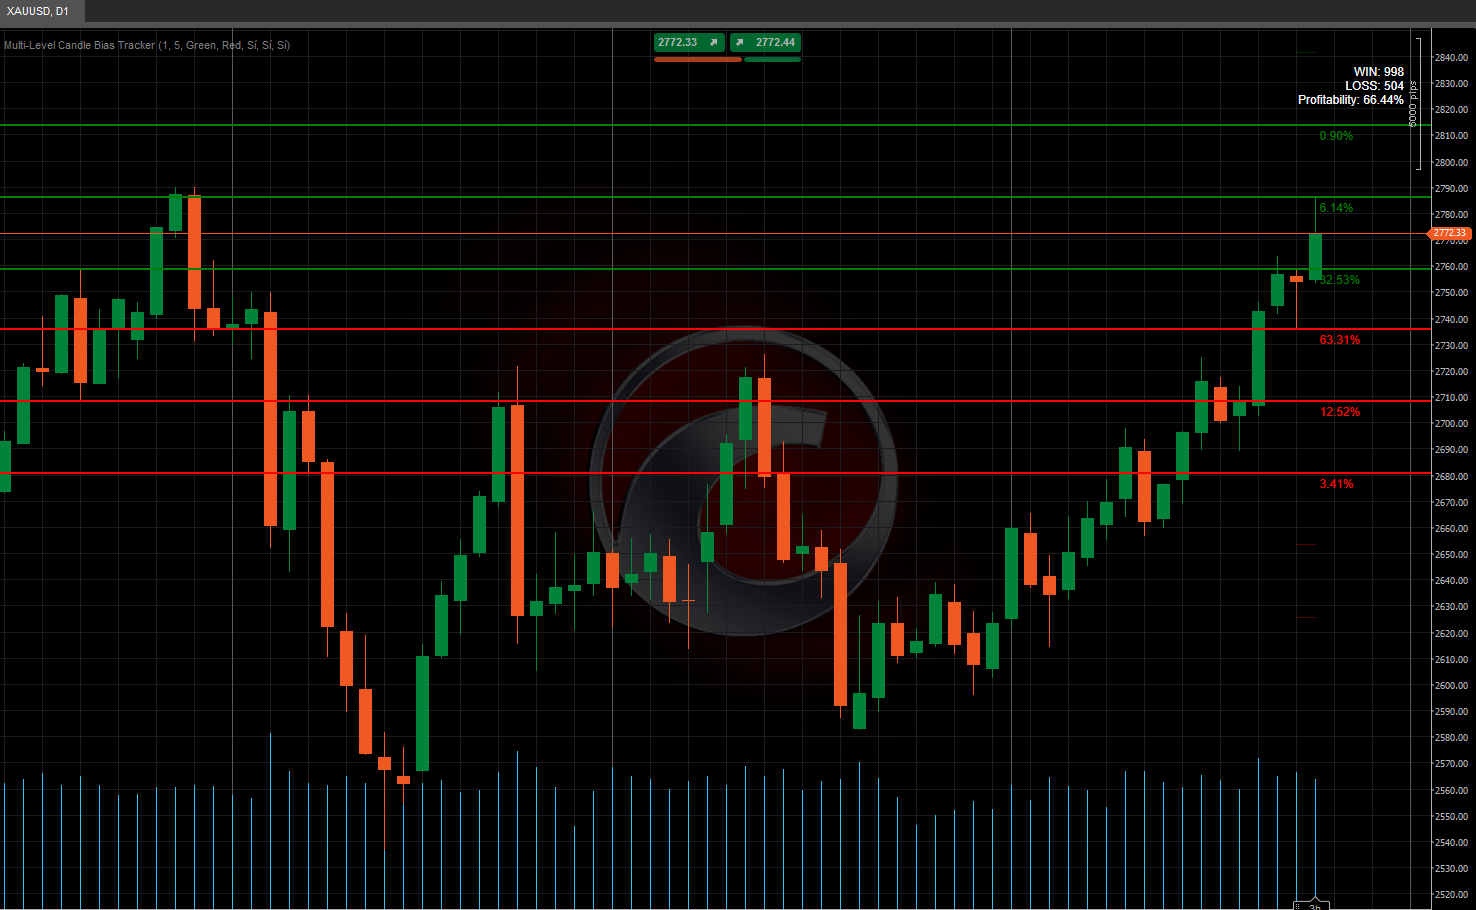
· 🔎 Multi-Level Candle BiasTracker
_______________________________________________
🔮 Prediction & Projection Tools
· 📐 Prediction Based on Linreg& ATR
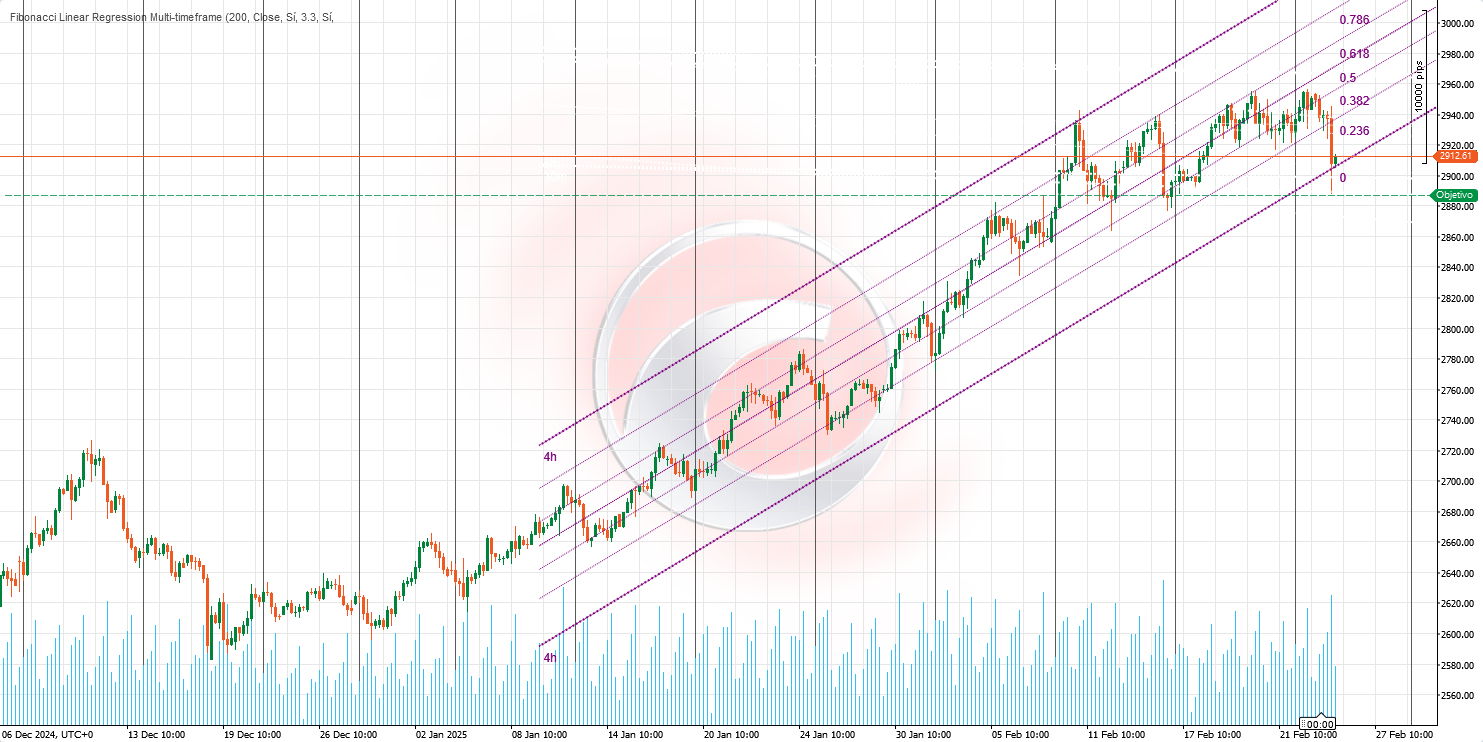
· 📏 Fibonacci Linear RegressionMulti-timeframe
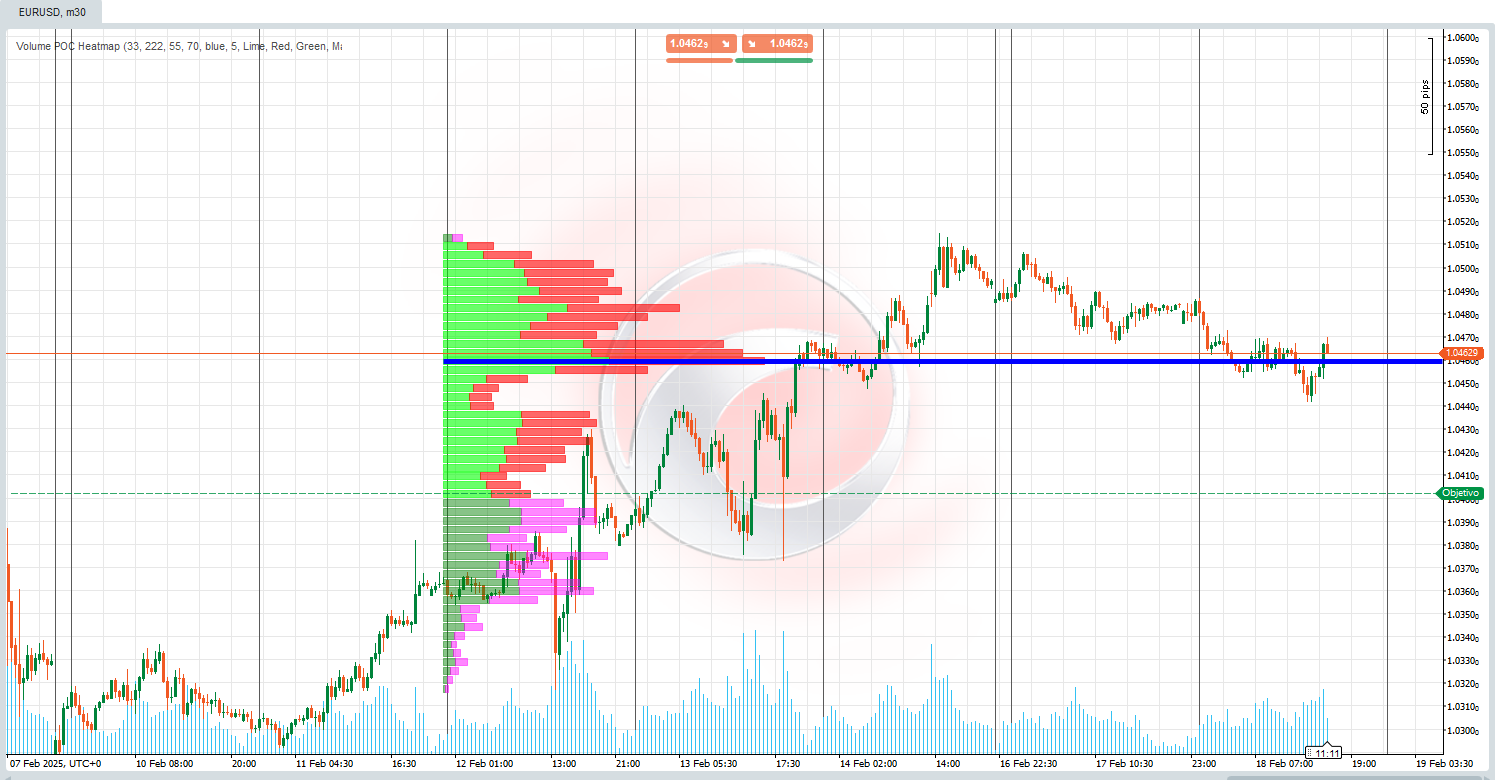
· 📈 Volume-Powered Market Flow Projector
______________________________________________________________________________________________________
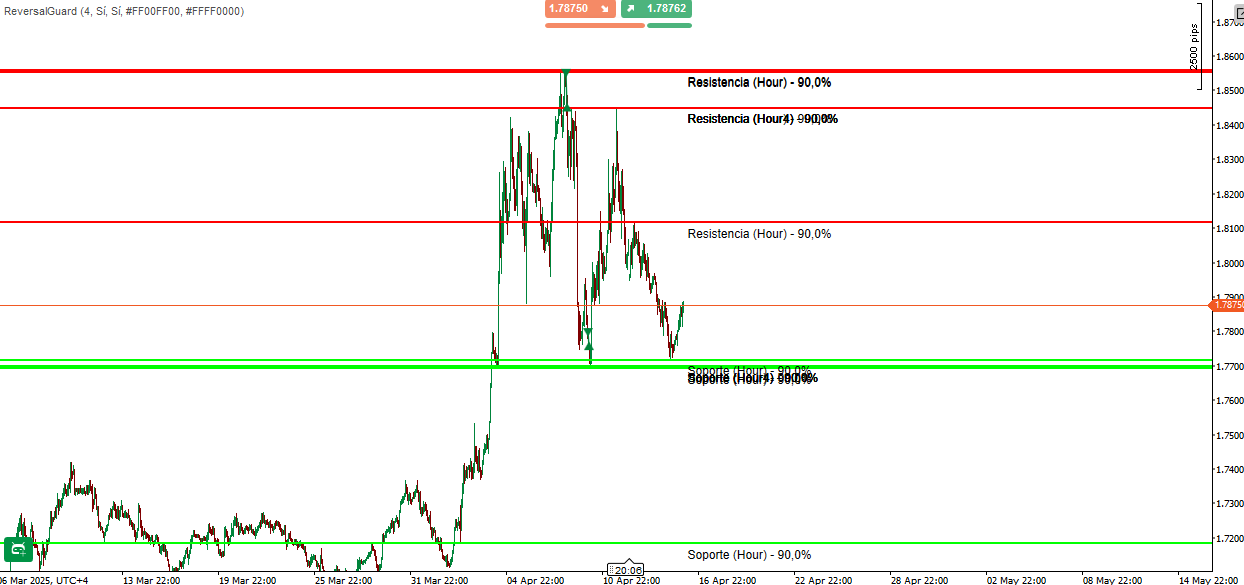
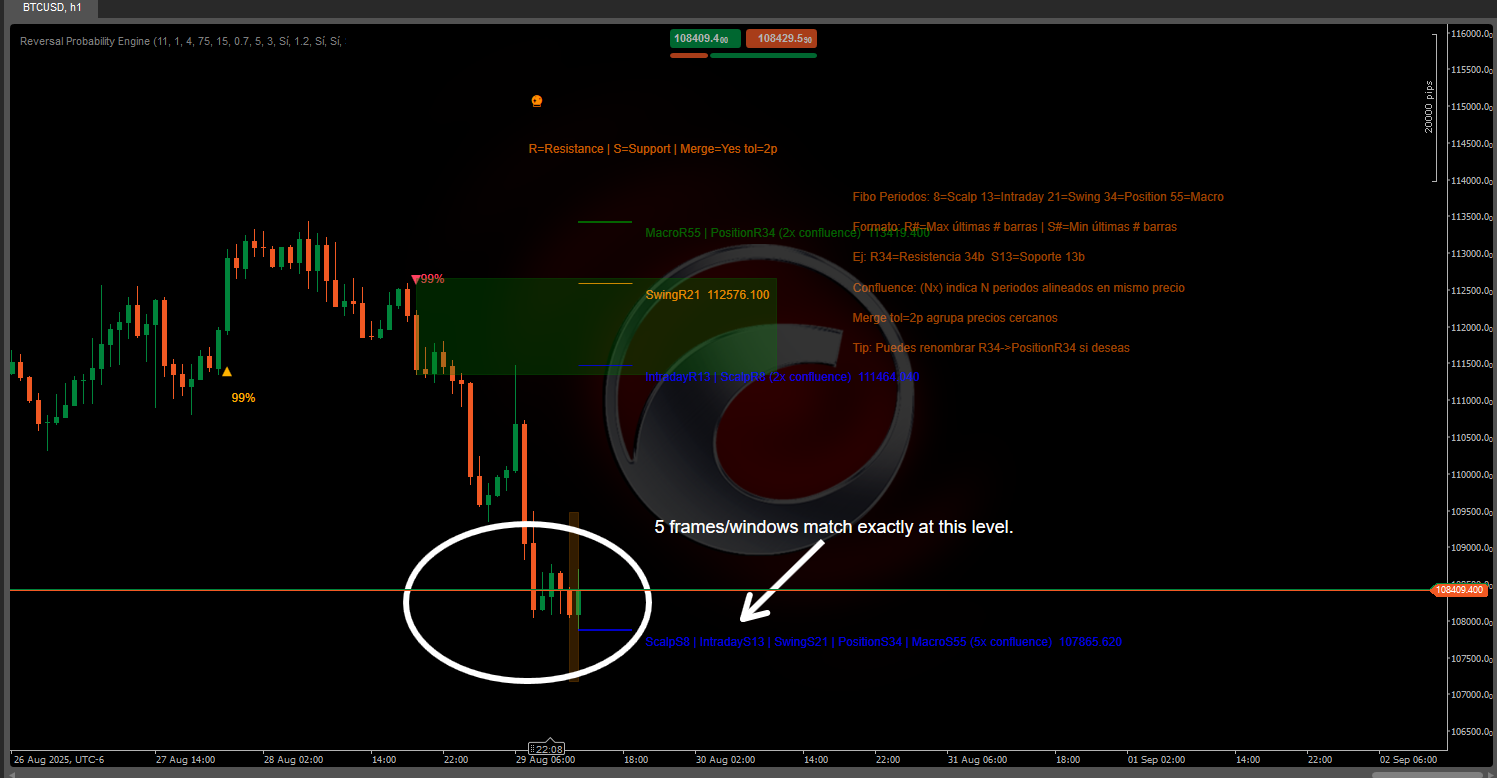
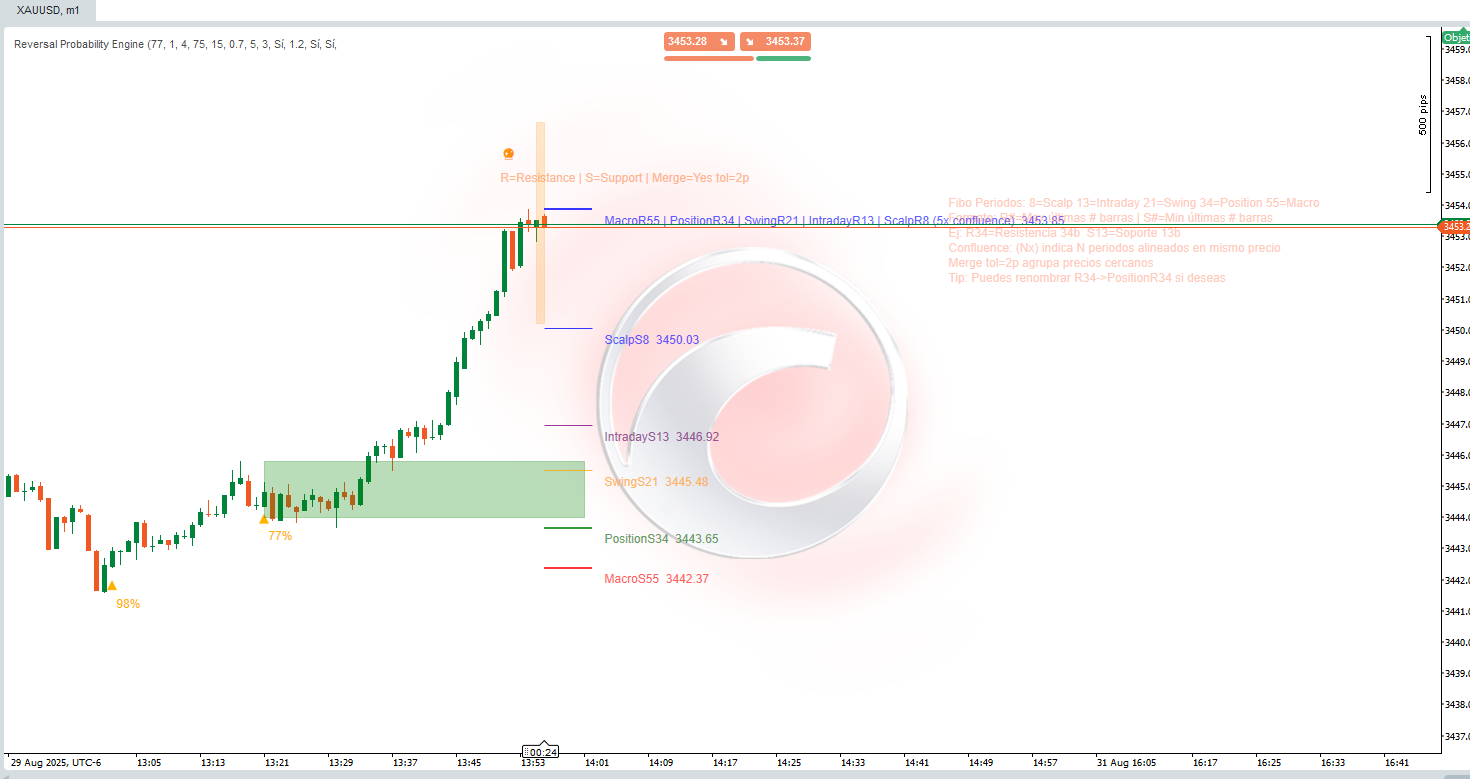
REVERSAL PROBABILITY ENGINE 🔄
A hybrid indicator for detecting reversal zones + multidimensional mapping of support and resistance "Golden Levels." It combines structure analysis (Fibonacci window highs/lows), dynamics (price velocity and acceleration), entropy/chaos (order vs. disorder), momentum, and volume to generate:
- Hierarchical support/resistance levels by time horizon.
- Probabilistic signals of potential reversal (peaks and valleys) with a % confidence. ⚠️
- Active zones (rectangle) to contextualize trades and stops.
- Confluence clusters (when multiple timeframes coincide at the same price). 🎯
2. Objective
Reduce visual noise and facilitate decision-making by identifying:
- Where price has been compressed or anchored across various horizons.
- Where the statistical probability of a reversal increases (confirmed or anticipated). 📊
- Which levels have the greatest "weight" (confluence).
3. Conceptual Logic
a) Levels: For each Fibonacci window, the recent high (R) and low (S) are taken; this provides a fractal scale of contexts (ultra-short to macro).
b) Fusion: If several distinct levels fall within X pips, they are grouped → a cluster with a combined label and confluence count.
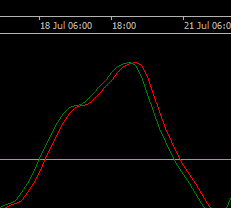
c) Reversal Signals: Local exhaustion patterns (wave form), deceleration (slope change), low entropy drop (low entropy = more directional movement predisposed to reverse), possible internal divergences, and momentum/volume validations are sought.
d) Predictive Mode: Allows anticipating reversals (diamond) before full confirmation if contrary acceleration + low entropy + extreme state align. 💎
e) Probability: Normalized weighting of various factors (trend, chaos, momentum, volume, divergence, adaptation). Truncated result 40–99%.
f) Active Zone: After a signal, the most logical range (between relevant levels) is sought to manage the trade and contextualize stops.
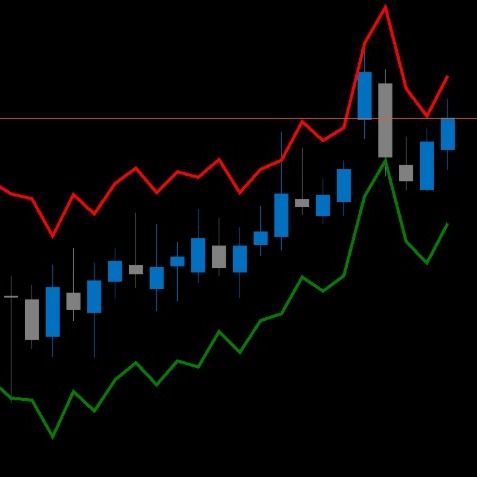
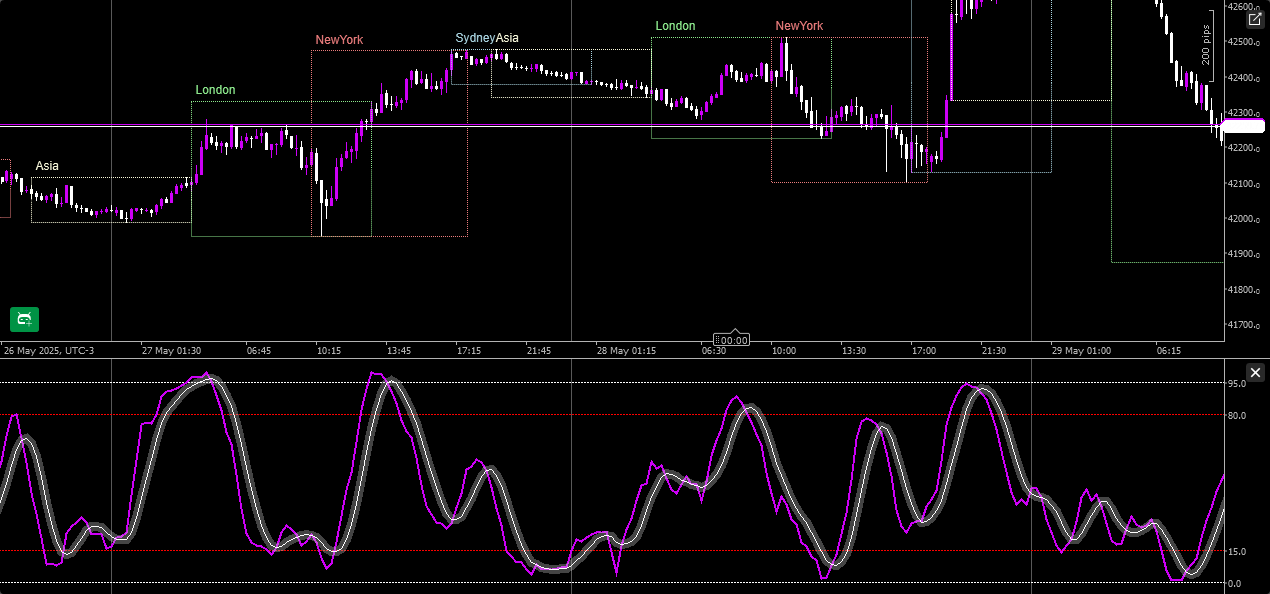
4. Visual Components
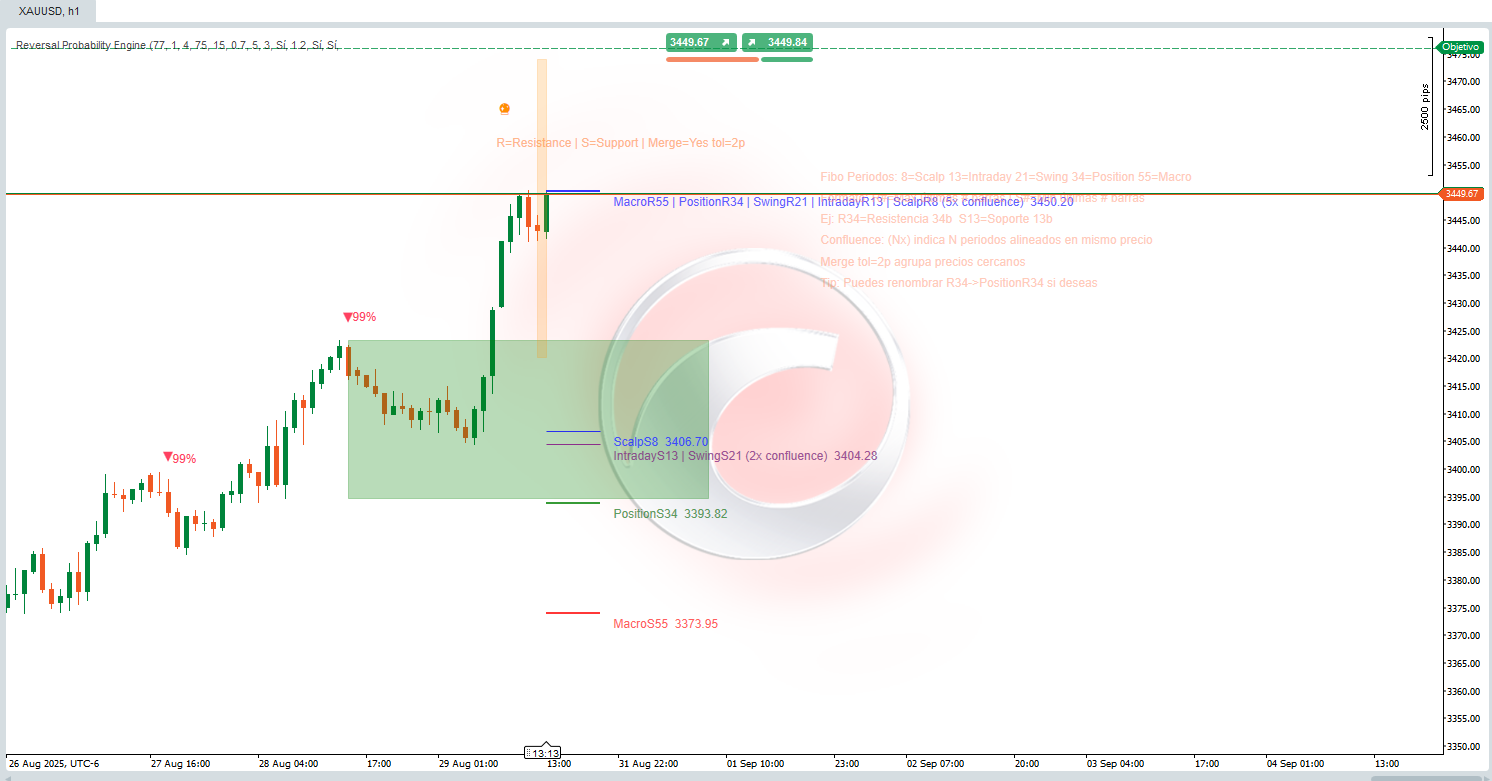
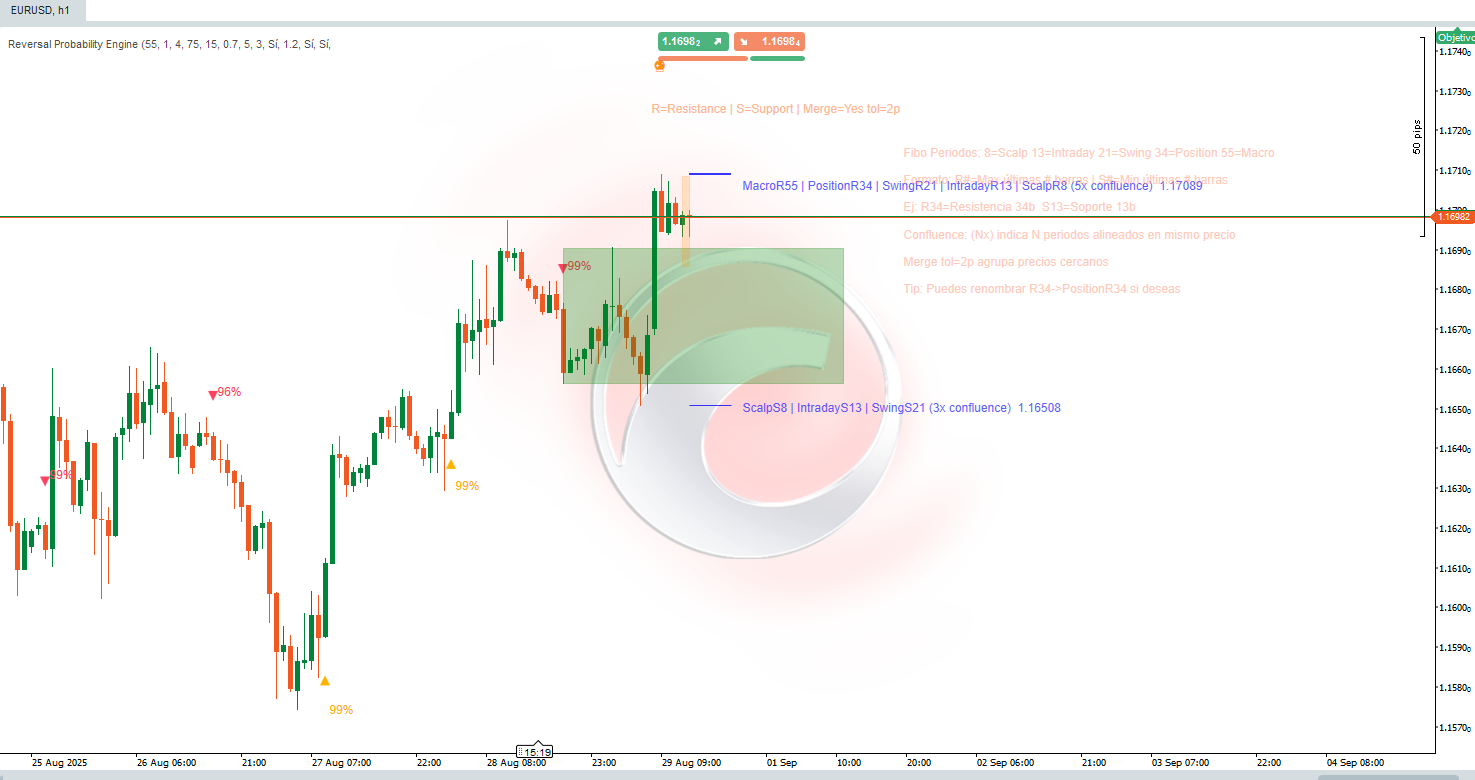
- Horizontal lines: Levels by period (Scalp 8, Intraday 13, Swing 21, Position 34, Macro 55). Consistent color per horizon.
- R#/S# Labels: R = Resistance (recent high of that window), S = Support (recent low). E.g.: R34 = resistance derived from the last 34 candles.
- Merged Labels:
ScalpS8 | IntradayS13 | … (5x confluence) Price. Indicates that N distinct periods yield the same level (or within tolerance). The more, the greater the relevance. ✅ - (Nx confluence): Number of coinciding periods.
- Merge tol=Xp: Tolerance in pips that groups nearby levels (avoids saturation).
- Probabilities (%): Text above/below triangles (Down / Up) or diamond (early detection).
- Green rectangle (active zone): Dynamic operational channel where post-signal evolution is evaluated.
- Additional subtle blocks/colors: Support elements (waves/particles) if activated.
5. Practical Interpretation
- High confluence (≥3x) = strong "magnet" or pivot level; watch for price reaction. 🧲
- Signal + nearby confluence reinforces validity (but does not guarantee).
- Probability ≥ Min Confidence %: Minimum filter to consider action.
- Differentiate Anticipated (diamond) vs. Confirmed (triangle): The anticipated offers better risk/reward, higher false rate; the confirmed arrives with less asymmetry but more validation.
- Rectangle: If price remains inside and does not invalidate the opposite edge, the thesis remains alive; a clean break reduces expectation.
- Expand or decrease MergeTolerance: Smaller = greater granularity, Larger = more synthesized clusters.
6. Usage Flow
- Load the indicator on the desired instrument and timeframe.
- Adjust the Min Confidence % according to tolerance (e.g., lower for scalping, higher for swing).
- Check if a multiple support/resistance cluster appears (5x, 4x, etc.).
- Wait for a signal (ideal if it arises on the periphery of the cluster and with high probability). 🔔
- Delimit management within the active zone: staggered entry or confirmation of failed breakout.
- Define a logical stop: beyond the first lower (in long) or upper (in short) level not present in the confluence.
- Deactivate periods you don't use (e.g., only Swing/Macro for long positions).
- Adjust tolerance and, optionally, hide the explanatory panel once learned.
7. Quick Label Reading ExampleScalpS8 | IntradayS13 | SwingS21 | PositionS34 | MacroS55 (5x confluence)
Meaning: All timeframes (8–55) share the same floor → multi-scale structural support. Higher probability of reaction; if lost with volume, it implies a more serious regime change. 🚨


.png)