Indicator
Signal
FairValueGap-PremiumVersion1
"FairValueGap-PremiumVersion1" logo
03/09/2025
6
Desktop
SinceĀ 19/04/2025
Traded volume
284.2M
Pips won
1.07M
Sales
6
Free installs
1341
"FairValueGap-PremiumVersion1" uploaded image"FairValueGap-PremiumVersion1" uploaded image"FairValueGap-PremiumVersion1" uploaded image"FairValueGap-PremiumVersion1" uploaded image"FairValueGap-PremiumVersion1" uploaded image"FairValueGap-PremiumVersion1" uploaded image"FairValueGap-PremiumVersion1" uploaded image"FairValueGap-PremiumVersion1" uploaded image

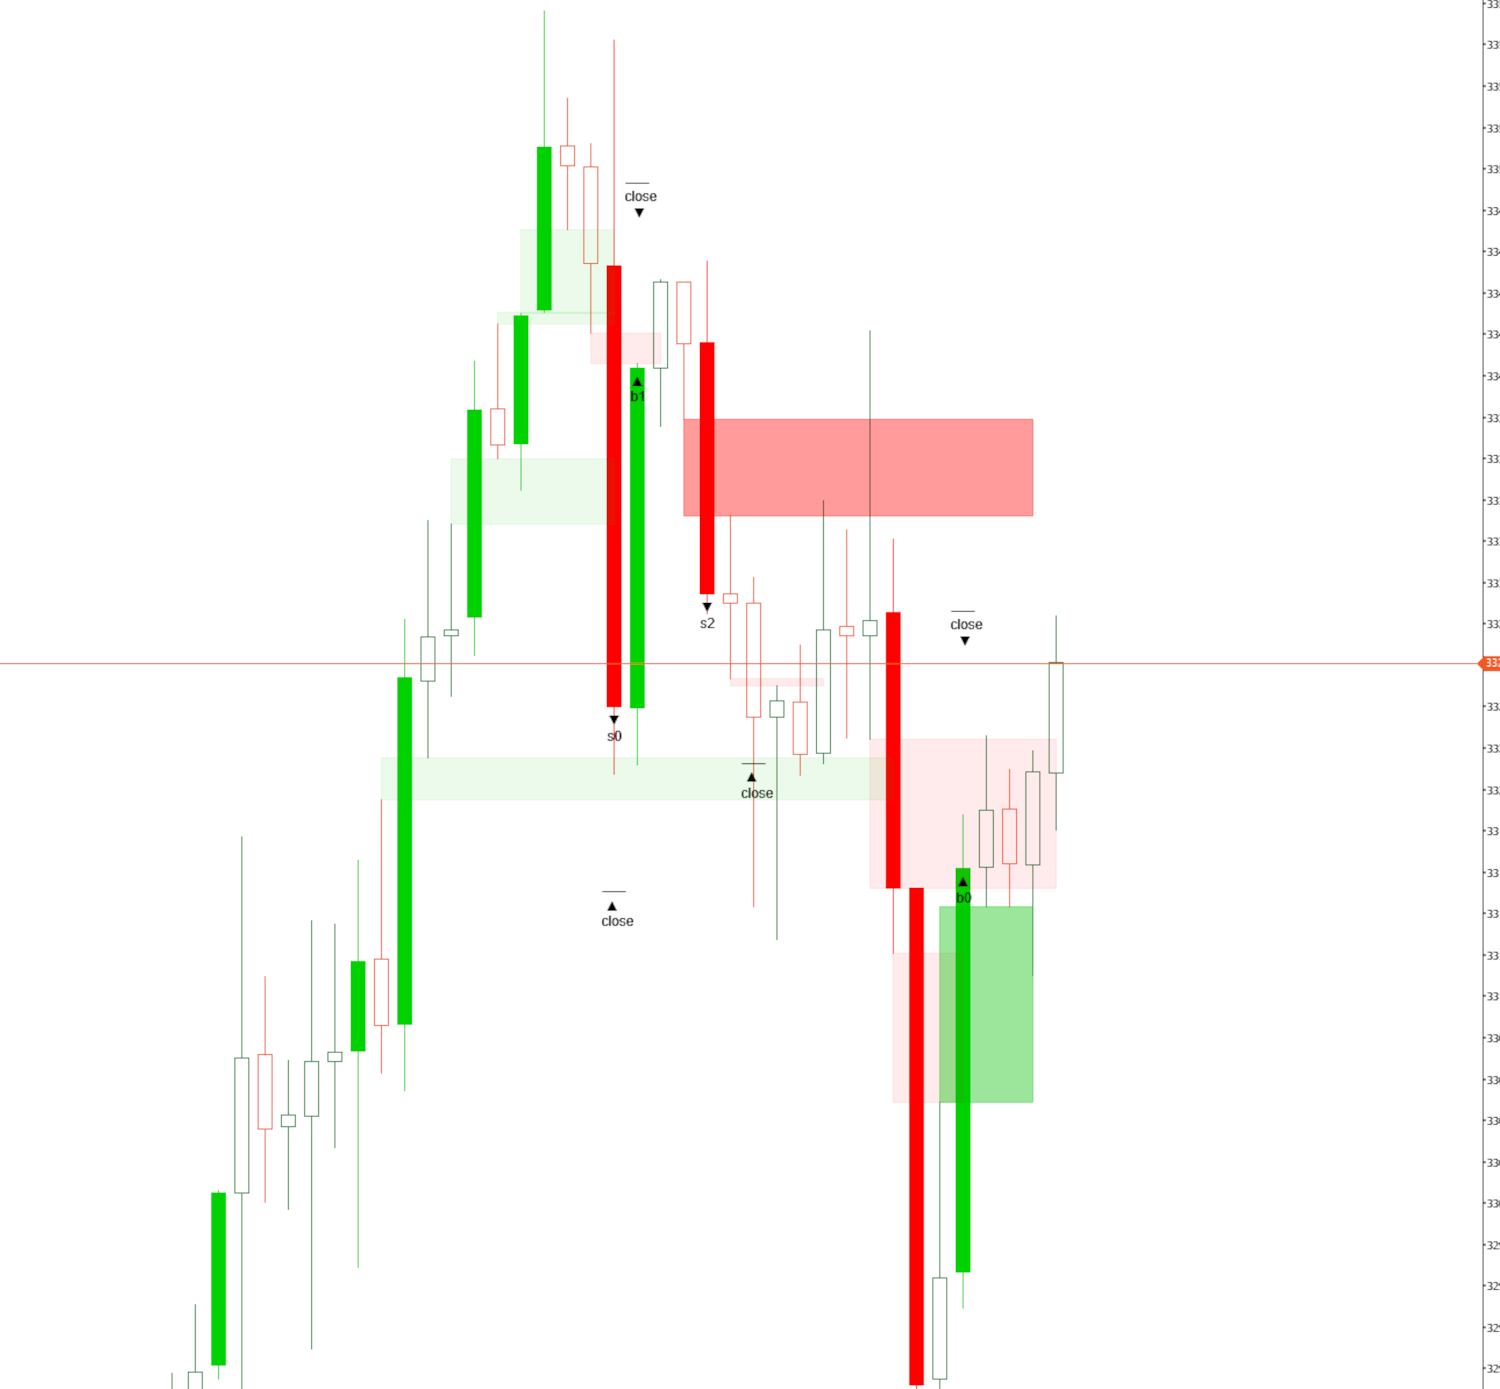
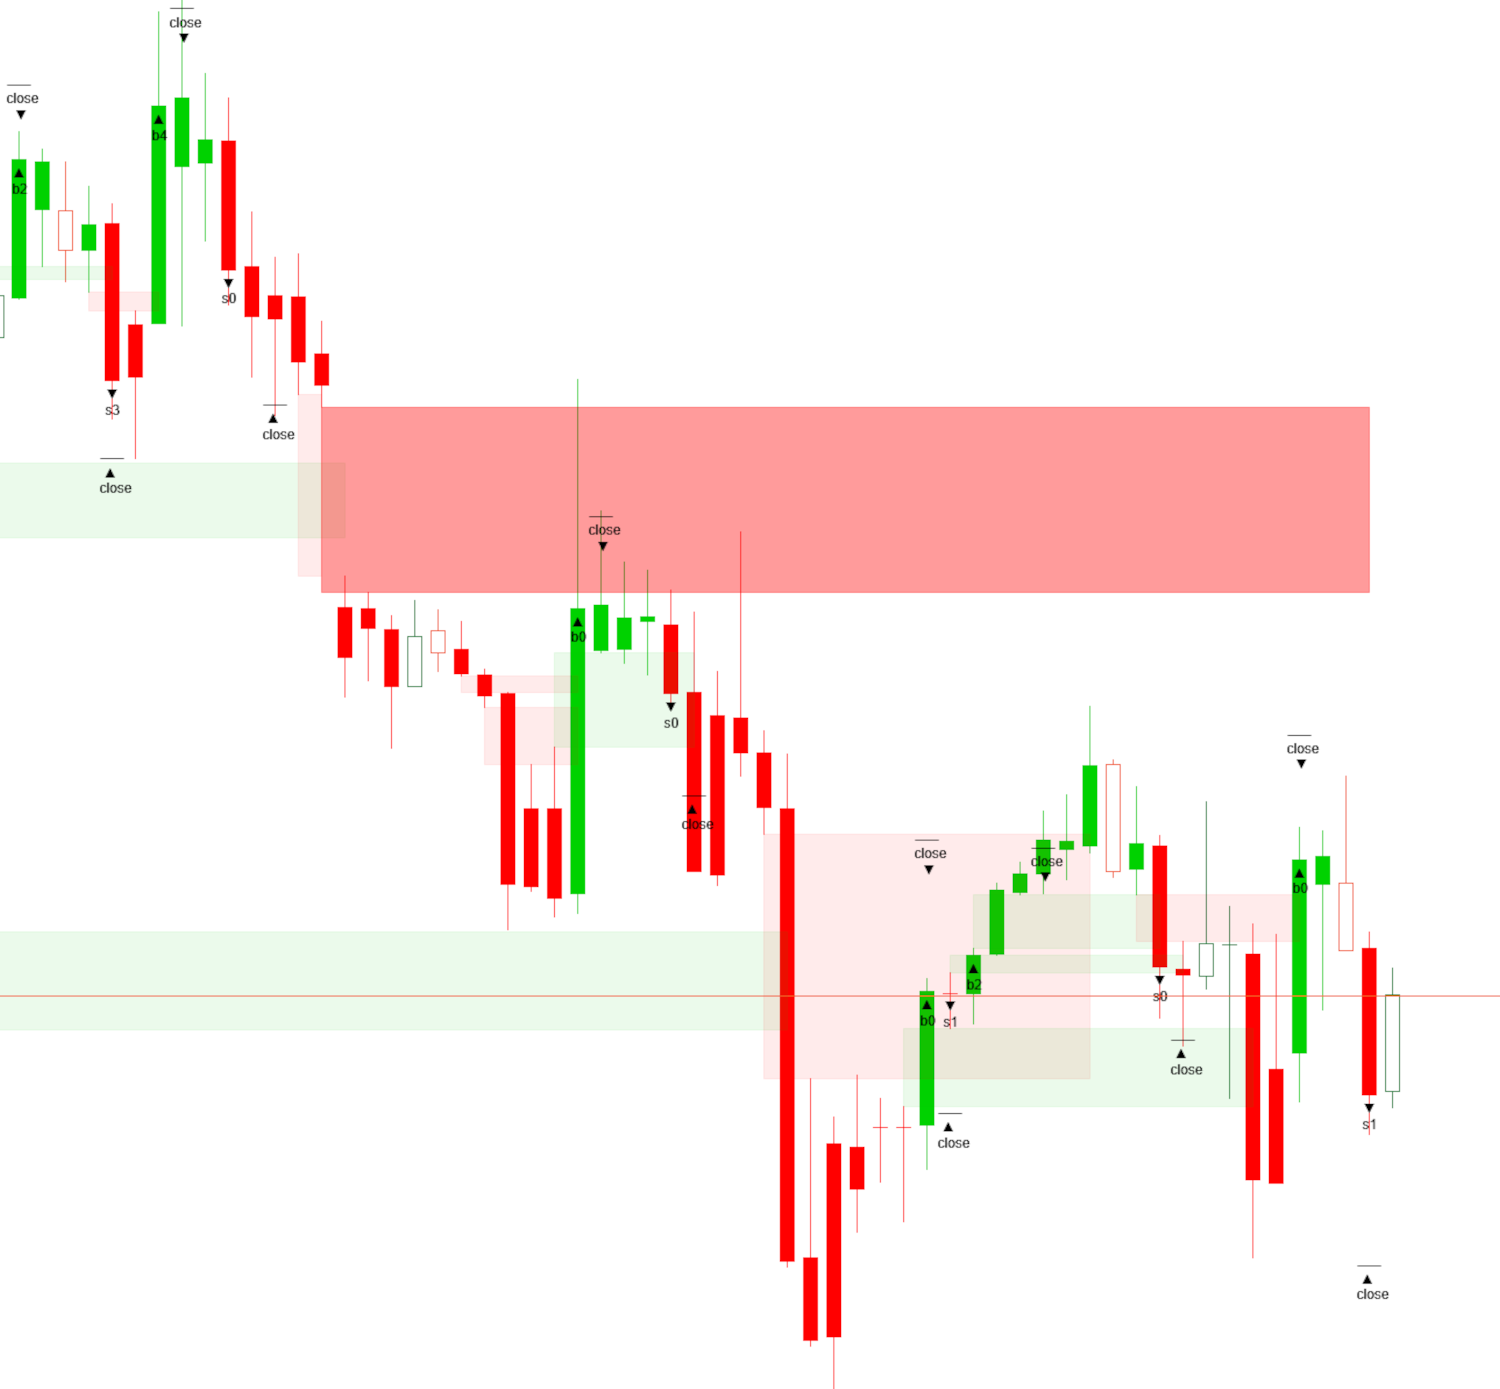
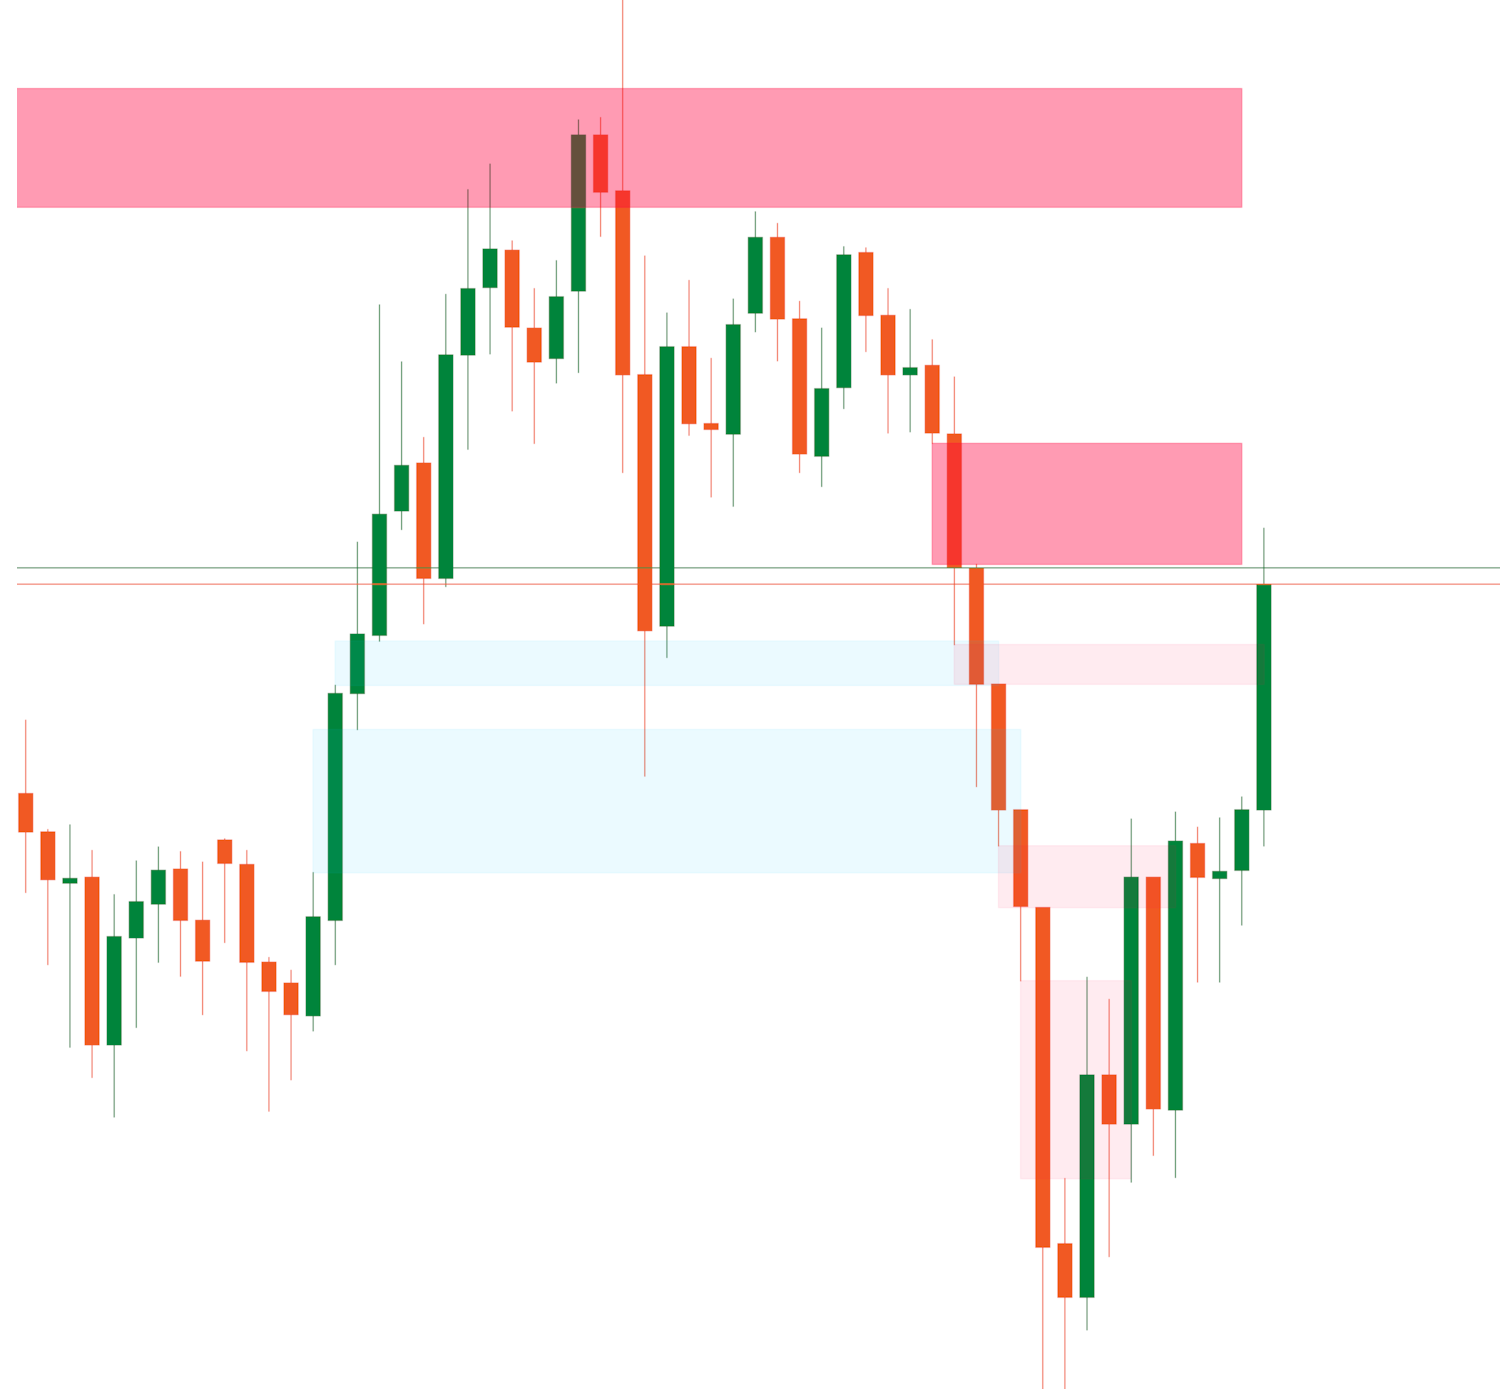
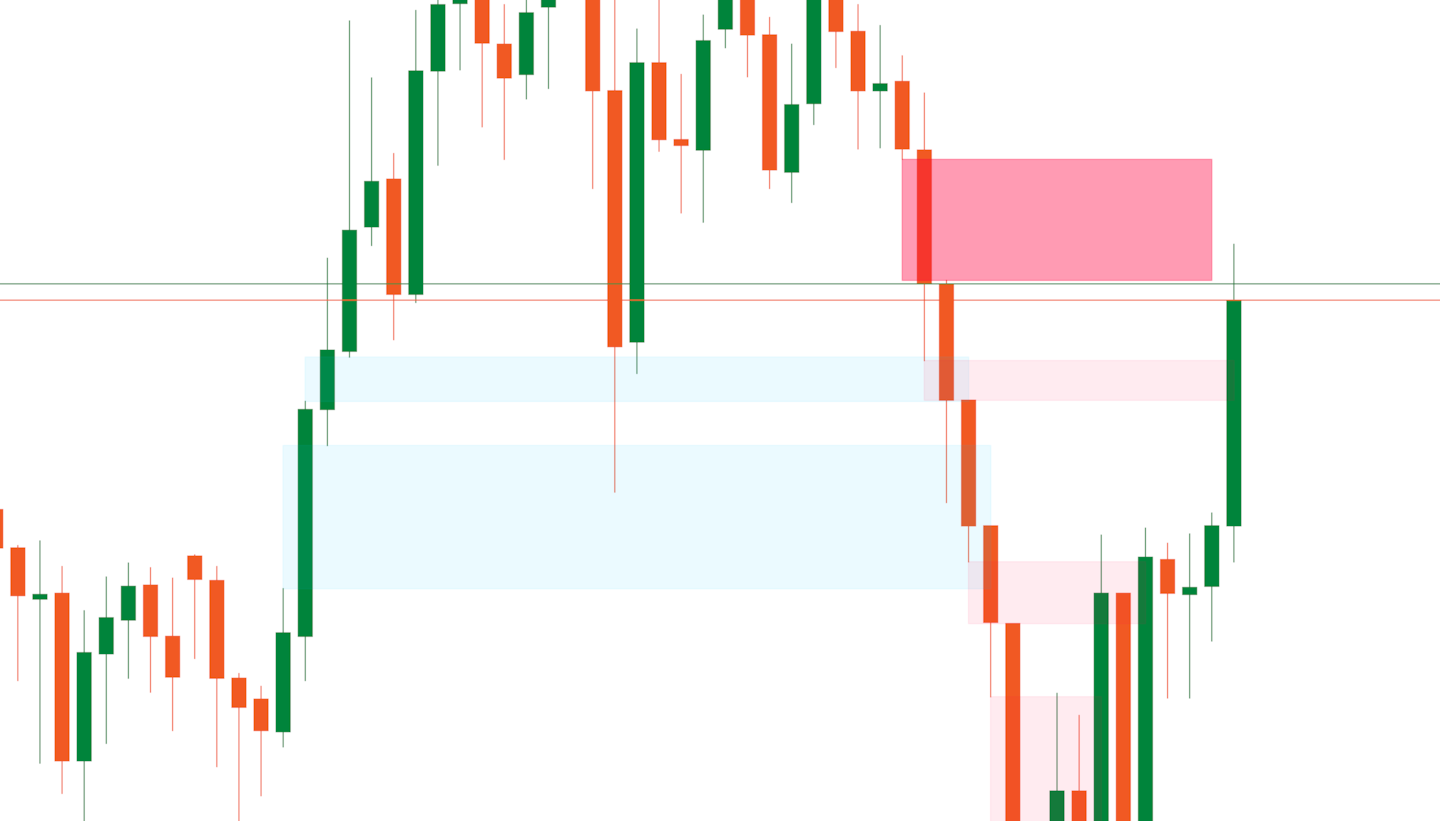
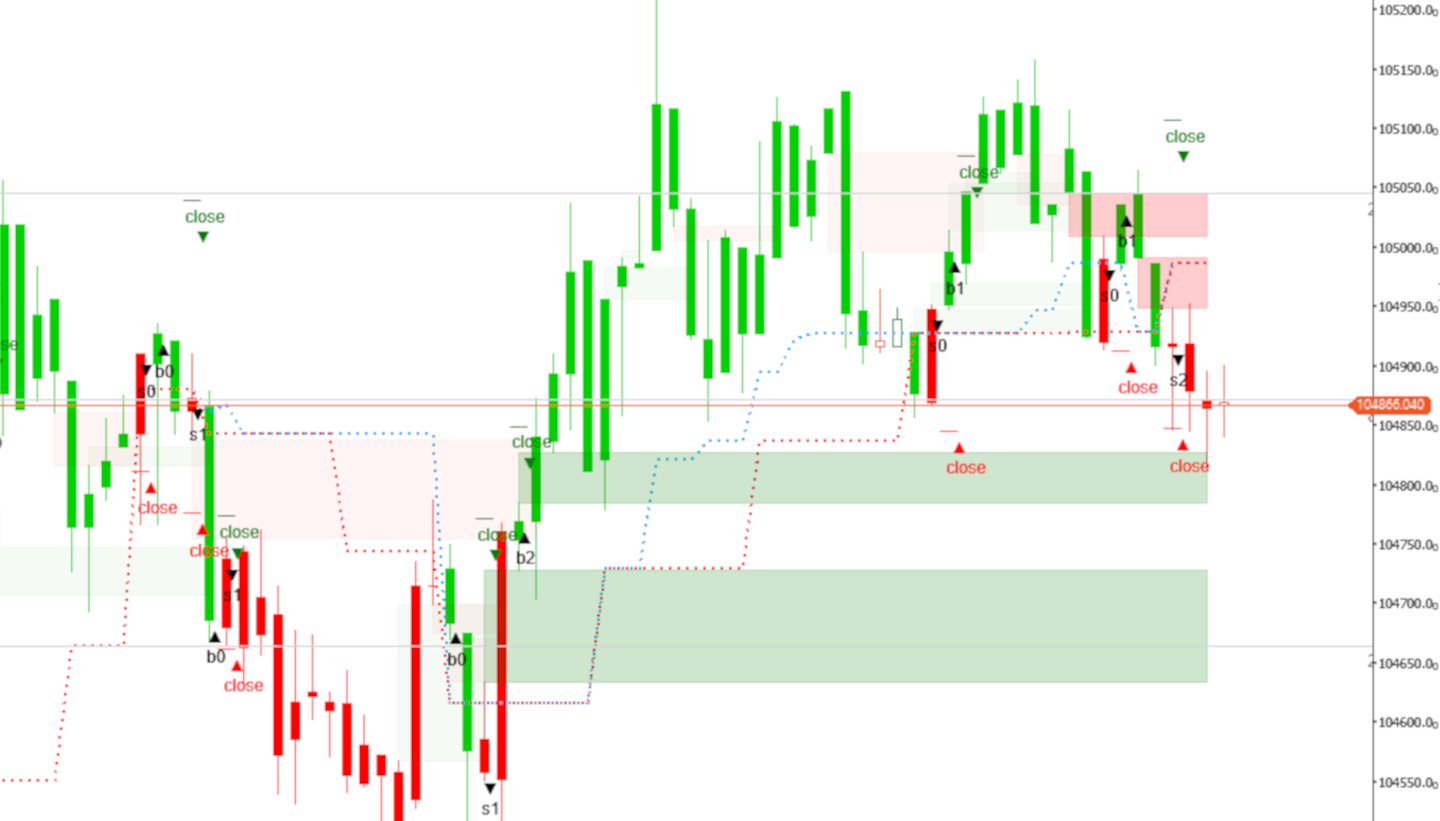
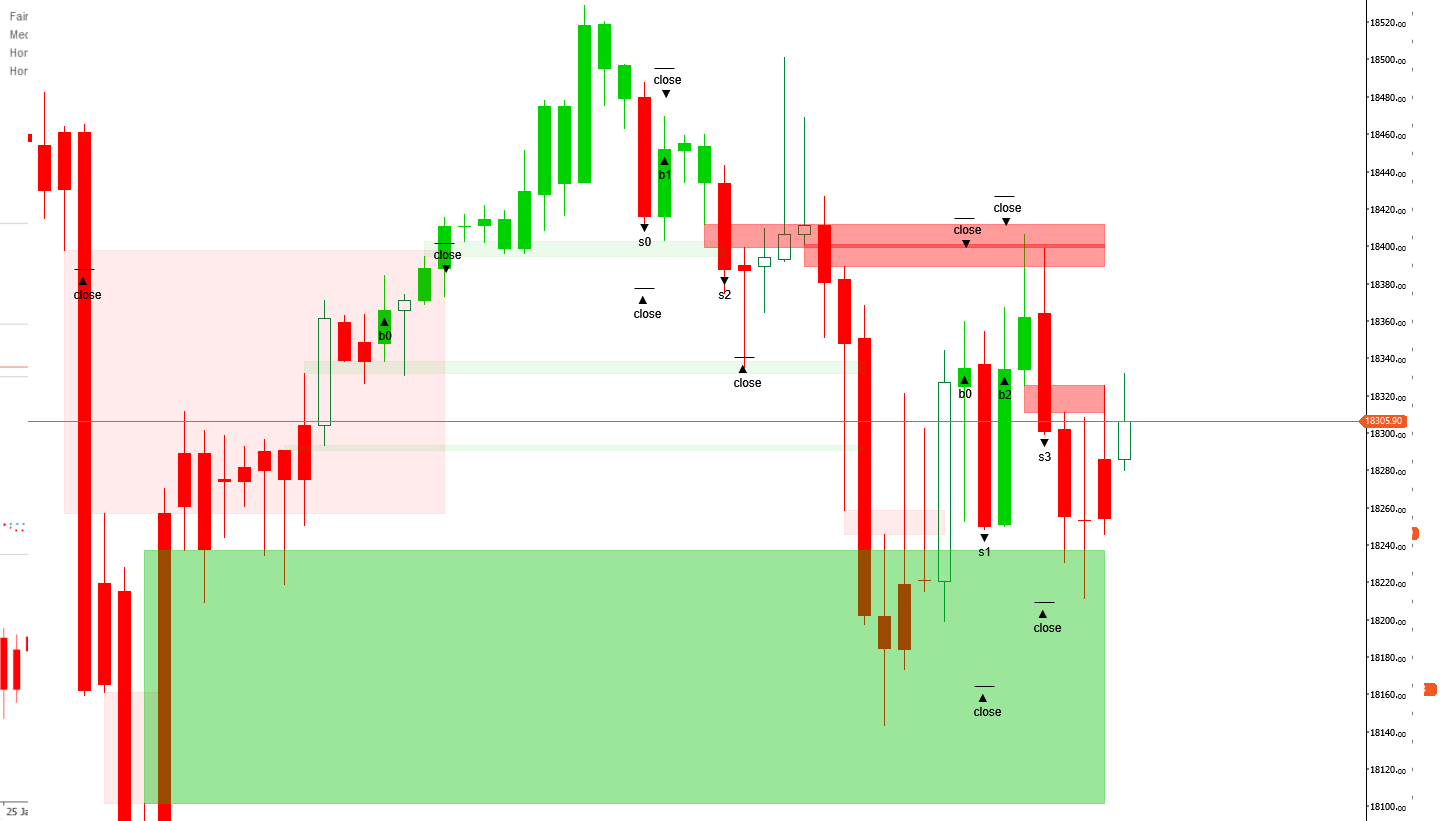
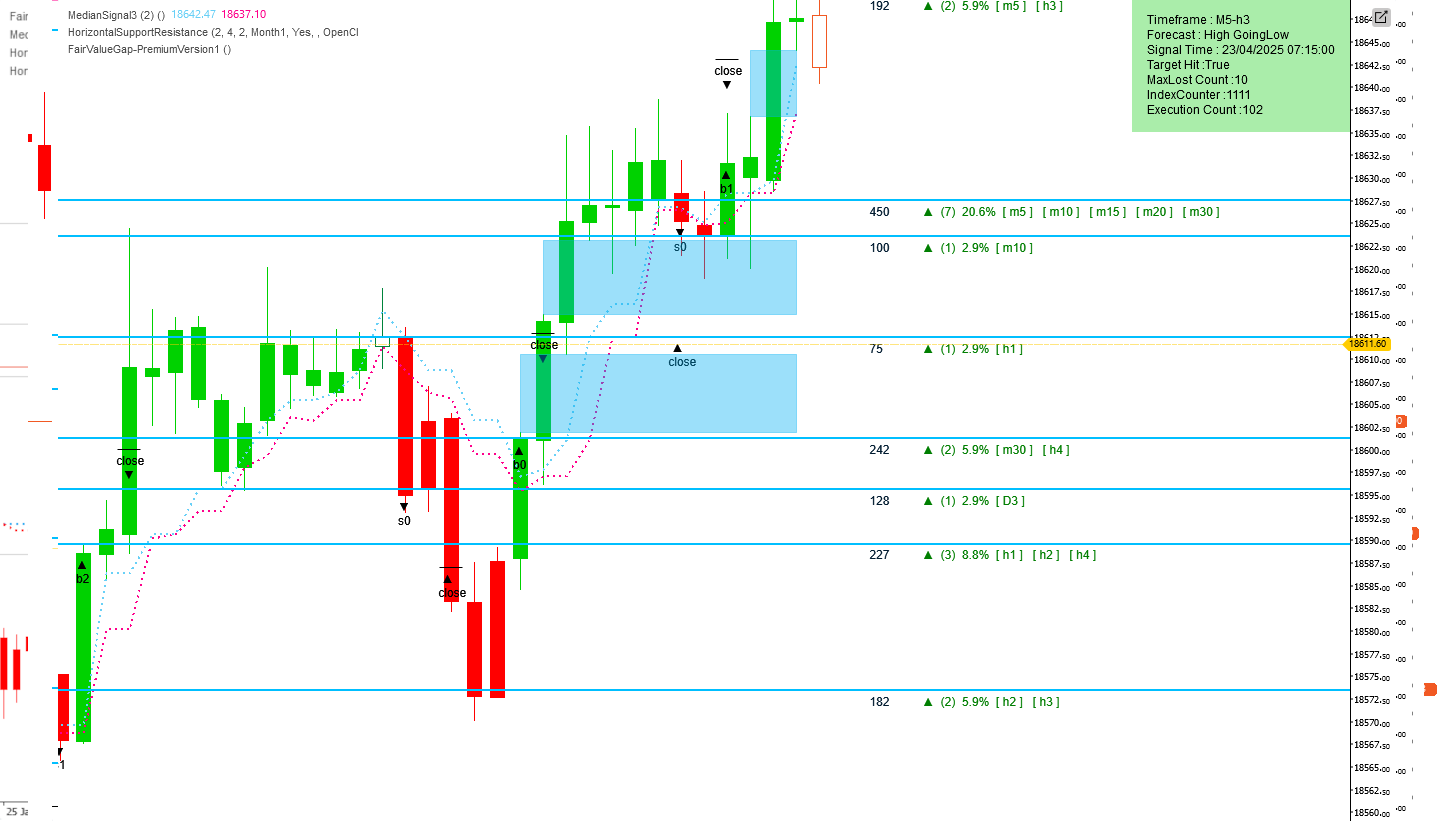
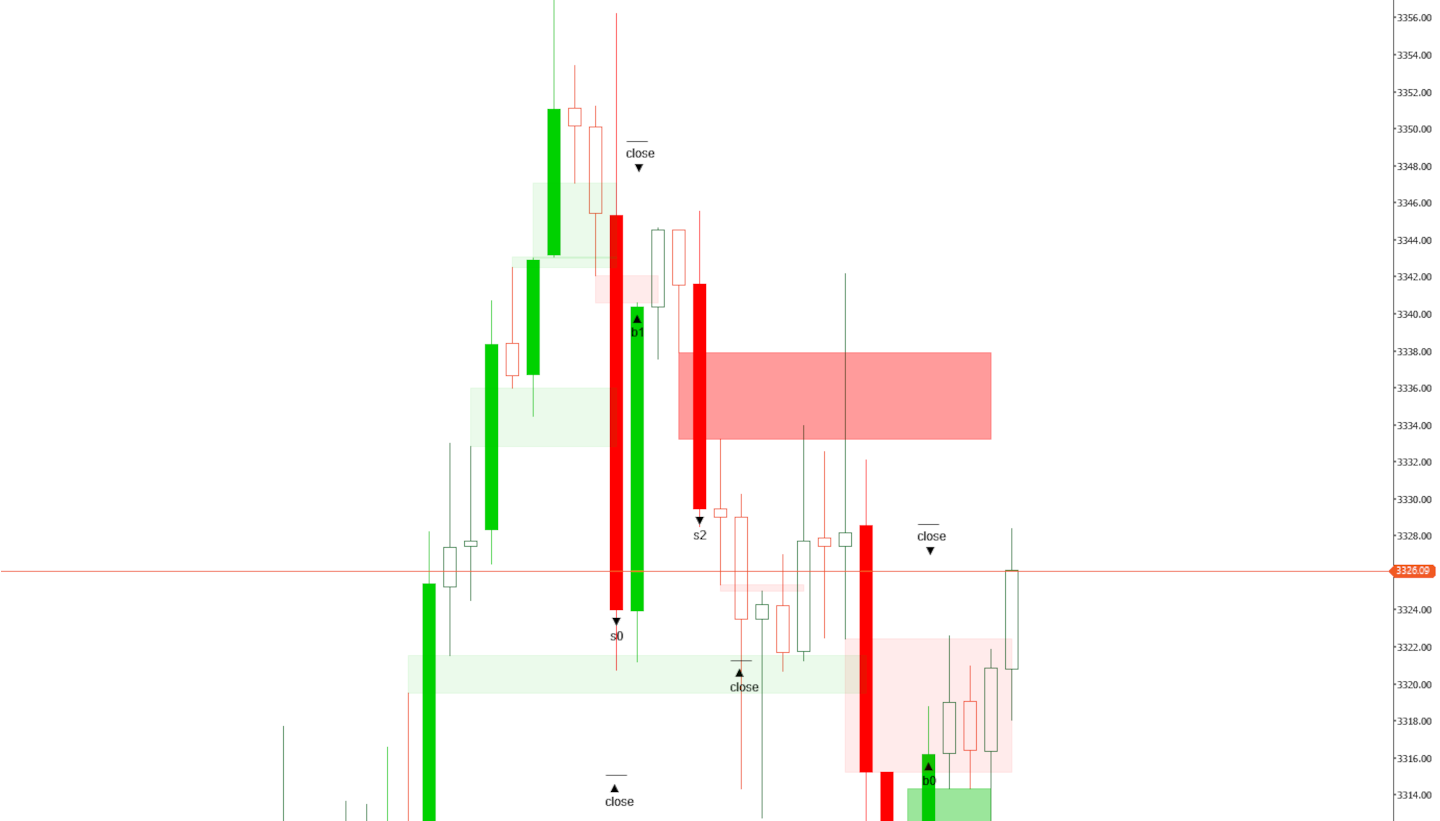
This Fair Value Gap (FVG) indicator is a technical analysis tool designed to detect price inefficiencies within financial markets. It identifies areas where price has surged or dropped rapidly, leaving behind a ā€œgapā€ — a zone with little to no trading activity. These gaps often signal a temporary imbalance in supply and demand, suggesting that price may eventually return to ā€œfillā€ the void as the market seeks balance. Typically, an FVG is recognized when a price candle closes significantly above the high or below the low of the previous candle without overlapping, indicating a potential reaction area. This behavior is often associated with institutional trading or algorithmic activity. While most versions of this indicator analyze imbalances on a single timeframe, the premium version adds versatility by detecting and displaying gaps from higher or lower timeframes directly on the current chart, providing deeper context for multi-timeframe analysis.


Settings Overview

  • Bars To Load: Specifies the number of historical bars to analyze, starting from the most recently completed one and moving backward.
  • Bullish FVG Color: Sets the color for FVGs that appear in an uptrend. A 30% transparency is applied so that elements behind the gap remain visible.
  • Bearish FVG Color: Sets the color for FVGs that appear in a downtrend, also with 30% transparency for better chart visibility.

Premium Features (Available in the Paid Version)

  • Delete Closed Gaps: A Boolean setting—when enabled ("yes"), it automatically removes all closed gaps; if disabled ("no"), the gaps remain visible. This is particularly useful on lower timeframes (under 20 minutes).
  • Edit/Remove Gaps: Allows traders to adjust or delete gaps manually. This gives experienced traders greater control, especially since very small gaps typically offer little influence on price movement.
  • Set Timeframe: Offers two options—use the current chart's timeframe or select a different one for analysis, while still displaying results on the main chart. This feature helps traders gain faster insights into probable market movements.
  • Selected Timeframe: Specifies the desired timeframe for analysis if "Selected Timeframe" is chosen in the setting above.
  • Small Gap Accuracy: Lets traders input a preferred gap size as an integer, helping them identify gaps that historically lead to favorable outcomes. The value is based on the entire dataset and gap sizes observed for the asset.

By default, the indicator scans all imbalances within a single timeframe. However, access to premium features through the FairValueGapPremium version can greatly enhance analytical capabilities.

0.0
Reviews: 0
Customer reviews
No reviews for this product yet. Already tried it? Be the first to tell others!
More from this author
Top-rated
Free
FairValueGap
This Fair Value Gap (FVG) indicator is a technical analysis tool used to identify potential price imbalances.
Indicator
Indices
Stocks
Forex
+2
HorizontalSupportResistance
This extraordinary multi-timeframe support and resistance indicator is nothing short of market wizardry.
Top-rated
Free
BarSentiments
This Indicator is a technical analysis tool that measures the strength and direction of market sentiment
You may also like
Zig zag v.1 Demo
ZigZag Pro DEMO – Multi-Swing Indicator for cTrader DEMO VERSION – 24 hours free trial! This is a DEMO version of the Z
Renko Moving Average Cross Indicator
The Renko Moving Average Cross indicator combines classic EMA crossover signals with Renko-filtered prices.
Indicator
RSI
Indices
Signal
QQE-MTF
Multi-timeframe version of the Quantitative Qualitative Estimation (QQE) indicator.
Indicator
Indices
XAUUSD
Prop
+8
Average Cost Price
Average Cost Price helps you keep track of your open positions on the chart. In doing so, it provides lines and explanat
Indicator
NAS100
RSI
NZDUSD
+16
AlphaTrend Pro Max
Turn data into precision trades with AlphaTrend Pro Max — advanced trend, signal & structure analysis in one.
Head Shoulders Finder
Detects Head & Shoulders patterns, plots signals, and alerts for trading opportunities.
Indicator
XAUUSD
Forex
EURUSD
+2
Risk & Reward Trading Tool Pro.v2.15
This is a tool to help traders open orders/close orders/modify orders quickly with just one click
Indicator
VWAP
ZigZag
RSI
+6
RSI T3 overbought and oversold area
VegaXLR - Chart Patterns Alerts
Enhance your trading strategy with automated detection and alerts for key chart patterns.
Indicator
RSI
Indices
ATR
+3
Divergency 1.1_withSourceCode
šŸ” Divergency Indicator for cTrader (Update v1.1)
Indicator
Breakout
Forex
On Balance Volume
On Balance Volume (OBV) measures buying and selling pressure as a cumulative indicator.
Fibonacci Pitchfan
Powerful all-in-one toolĀ for traders seeking aĀ clear, dynamic viewĀ of market structure. By mergingĀ pivots, trendlines &
Indicator
Stocks
Forex
Crypto
PinBarCandlestickPattern
PinBarCandlestickPattern Indicator
E7 Correlation Dashboard
E7 Correlation Dashboard.
Indicator
ZigZag
VWAP
Weis & Wyckoff System v2.0
Indicator
Indices
Prop
Breakout
+3
RVI
A precision-crafted indicator that compares current volume to its historical average for the same time of day.
TrendStrengthSignals
Edge-aware clouds + Pro HUD: better entries, calmer exits, adaptive risk.
[Hamster-Coder] Pivot Points MTF
[Hamster-Coder] Pivot Points (Multi Time Frame)