Indicator
NAS100
NZDUSD
Breakout
XAUUSD
Commodities
Forex
EURUSD
GBPUSD
BTCUSD
Indices
Prop
Stocks
Crypto
USDJPY
Consolidation Zones
"Consolidation Zones" logo
06/10/2025
Desktop
"Consolidation Zones" uploaded image

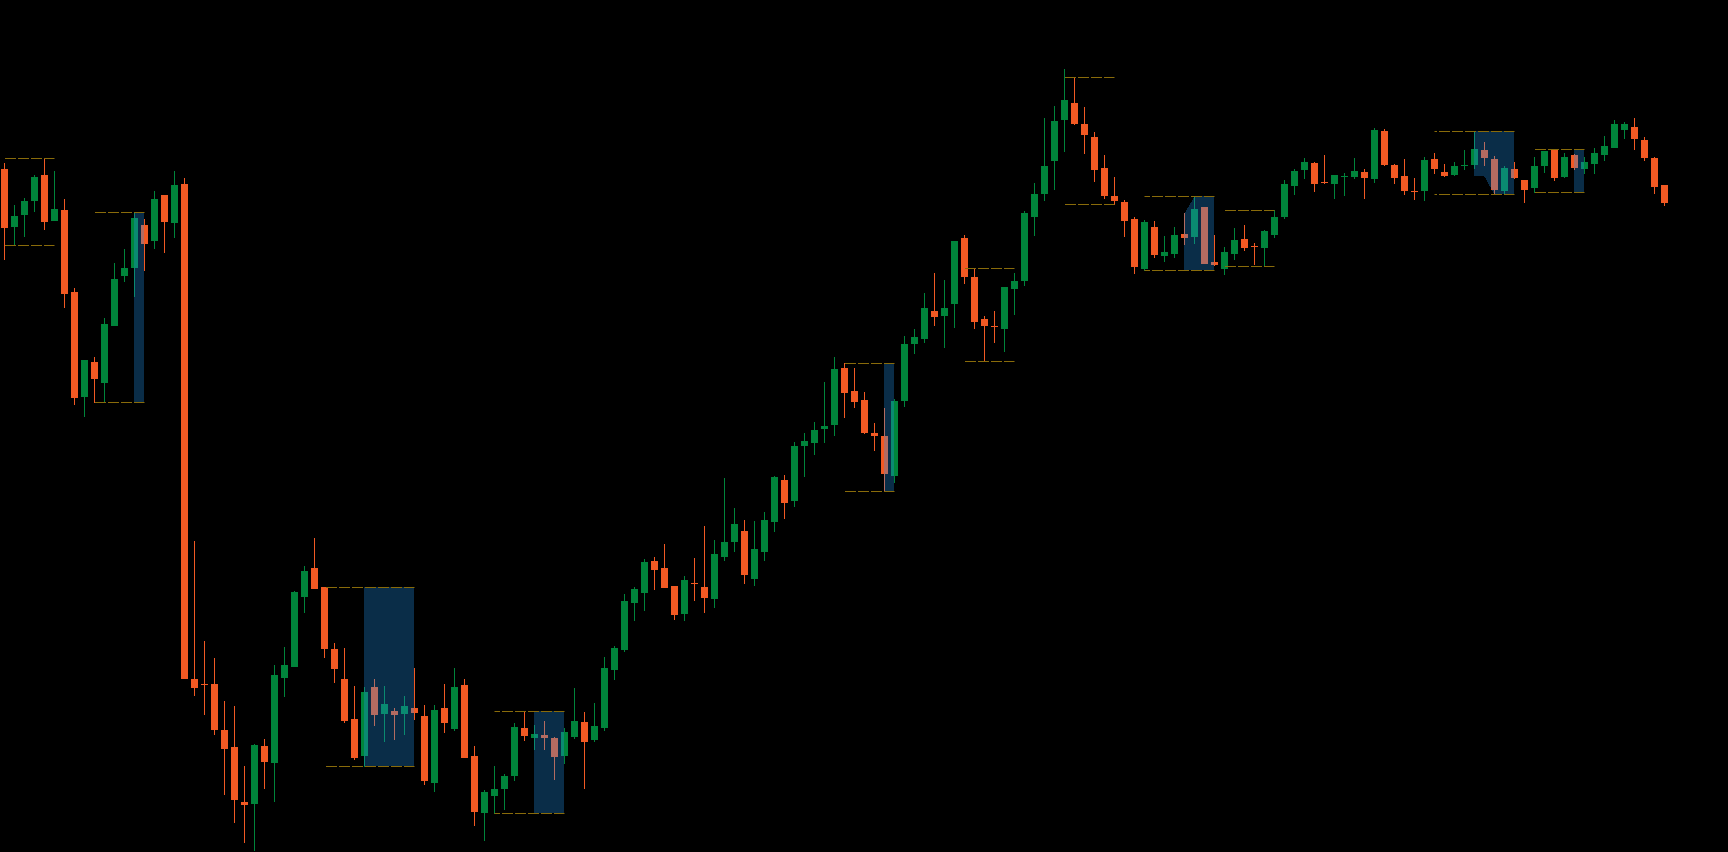
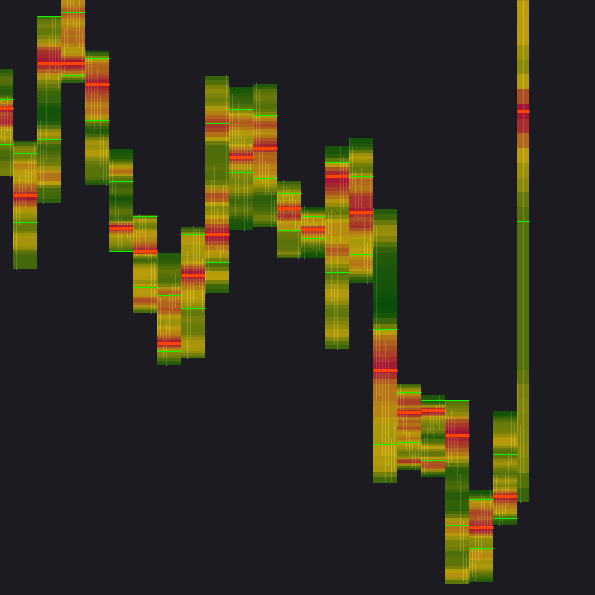
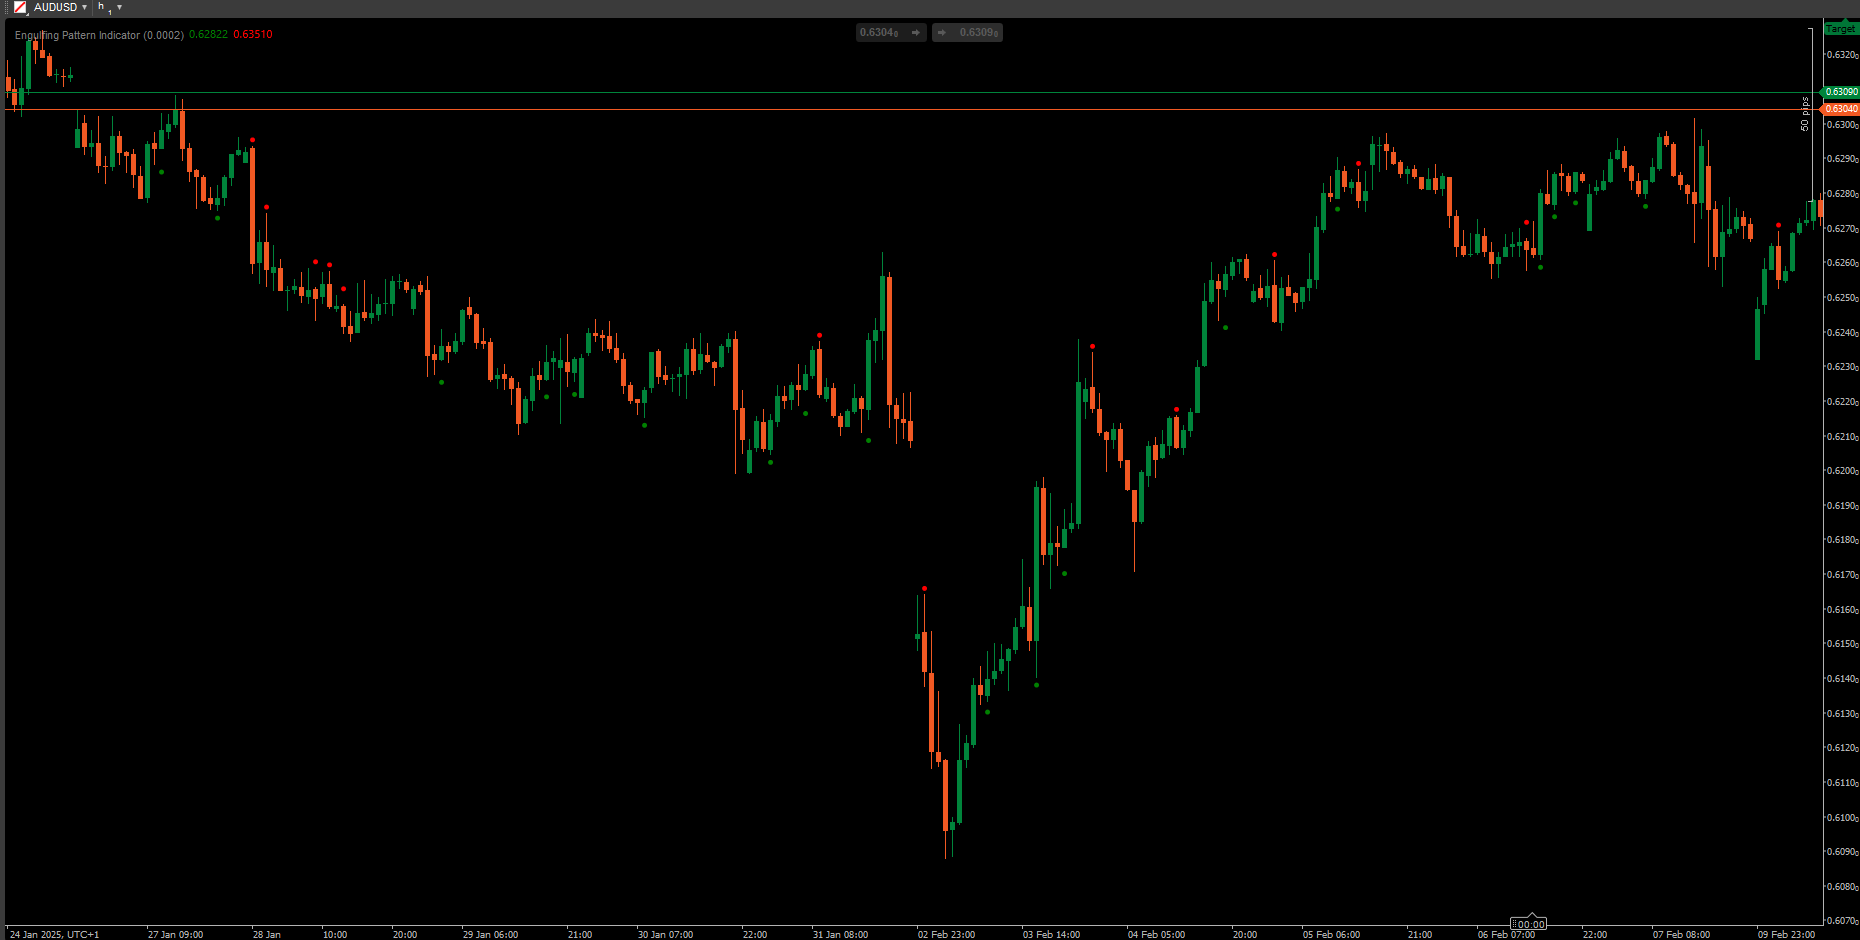
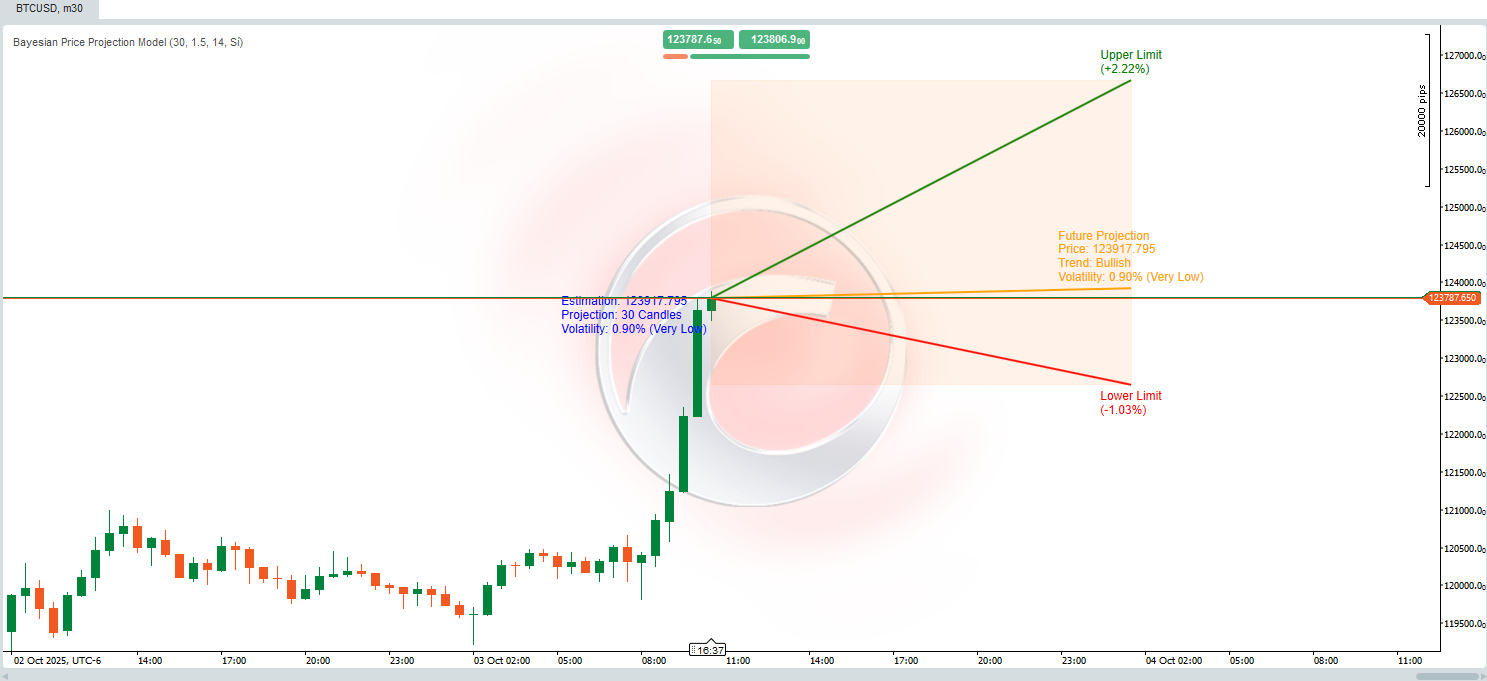
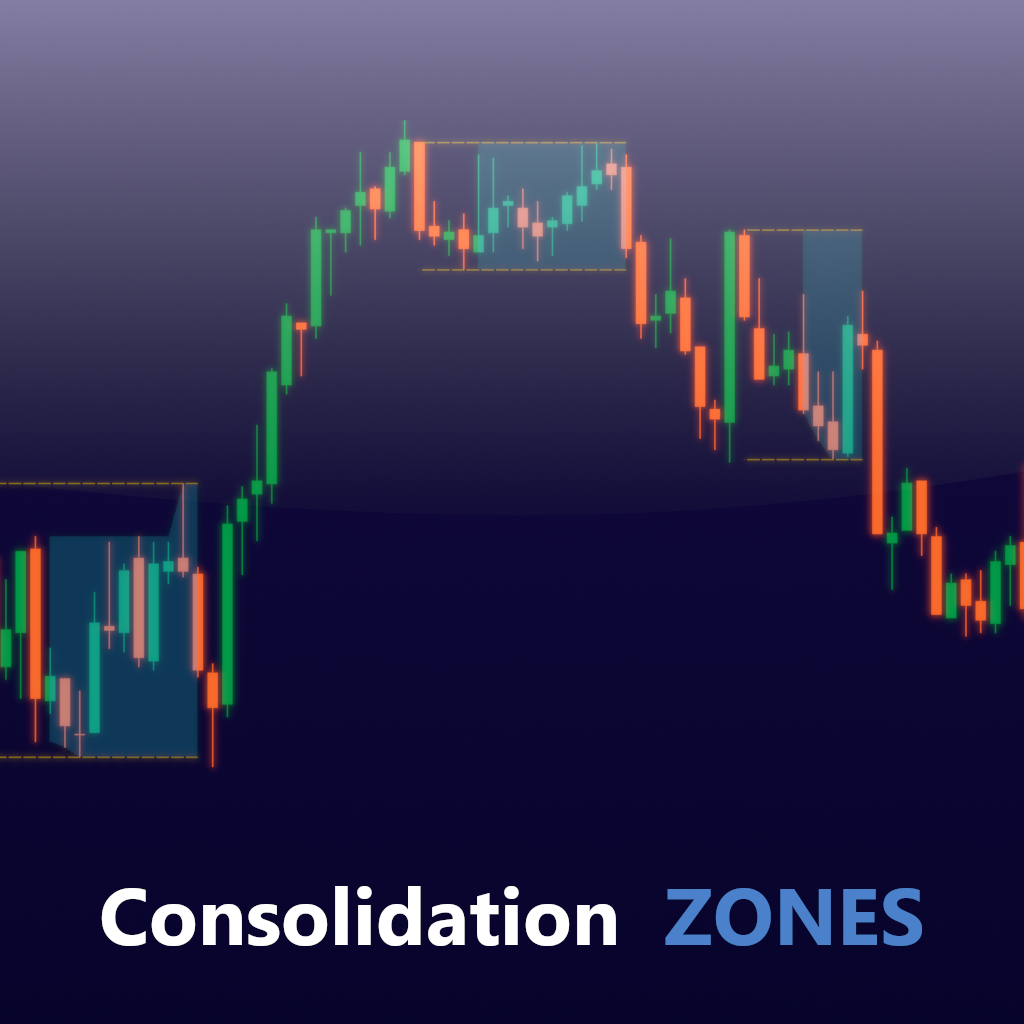
Introducing the Consolidation Zones indicator, designed to help you identify and capitalize on breakout opportunities with ease.

This powerful tool highlights zones on your chart where the price is consolidating, making it simple to spot potential breakout points. By visualizing these critical areas, you can better anticipate market movements and make more informed trading decisions.

Ideal for traders looking to enhance their strategy with clear and actionable insights, upgrade your trading toolkit and master breakouts with the Consolidation Zones indicator.

0.0
Reviews: 0
Customer reviews
No reviews for this product yet. Already tried it? Be the first to tell others!
More from this author
Indicator
NAS100
NZDUSD
XAUUSD
+13
Chandelier Exit
Optimize exits with Chandelier Exit! Visualize stop-loss points dynamically for improved trading precision and safety.
Indicator
NAS100
NZDUSD
XAUUSD
+13
MACD Crossover PRO
Customize the MACD! Choose colors, get real-time tick updates, and see crossover points for enhanced trading precision.
Indicator
NAS100
NZDUSD
XAUUSD
+10
Moving Average PRO
Customize your Moving Average! Choose any timeframe and price source for precision and flexibility in your analysis.
Indicator
NAS100
NZDUSD
XAUUSD
+12
QQE Qualitative Quantity Estimation
Unlock trading precision with QQE! Dual QQE indicators with a Bollinger Bands zero line provide clear buy/sell signals.
Indicator
NAS100
NZDUSD
XAUUSD
+10
Relative Moving Average
Bring the RMA to cTrader! This is the Relative Moving Average from TradingView.
Indicator
NAS100
NZDUSD
Breakout
+14
Bollinger Bands Cloud
Visualize Bollinger Bands with a colored cloud for clarity. Enhance your trading precision with this dynamic indicator!
Indicator
NAS100
NZDUSD
Breakout
+13
VWAP Volume Weighted Average Price
Unlock VWAP in cTrader! Choose anchor periods, price sources, and display deviation bands with real-time tick updates.
Indicator
Grid
NAS100
NZDUSD
+13
Standard Deviation Channel
Visualize trends with Standard Deviation Channel! Display median, and add customizable upper/lower deviation channels.
Indicator
NAS100
NZDUSD
Breakout
+12
ATR Bands
Enhance trading with ATR Bands! Visualize market volatility using dynamic upper and lower ATR bands for precise decision
Indicator
NAS100
NZDUSD
XAUUSD
+13
MACD Histogram PRO
Enhance MACD Histogram! Visualize bull and bear price changes with vibrant colors for clearer, more insightful trading.
You may also like
Indicator
NAS100
Indices
Prop
+6
VolumeThermometer
Heatmap of intra-HTF volume (POC/VA) built from LTF tick data; paints current candle and auto-loads visible history.
ms_Candle_ColseTime
⏱ Candle Time Remaining – Real-Time Candle Countdown Indicator
Indicator
Stocks
Forex
Signal
+1
Engulfing Pattern Indicator
Indicator
NAS100
NZDUSD
XAUUSD
+10
ALMA-Gaussian Trend Filter
📈 Adaptive ALMA-Gaussian hybrid trend filter with precision smoothing and clear buy/sell signals.
Time Marker
CaptraTimeMarker: Marks key trading hours with lines & labels, plus daily separators for cTrader. Customizable & precise
Indicator
NAS100
NZDUSD
XAUUSD
+7
Bayesian Price Projection Model
Bayesian theory** to forecast a future price while providing **uncertainty ranges** that represent upper and lower bound
Indicator
Indices
Stocks
Forex
+1
VegaXLR - Moving Average Alerts
A powerful cTrader indicator with customizable Moving Average alerts, notifications, and automated trading actions.
Indicator
RSI
Breakout
XAUUSD
+9
Square Matrix Trading System
Square Matrix Trading System by LudwigICT – Institutional-Grade Trading Clarity in cTrader
Vice TrendTrading
Unlike most indicators that show signals blindly, this show valid entries inside TREND ZONES and visual trend BACKTESTS.
Indicator
XAUUSD
Forex
EURUSD
+3
Fx4U.Risk & Reward Trading Tool.v2.16 -Indicator
This is a tool to help traders open orders/close orders/modify orders quickly with just one click
Smart Floating Risk Pro
📊 Smart Floating Risk Pro – Advanced Risk Management for cTrader
KANDIKA HEAT MAP
Color-Based Market Pressure & Volatility Visualizer The Kandika Heatmap Indicator
ICT Killzone and Sessions high_low
This indicator is an essential tool for traders seeking to visualize key trading sessions on their charts.
Trinity StochX
Indicator Stochastic With RSI
Indicator
Breakout
PDHL
PDHL - Previous Day High&Low
Indicator
Grid
Indices
Prop
+4
Round Numbers
Automatically draws major, minor, and trace support/resistance levels at round numbers
Indicator
Indices
ADXMultiframeIndicator
Multi-Timeframe ADX Trend Dots & Arrows
E7 Correlation Dashboard
E7 Correlation Dashboard.