Major Tops and Bottoms Indicator: A Comprehensive Overview
Introduction
In the fast-paced world of trading, having the right tools at your disposal can make all the difference. The Major Tops and Bottoms indicator is designed to identify critical turning points in the market, allowing traders to make informed decisions. This powerful tool leverages advanced algorithms to pinpoint significant highs and lows, enhancing your trading strategy and improving your overall performance. With an Average accuracy rate of around 60% to 70% on the 45 min timeframe this indicator is a reliable asset for traders looking to capitalize on market movements making it ideal for both day traders and scalpers.
Key Features
1. Visual Representation
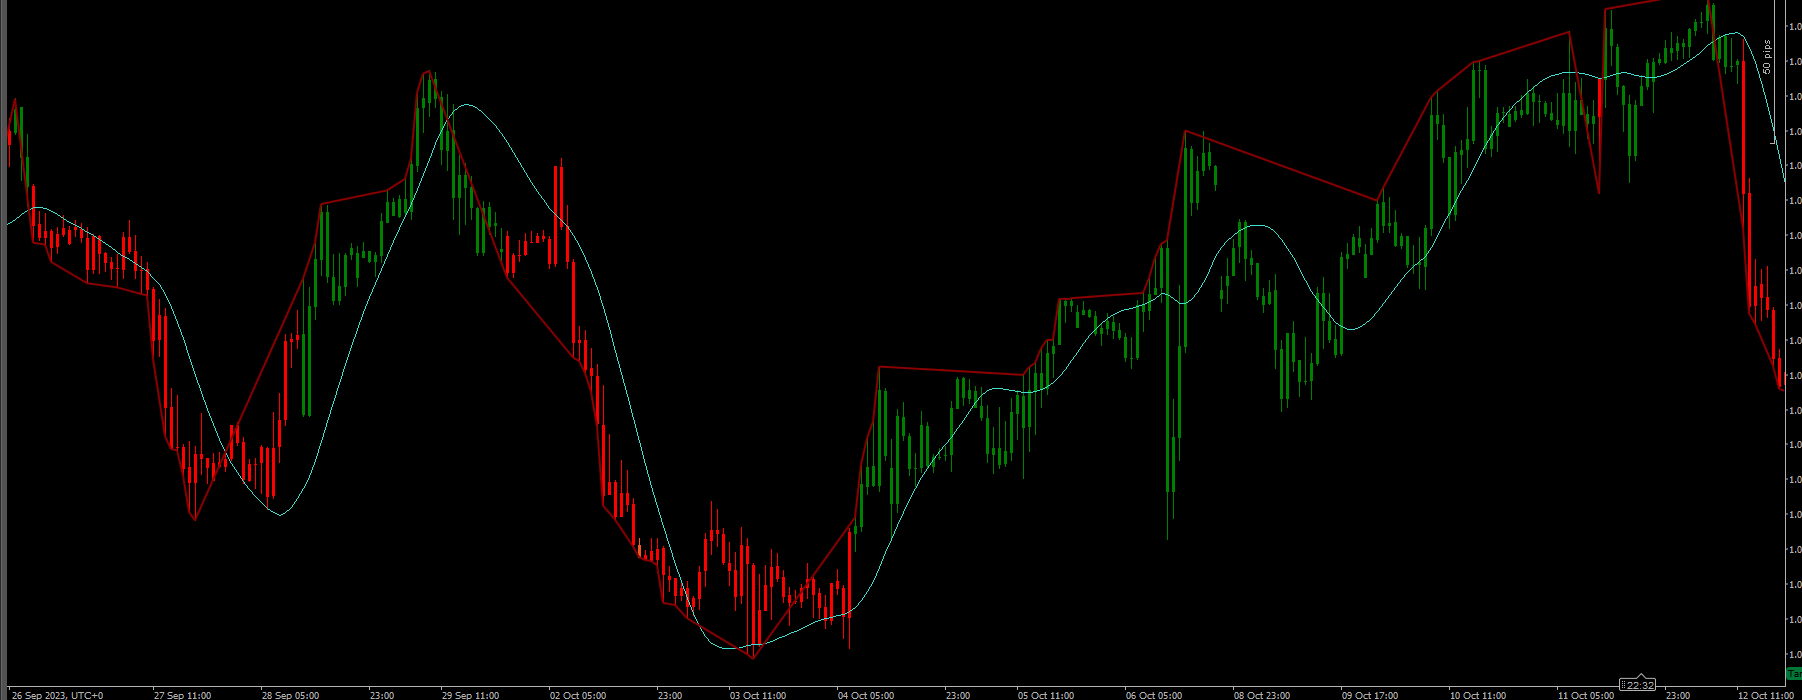
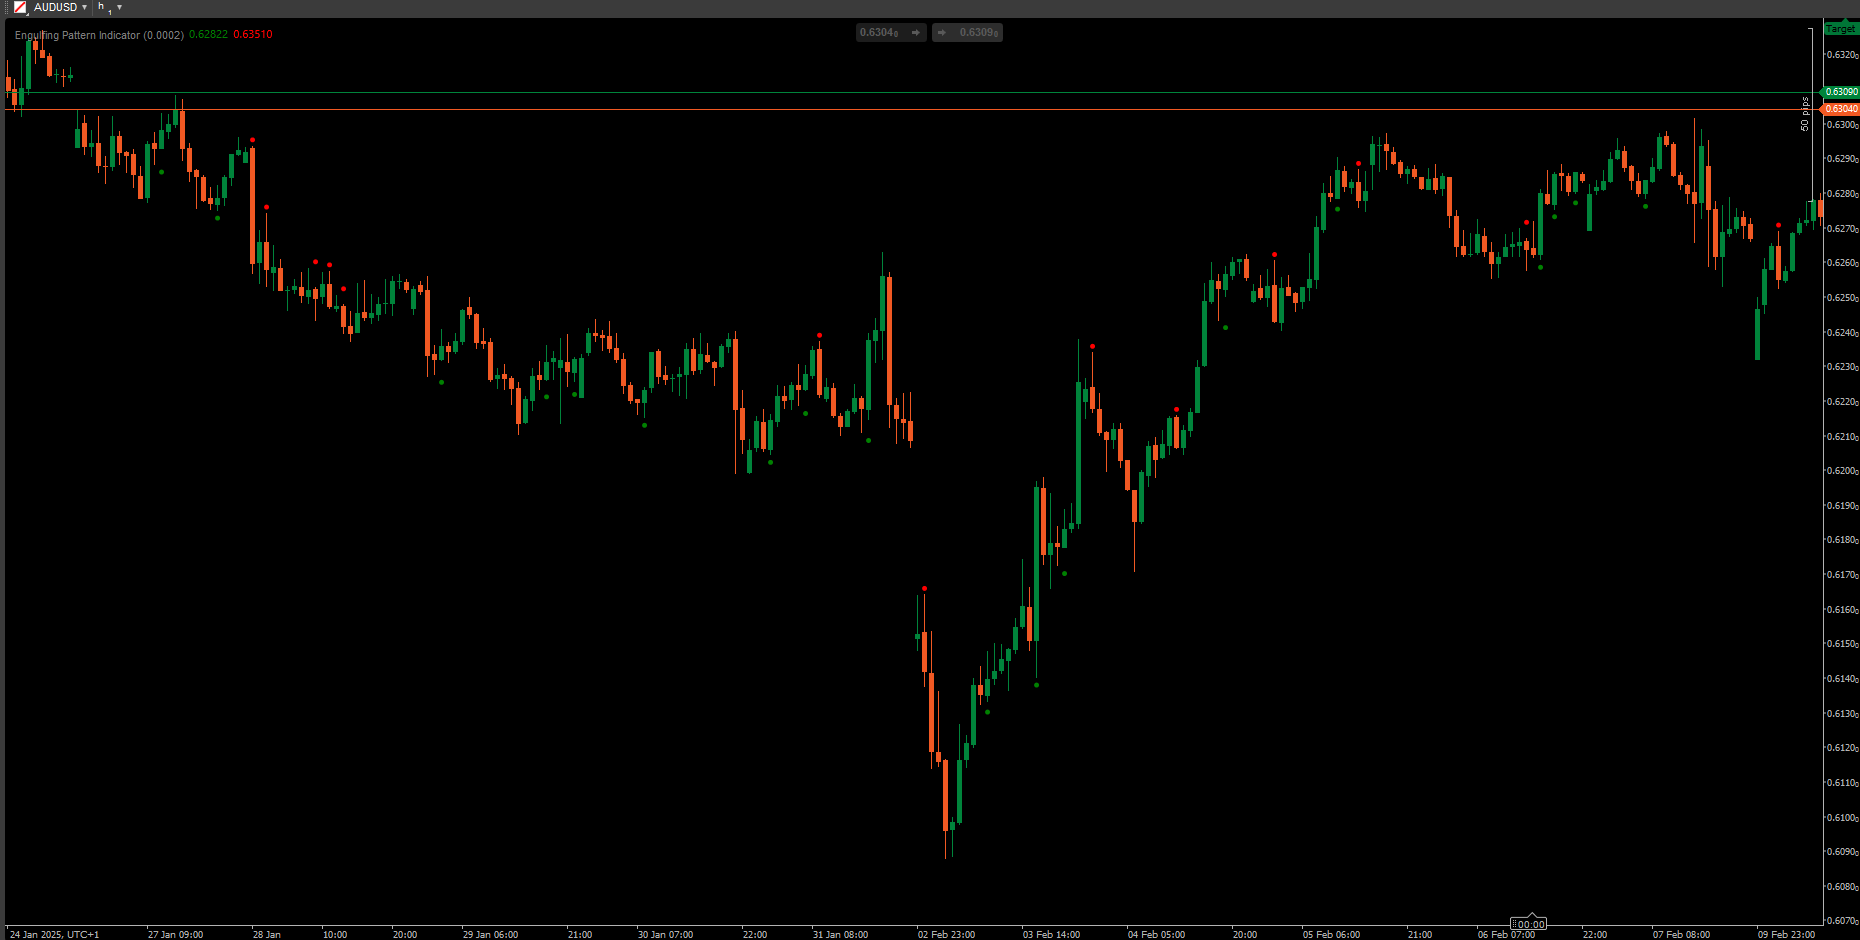
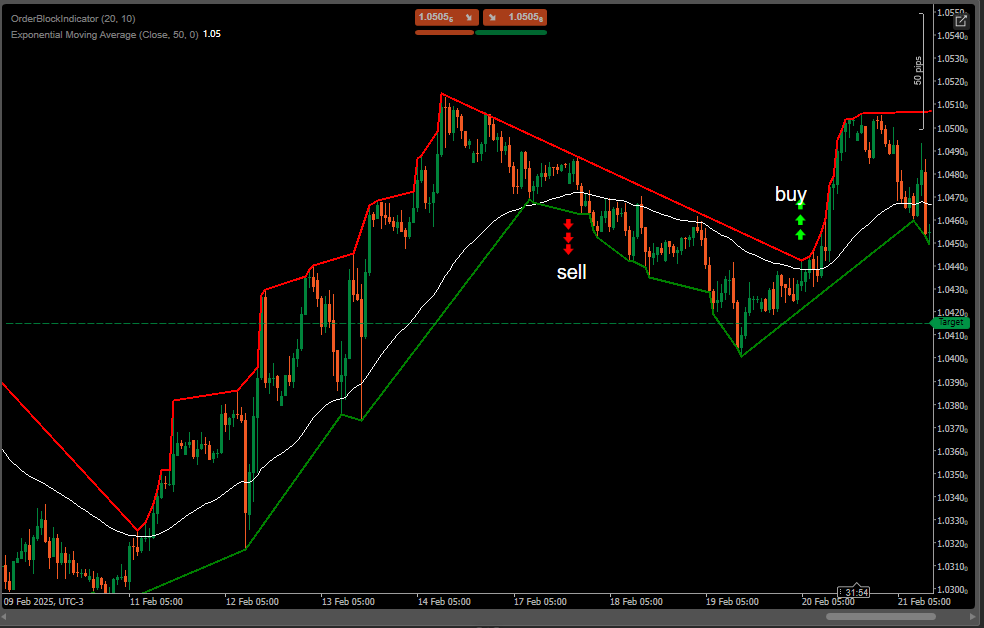
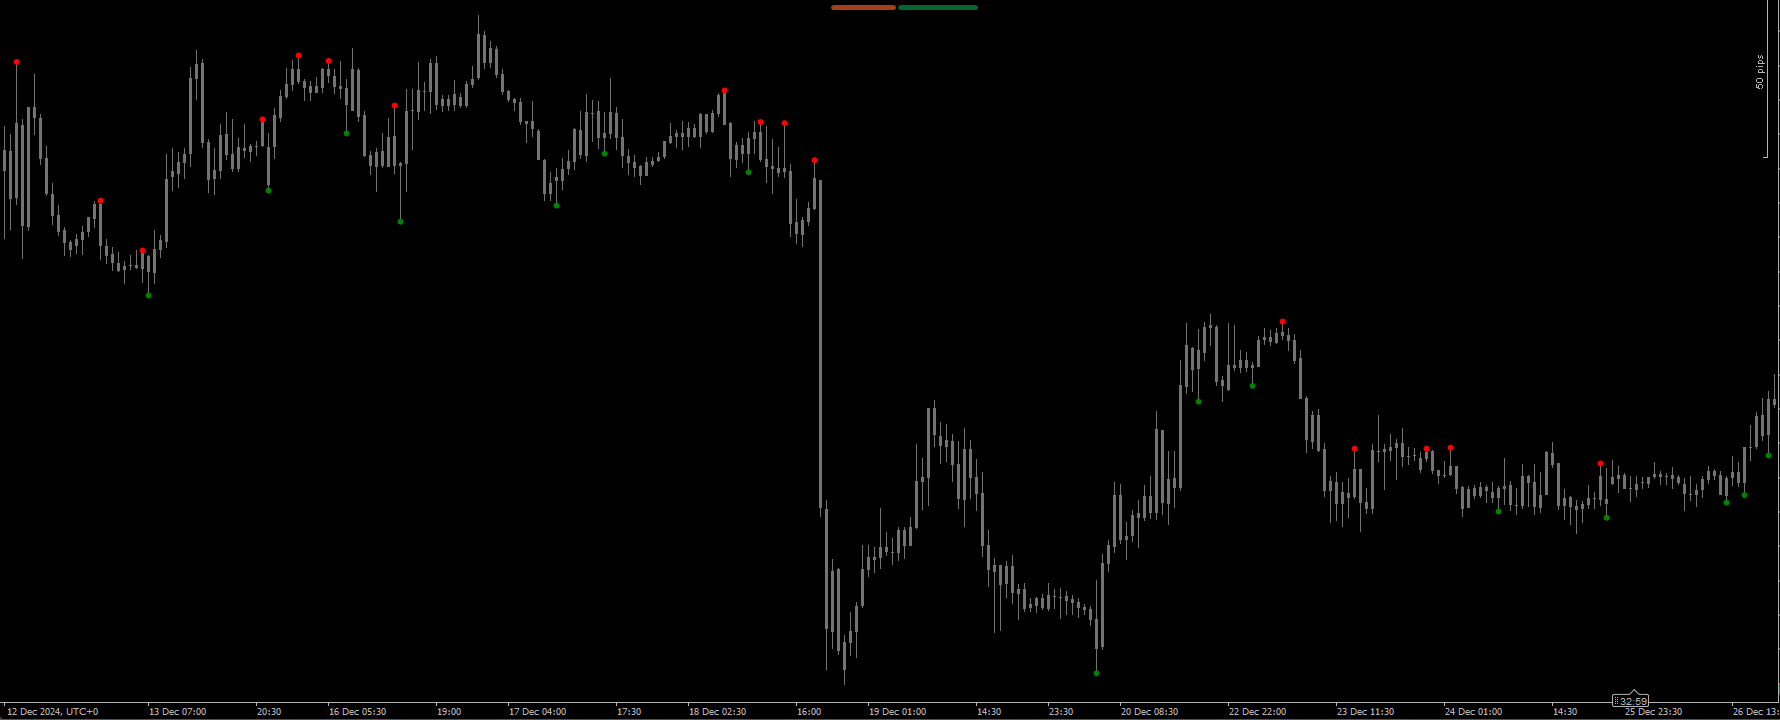
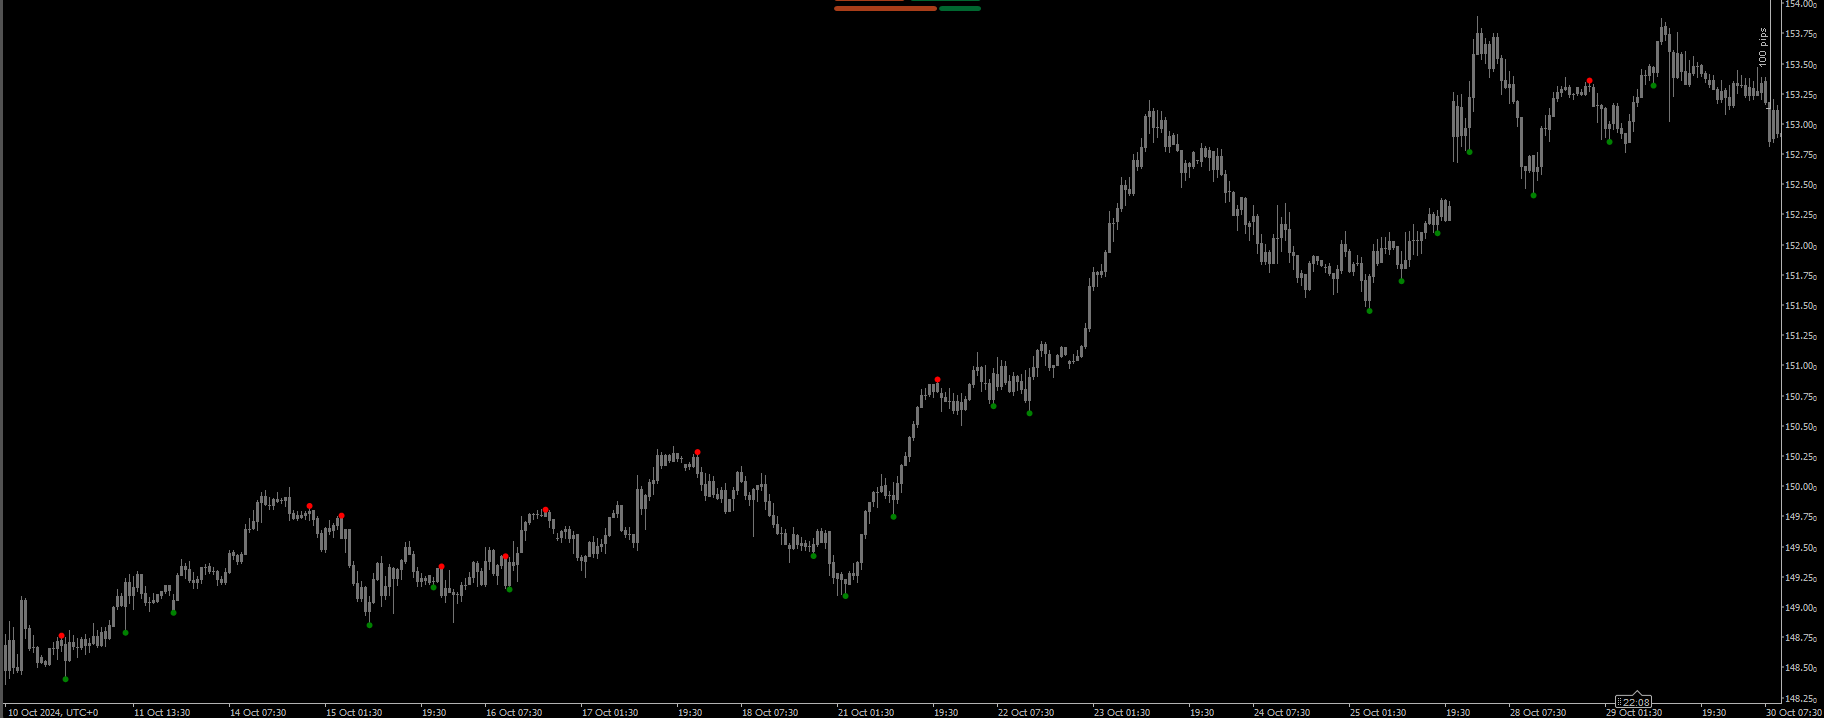
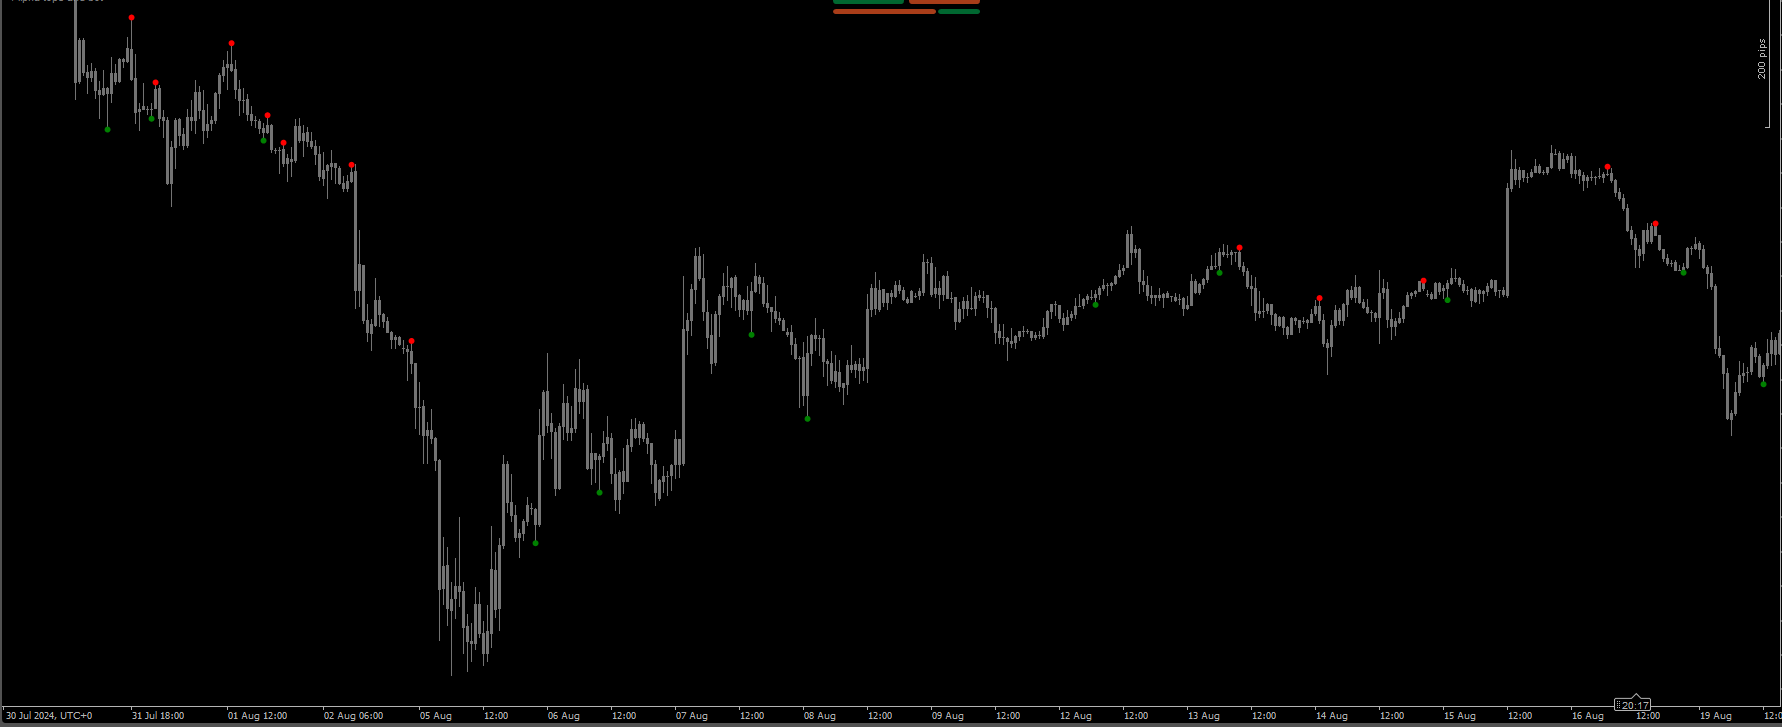
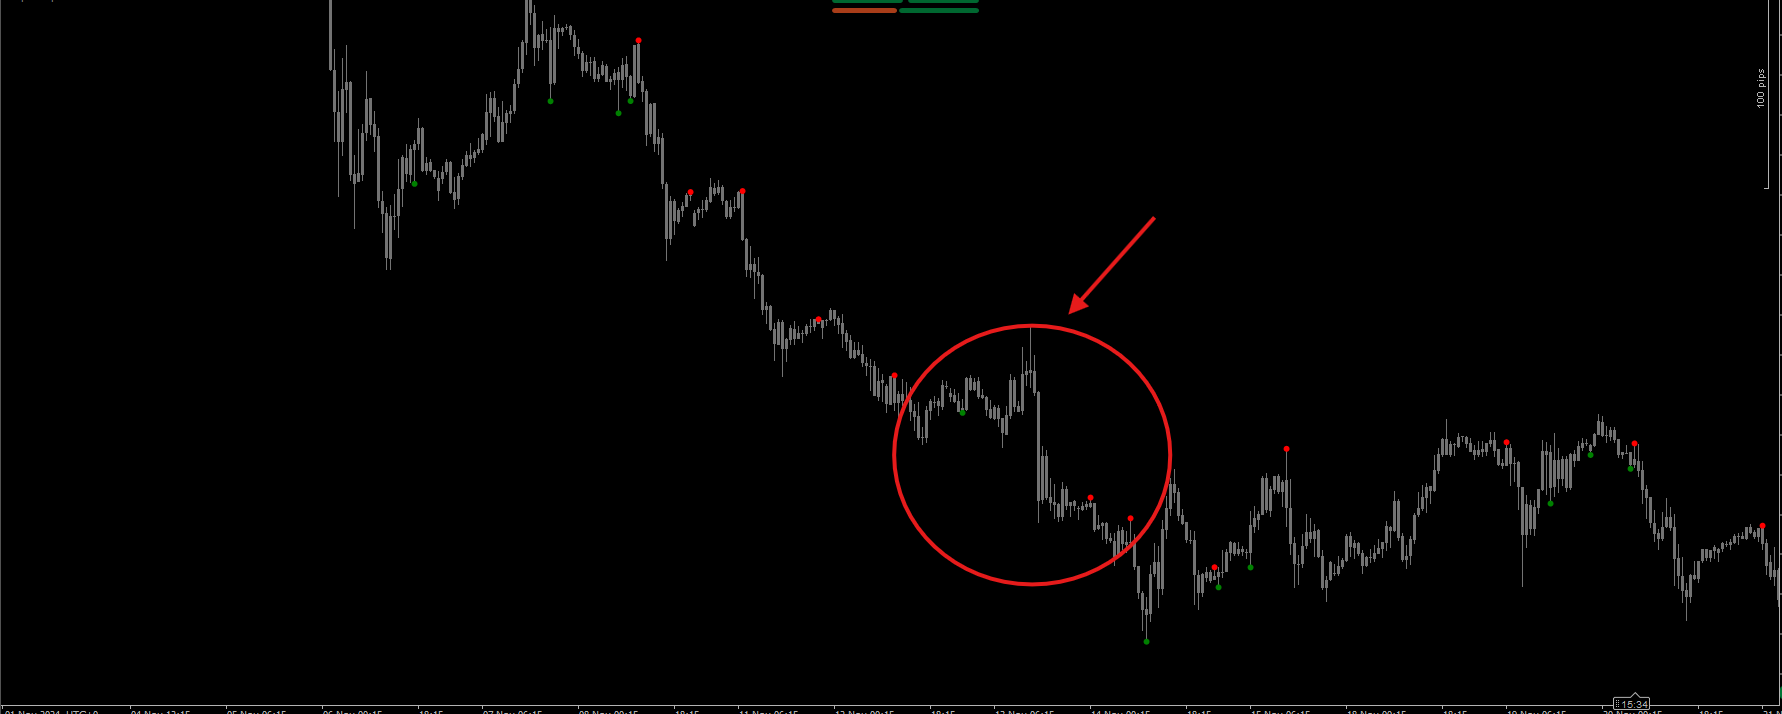
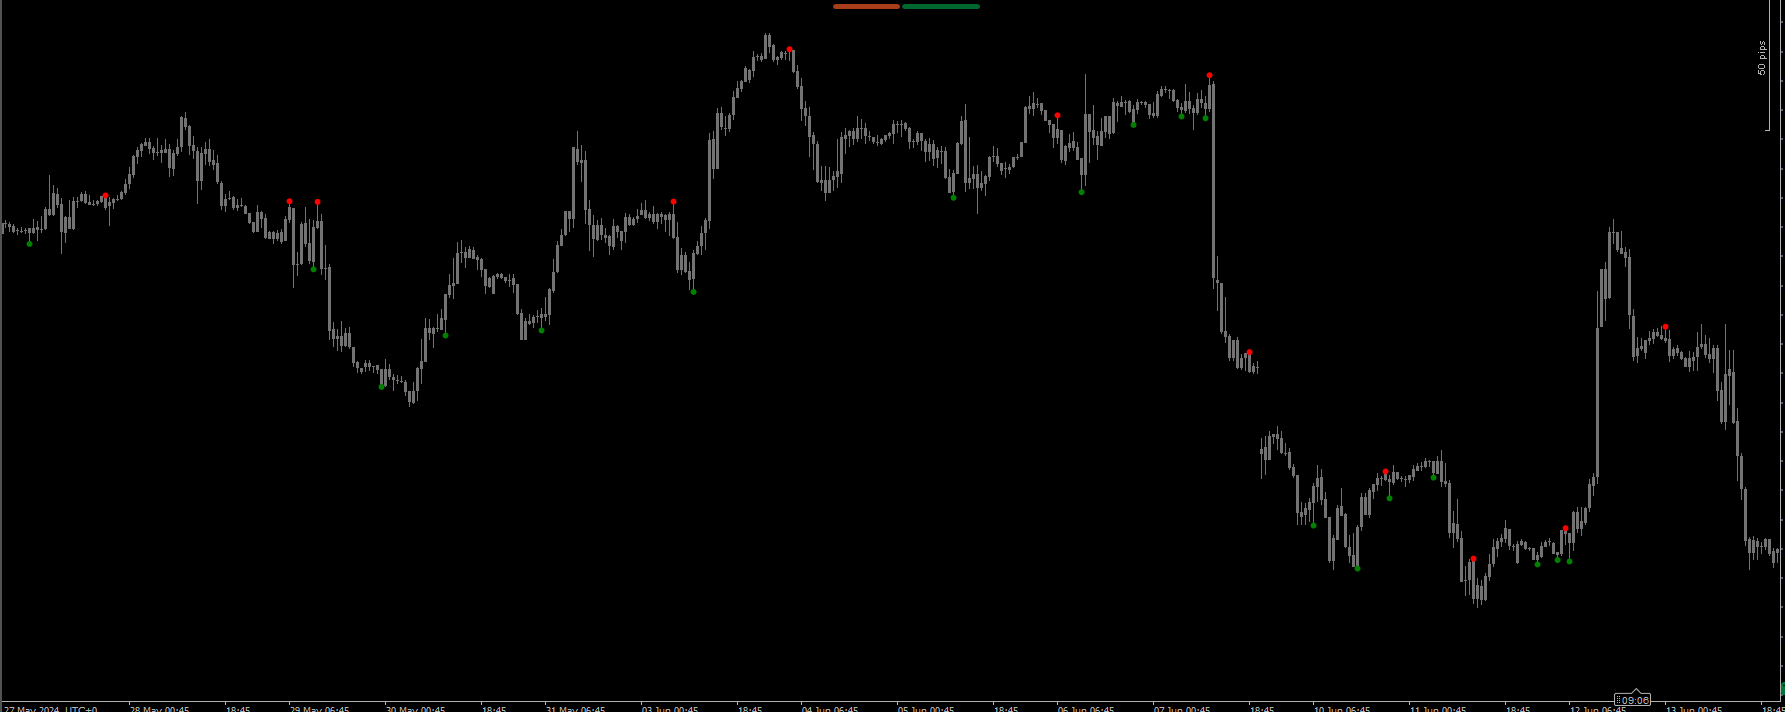
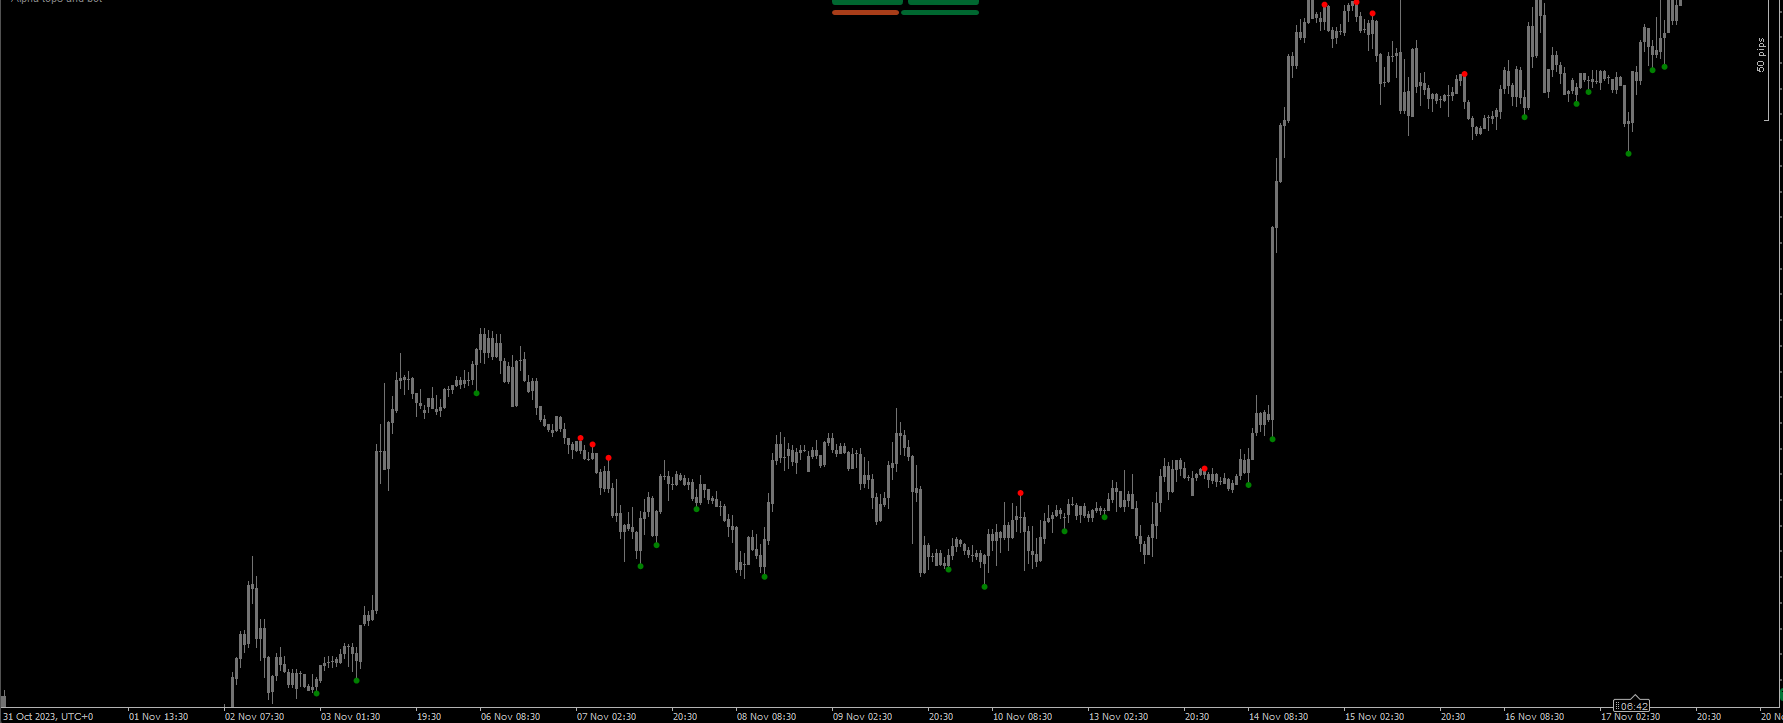
The Major Tops and Bottoms indicator provides a clear visual representation of market dynamics. With major tops marked in red and major bottoms in green, traders can quickly identify potential reversal points. The use of points ensures that these critical levels stand out on the chart, making it easier to spot trading opportunities at a glance.
2. Accurate Calculations
The core of the Major Tops and Bottoms indicator lies in its calculation method. By analyzing the price action of the last four bars, the indicator determines whether a major top or bottom has formed. This is achieved through a series of comparisons of the high and low prices, ensuring that only significant turning points are identified.
3. Enhanced Scalping Techniques
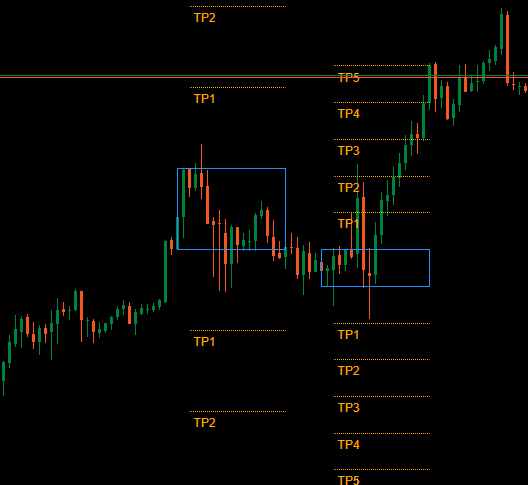
For traders who specialize in scalping, the Major Tops and Bottoms indicator is an invaluable asset. By identifying key turning points, traders can enter and exit positions with precision. The ability to quickly spot major tops and bottoms allows for tight take profit (TP) and stop loss (SL) placements, minimizing risk while maximizing potential gains. Given its accuracy of around 60% to 70% on 45min timeframes it is highly recommended to use stop losses to mitigate potential losses when a signal is missed.
Benefits of Using the Major Tops and Bottoms Indicator
1. Improved Decision-Making
The Major Tops and Bottoms indicator empowers traders to make informed decisions based on accurate market analysis. By identifying significant highs and lows, traders can better anticipate price movements and adjust their strategies accordingly. This improved decision-making process enhances overall trading performance.
2. Increased Profit Potential
With the ability to pinpoint critical turning points, traders can capitalize on market reversals more effectively. The Major Tops and Bottoms indicator enables traders to enter positions at optimal times, increasing their profit potential. By utilizing tight TP and SL levels, traders can maximize their gains while minimizing their exposure to risk.
3. User-Friendly Interface
The Major Tops and Bottoms indicator is designed with user experience in mind. The clear visual representation of major tops and bottoms ensures that traders can easily interpret the signals provided by the indicator. This user-friendly interface makes it accessible for traders of all experience levels.
4. Versatile Application
Whether you are a day trader, swing trader, or scalper, the Major Tops and Bottoms indicator can be applied across various trading strategies. Its versatility makes it a valuable addition to any trader's toolkit, allowing for greater flexibility in adapting to different market conditions.
Conclusion
In conclusion, the Major Tops and Bottoms indicator is a powerful tool that enhances trading strategies by identifying critical market turning points. With its accurate calculations, visual representation, and compatibility with the cTrader platform, this indicator empowers traders to make informed decisions and capitalize on market movements. With an accuracy rate of around 70%, it is crucial to implement stop losses to minimize losses when a signal is missed. For optimal results, it is recommended to use this indicator on a 45-minute time frame. Whether you are a seasoned trader or just starting, the Major Tops and Bottoms indicator can significantly improve your trading performance. Elevate your trading experience today by incorporating this innovative tool into your strategy.