IR Multi Data
"IR Multi Data" logo
5.0
03/09/2025
61
Desktop
Since 23/01/2025
Free installs
3251

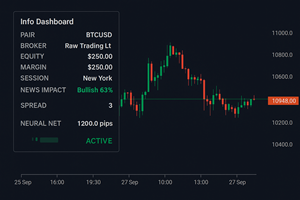
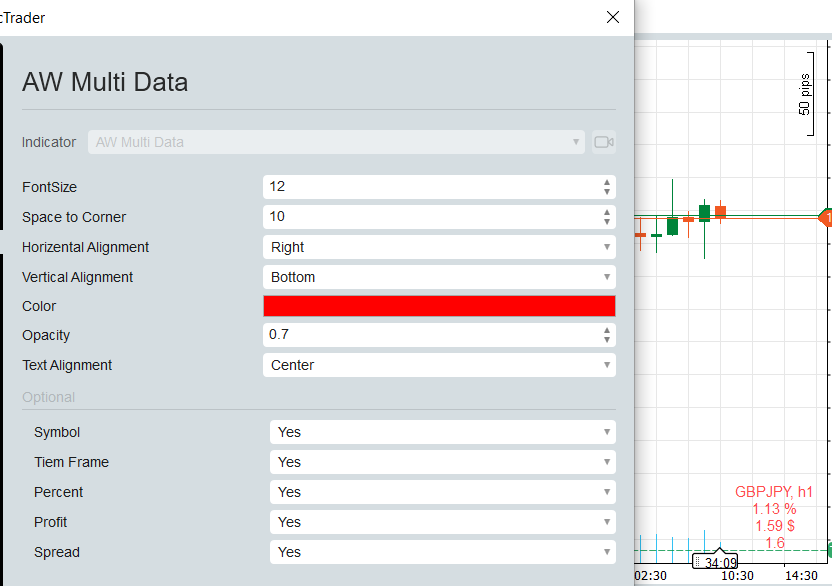
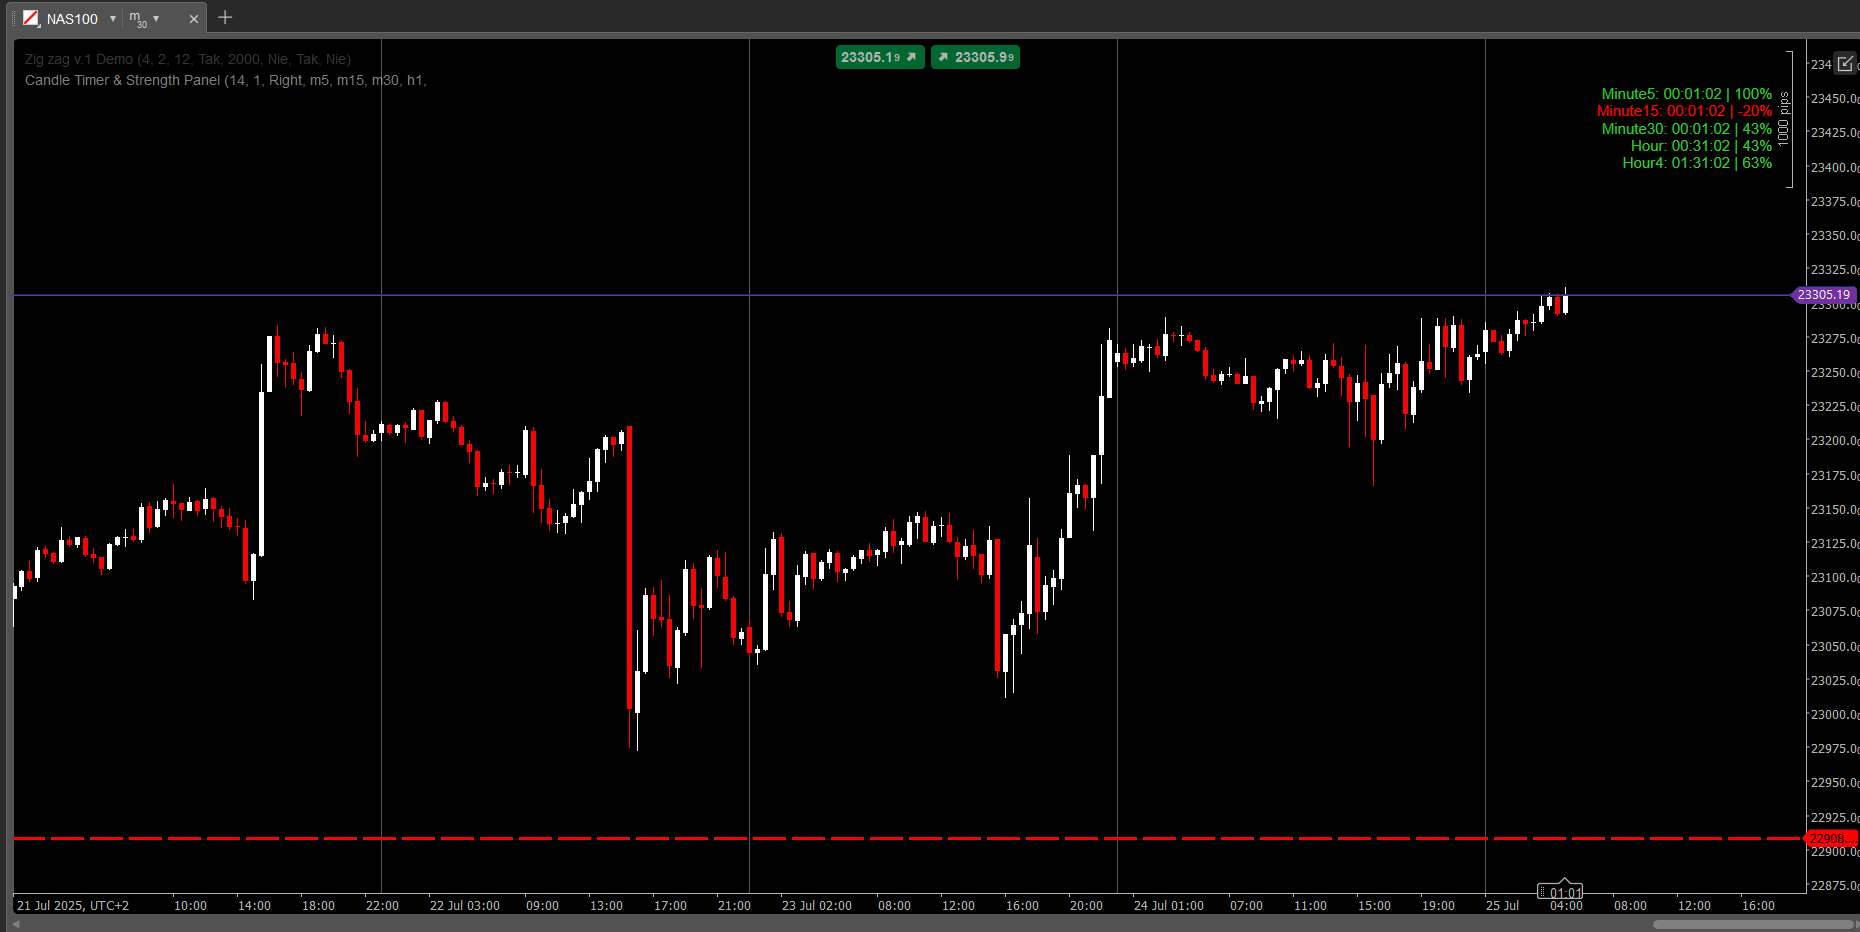
show symbol and time fram, daily net profit percent, daily net profit, and spread ln your chart.

consider that timezone set to utc to show daily proift correctly.

5.0
Reviews: 1
5
100 %
4
0 %
3
0 %
2
0 %
1
0 %
Customer reviews
September 3, 2025
اختيار موفق لك الحمد
More from this author
IR Candle MTF
with this indicator you could see other time frame candle in your chart.
IR Spread
show spread on chart
IR Macd on Chart
this indicator show macd on chart.
IR Macd + MacdLine
some user add moving average to macd to see better. in ctrader 4.3.11 there is a problem with this . I make a macd tha
IR Moving Average
 this moving include everything that a trader needs from Moving Average.
IR Ichimoku Macd
this indicaotr show distance between Tenkan to Kijun, Close to Kijun and Close to Tenkan 
IR Slowing Moving
Add Slowing to IR Moving Average.
IR CheckList
you could put your check list in your chart you could split your test with “,” you could put your checklist in indicat
IR Moving MTF
multi time frame moving averge. you could choose different type of price like median ,high and ... and differnt type of
IR Coral
Coral indicator
IR VLine
don't move to the end of chart after timeframe changing. it should be better to use for near history. for long history
IR Close MTF
this indicator show other time frame close in lower time frame. for ex: show daily close in m 15.
IR Candle Open
IR Candle Open plots customizable opening price lines for daily, weekly, and monthly candles
IR Open Connector
This indicator connects the opening prices of higher timeframe candles (Daily, Weekly, Monthly, or
You may also like
Market Sessions - Free
Track major trading sessions (Tokyo, London, New York) with customizable colors and visual sessions on your chart.
Indicator
Indices
RSI
XAUUSD
+5
cAlgoBuddy - Composite Index RSI
What Constance Brown did with the RSI was to input a momentum calculation within the RSI itself. This the Composite RSI.
Candle Timer & Strength Panel Demo -
Candle Timer & Strength Panel DEMO for cTrader DEMO VERSION – 24 hours free trial! This is a DEMO version of the Candle
SwingHighLow
Auto-detect swing highs/lows. Spot reversals, map structure, and filter noise with adjustable strength.
Retro_Shooting_Game
trading stress-relief “mini-game”
mIntrinsicRecursiveValue
Intrinsic Recursive Value Indicator
Indicator
RSI
EURUSD
MACD
Supply&Demand
Precision Supply & Demand zones indicator—automatically plots key buy/sell areas on your chart for smarter entries.
Indicator
RSI
ATR
Signal
+1
Trading Fusion Bars 2
This indicator works best as a trend-confirmation tool—wait for multiple signals!
Supertrend Indicator v1.1
SUPERTREND INDICATOR v1.1
IR Spread
show spread on chart
Indicator
Signal
MeetAlgo_ChannelTrading_cTrader
Channel Trading is a volatility-based indicator using envelope theory to spot price breakouts and trade signals.
Indicator
NAS100
Breakout
XAUUSD
+12
Cross EMA Pro
Cross EMA Pro – Trend Reversal Indicator
Previous Day Liquidity Zones (PDH - PDL)
Useful indicator for traders who want to visualize key price levels based on previous daily highs and lows.
Indicator
NAS100
NZDUSD
Martingale
+26
Info Dashboard_noSourceCode
Read the market with AI: live sentiment, news impact, equity, spread & neural net signals in one dashboard.
Top-rated
Free
VWAP Pro
Advanced VWAP with up to 30 anchored levels, multiple timeframes, memory mode, standard deviation bands & simple GUI
Indicator
NAS100
NZDUSD
Breakout
+11
Consolidation Zones
Identify and trade breakouts with Consolidation Zones! Visualize price consolidation areas for trading opportunities.
Fx4U.Multi Trend Line Indicator
Allow trader to draw multi trendlines in different timeframes on one chart,Give trader an overview of the current market
R S
This indicator is a simple, single-timeframe tool for showing candle sentiment directly on your chart. If you want a mor