Indicator
RSI
Indices
Commodities
Stocks
Forex
Crypto
FiboTrend-Pro
"FiboTrend-Pro" logo
5.0
23/09/2025
2
Desktop
Since 22/09/2024
Sales
88
Free installs
8327
"FiboTrend-Pro" uploaded image"FiboTrend-Pro" uploaded image"FiboTrend-Pro" uploaded image"FiboTrend-Pro" uploaded image"FiboTrend-Pro" uploaded image

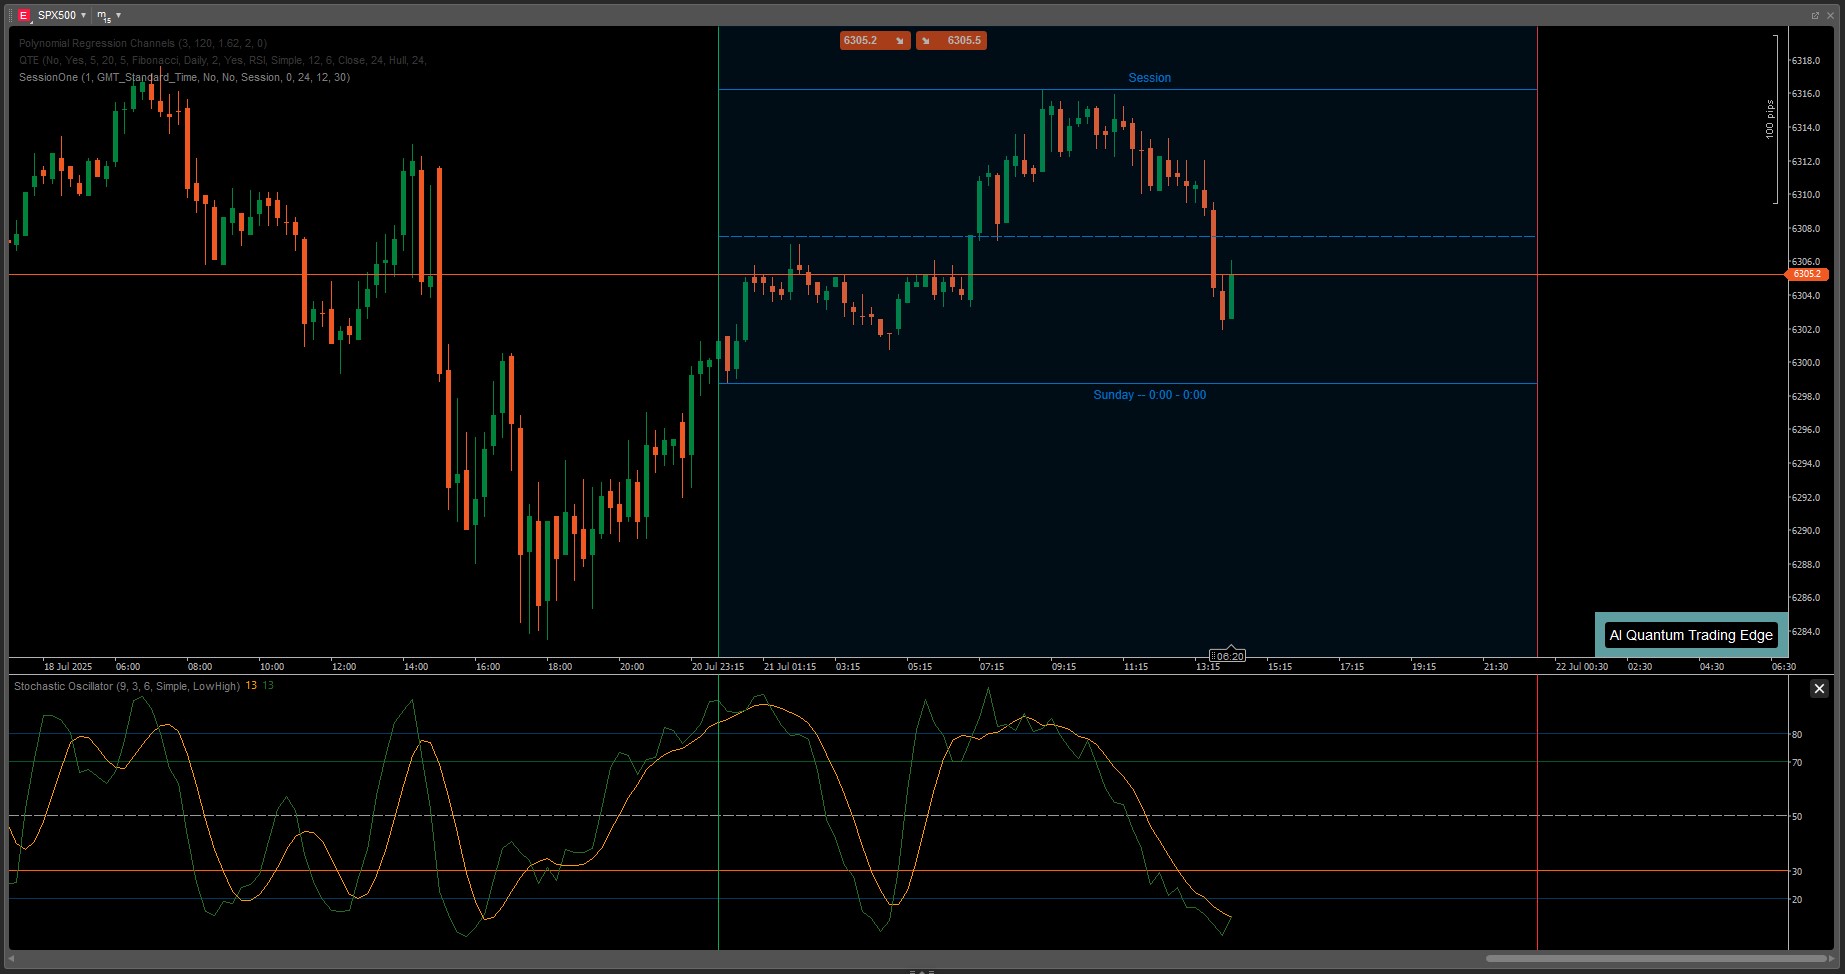
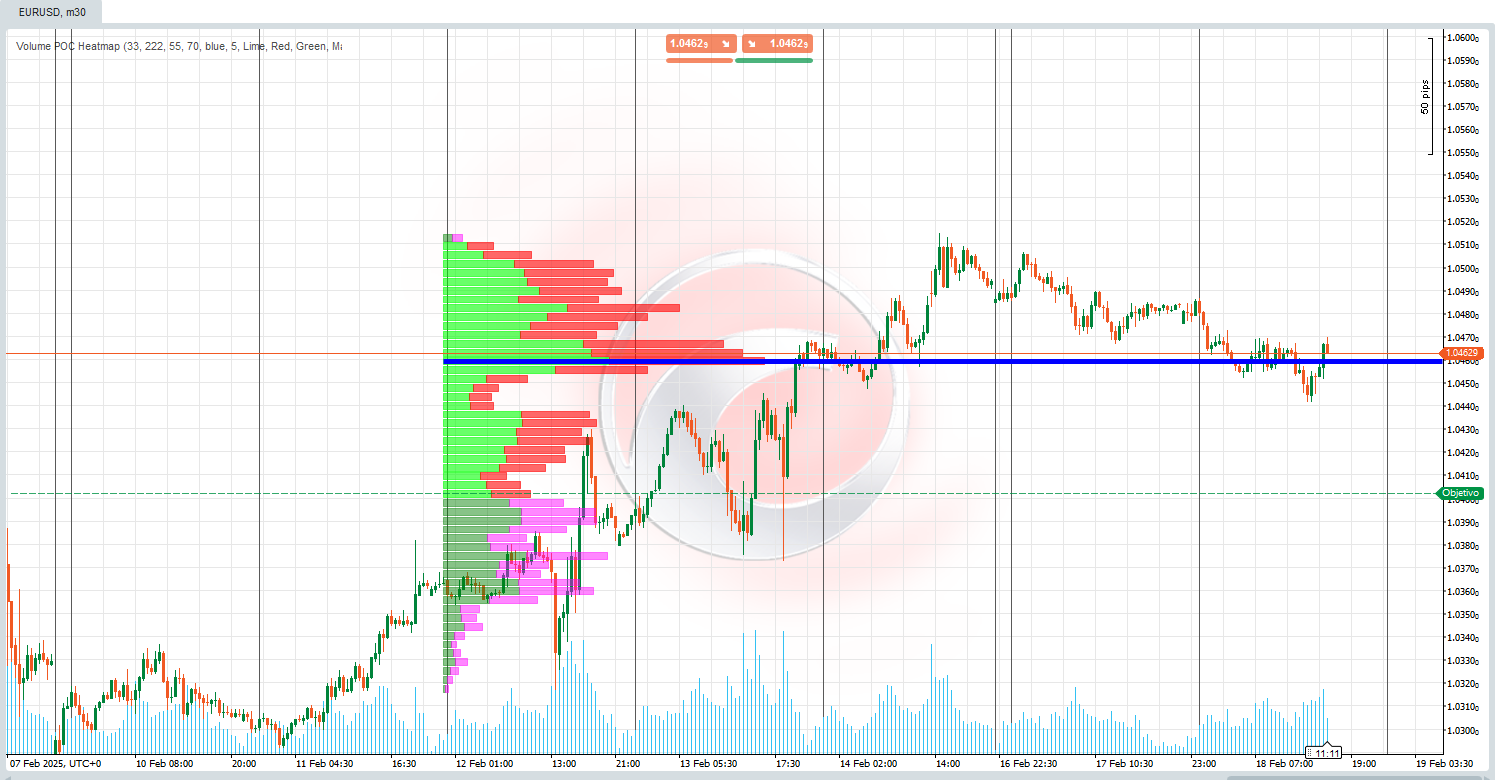
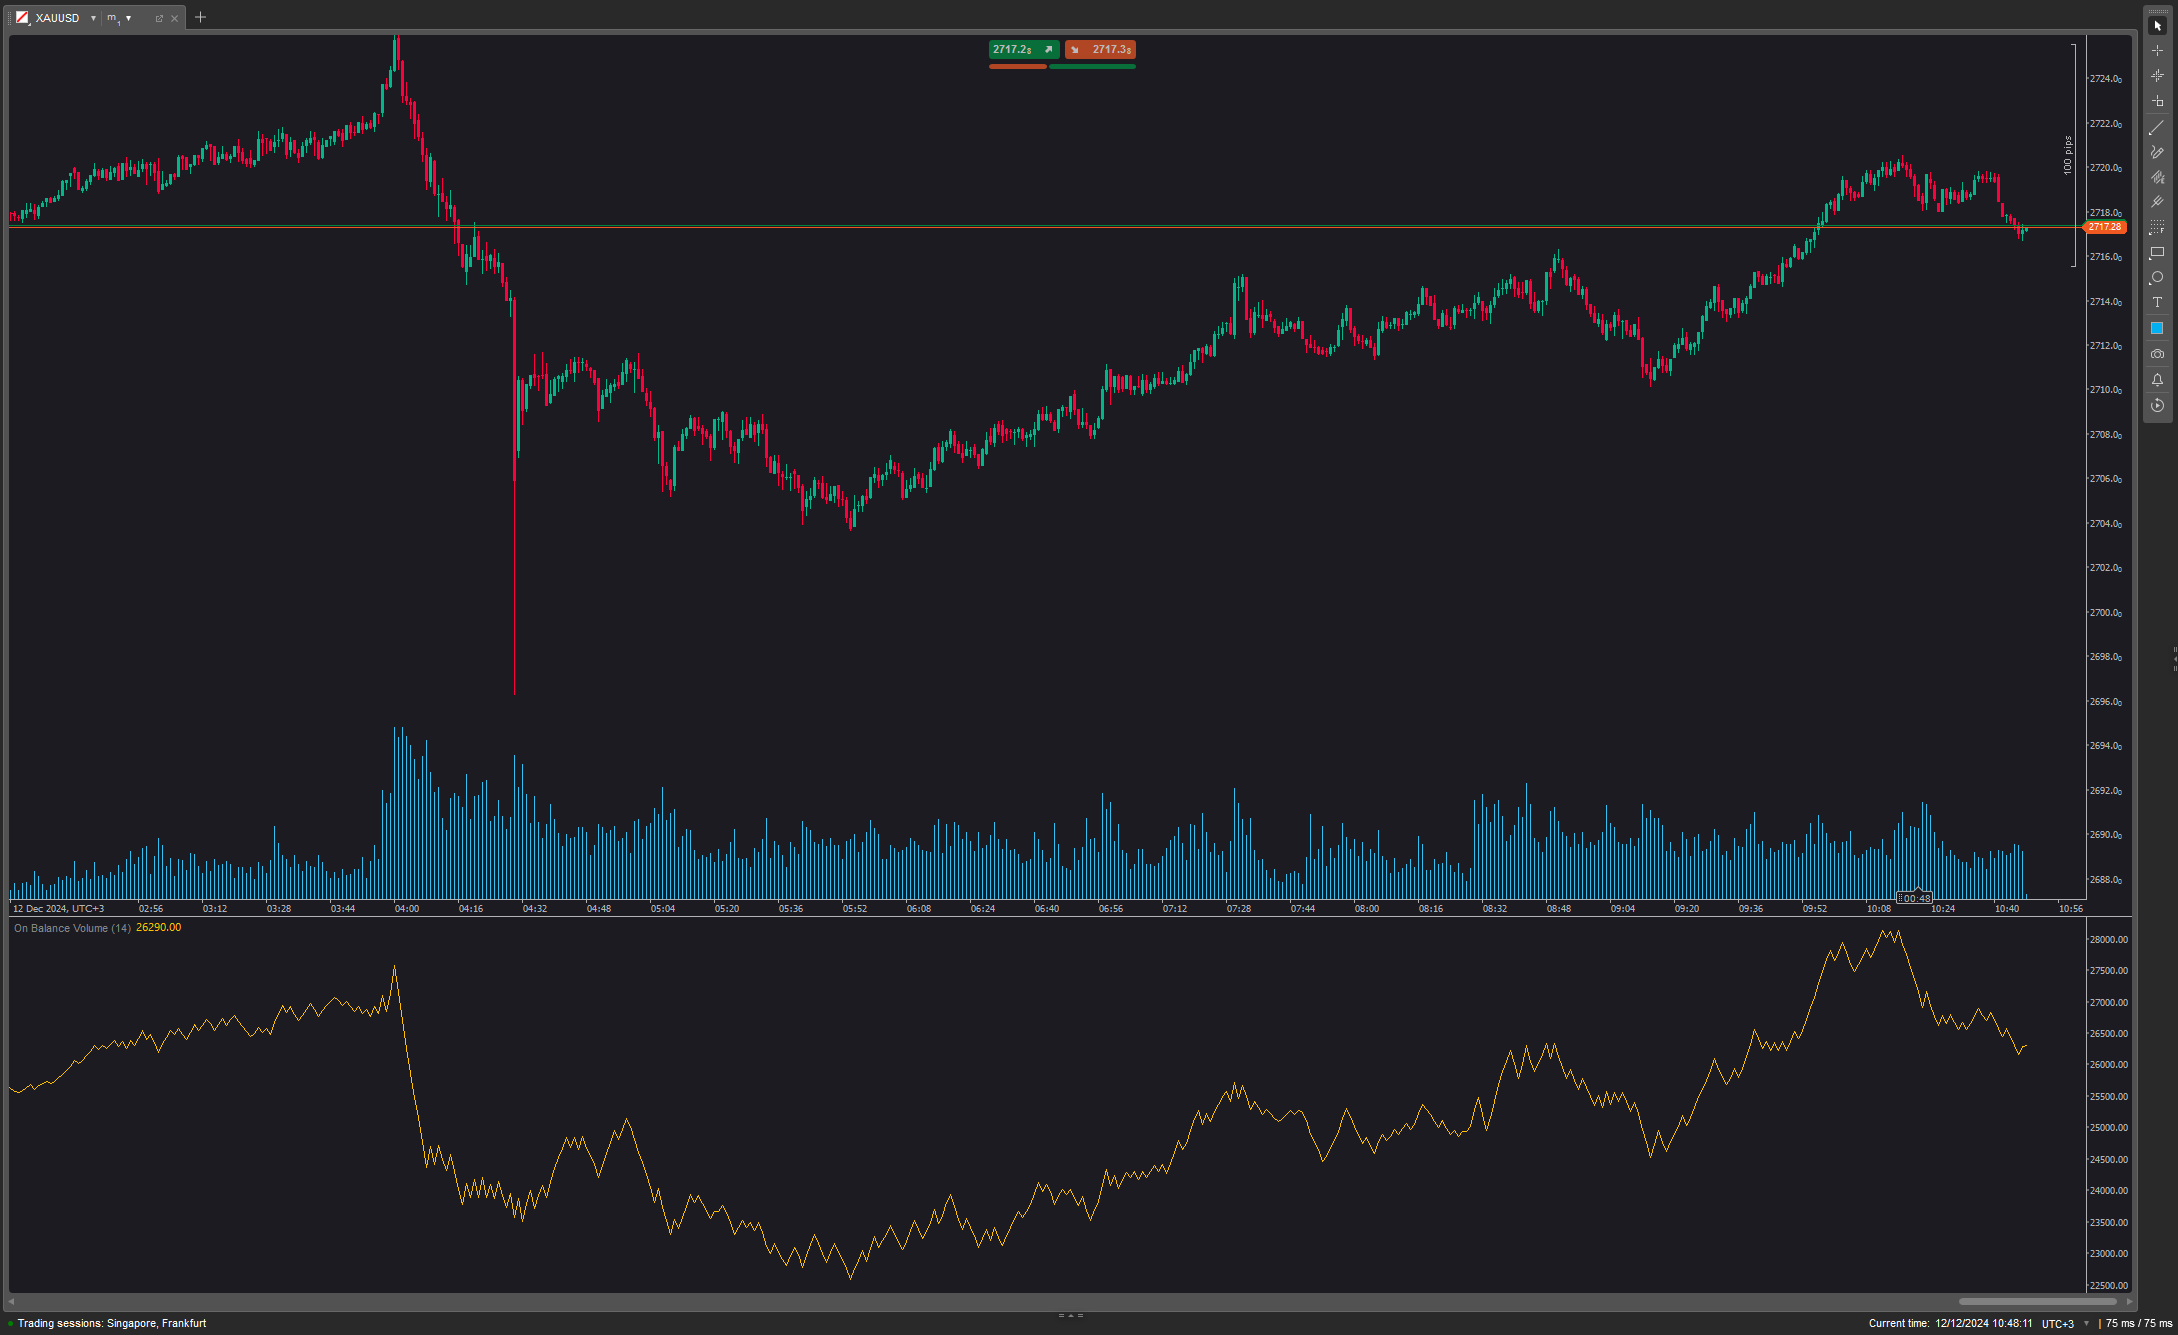
Indicator Description:

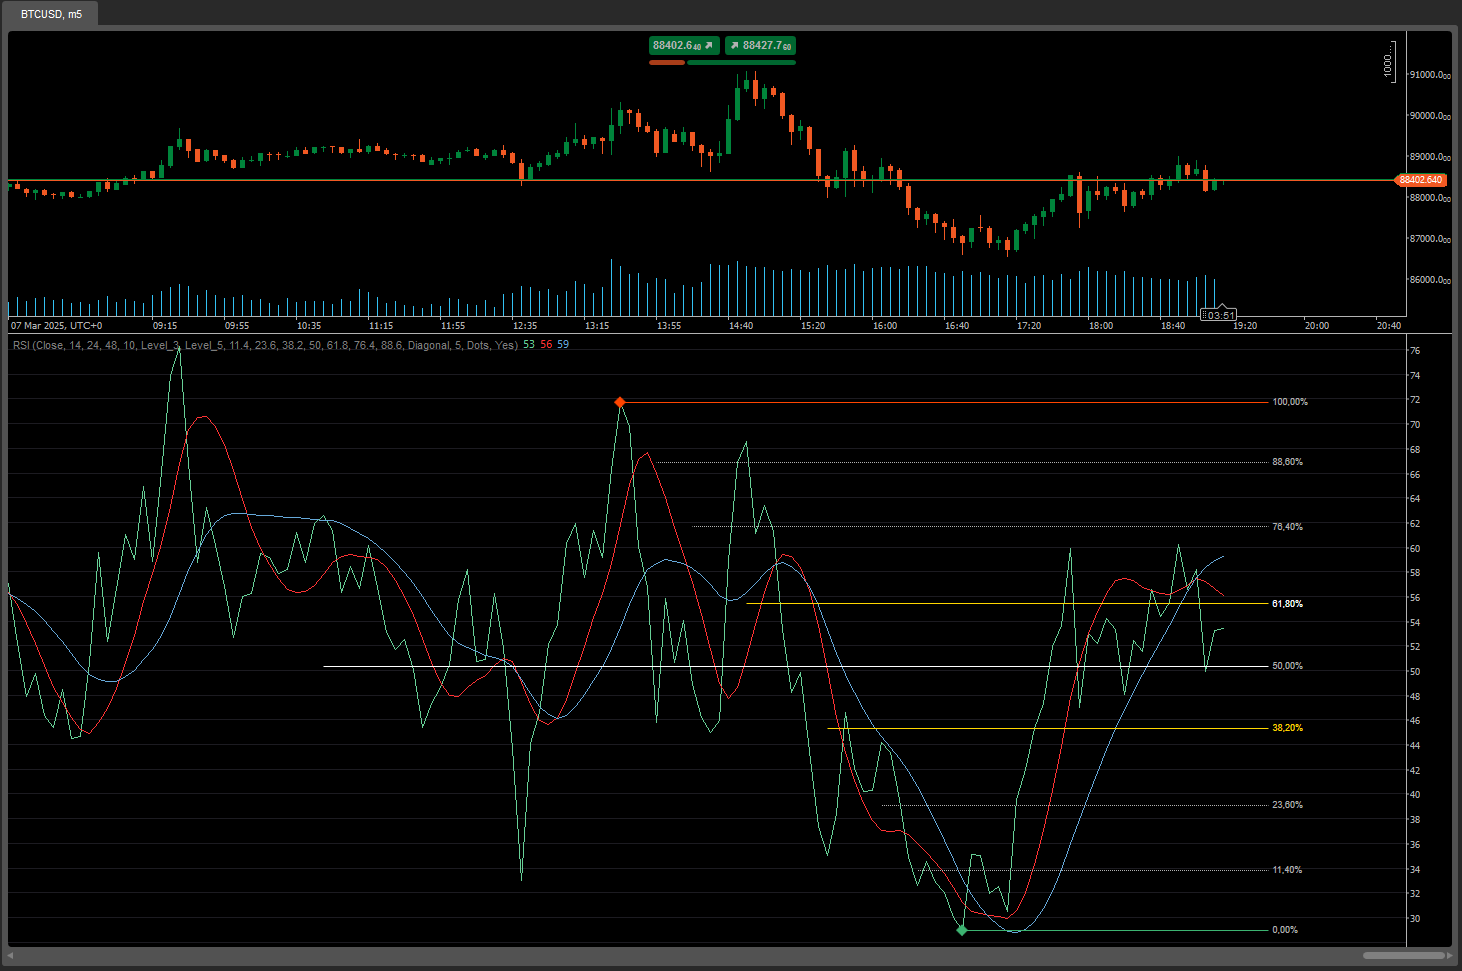
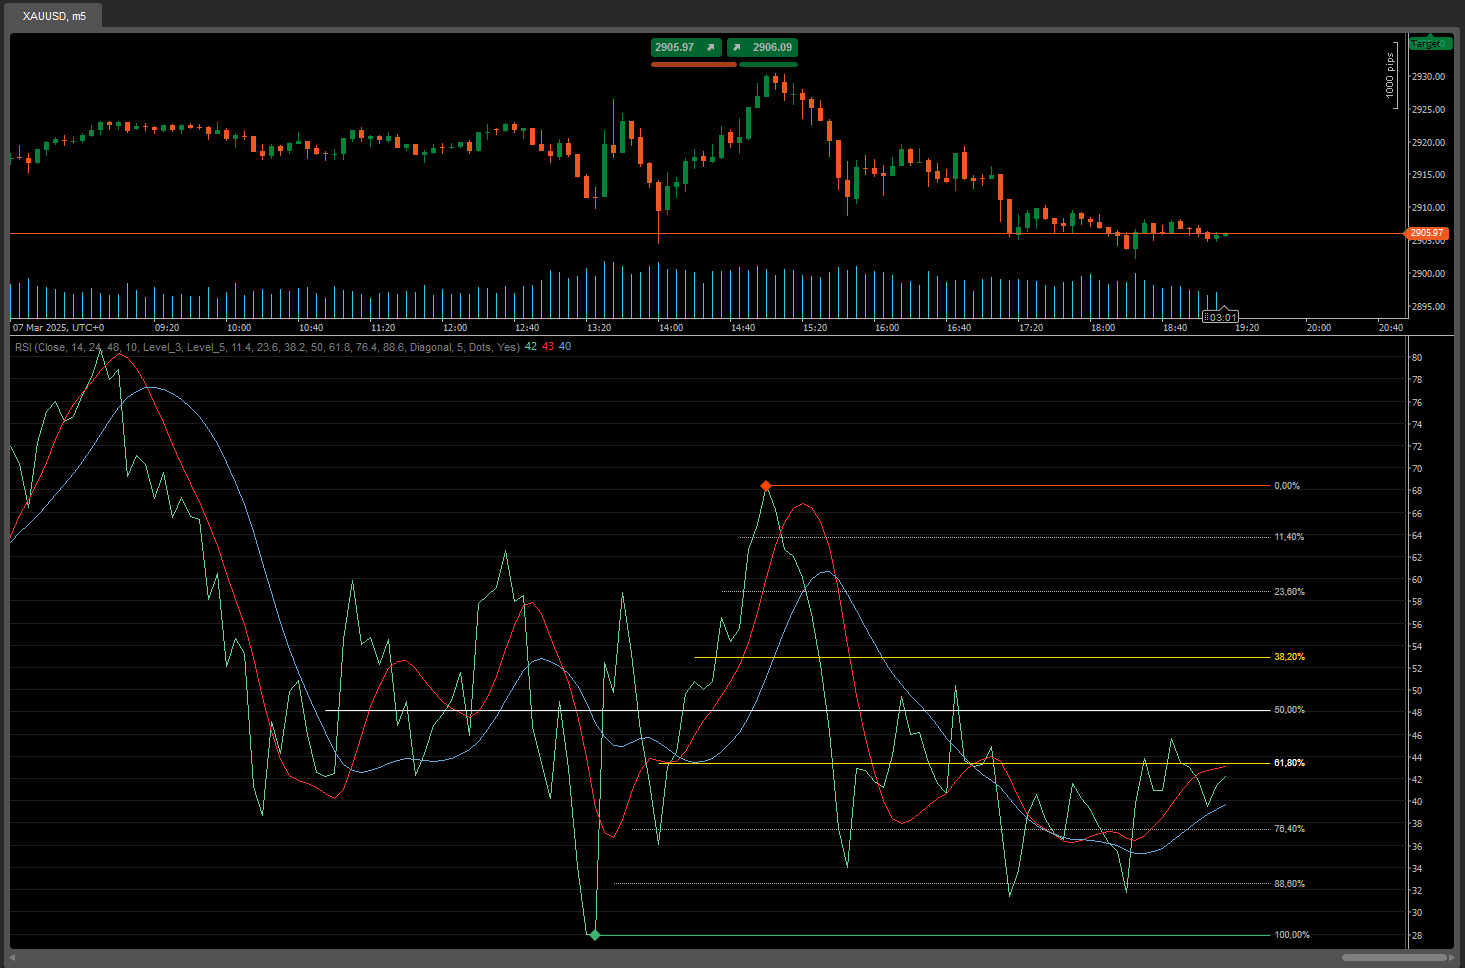
🎯 RSI Indicator with Fibonacci Levels and Hull Moving Averages 🚀

Want to take your technical analysis to the next level? This indicator is for you! It combines the best of three powerful tools: the RSI (Relative Strength Index)Fibonacci Levels, and Hull Moving Averages to provide you with a comprehensive and accurate view of the market.


Key Features:

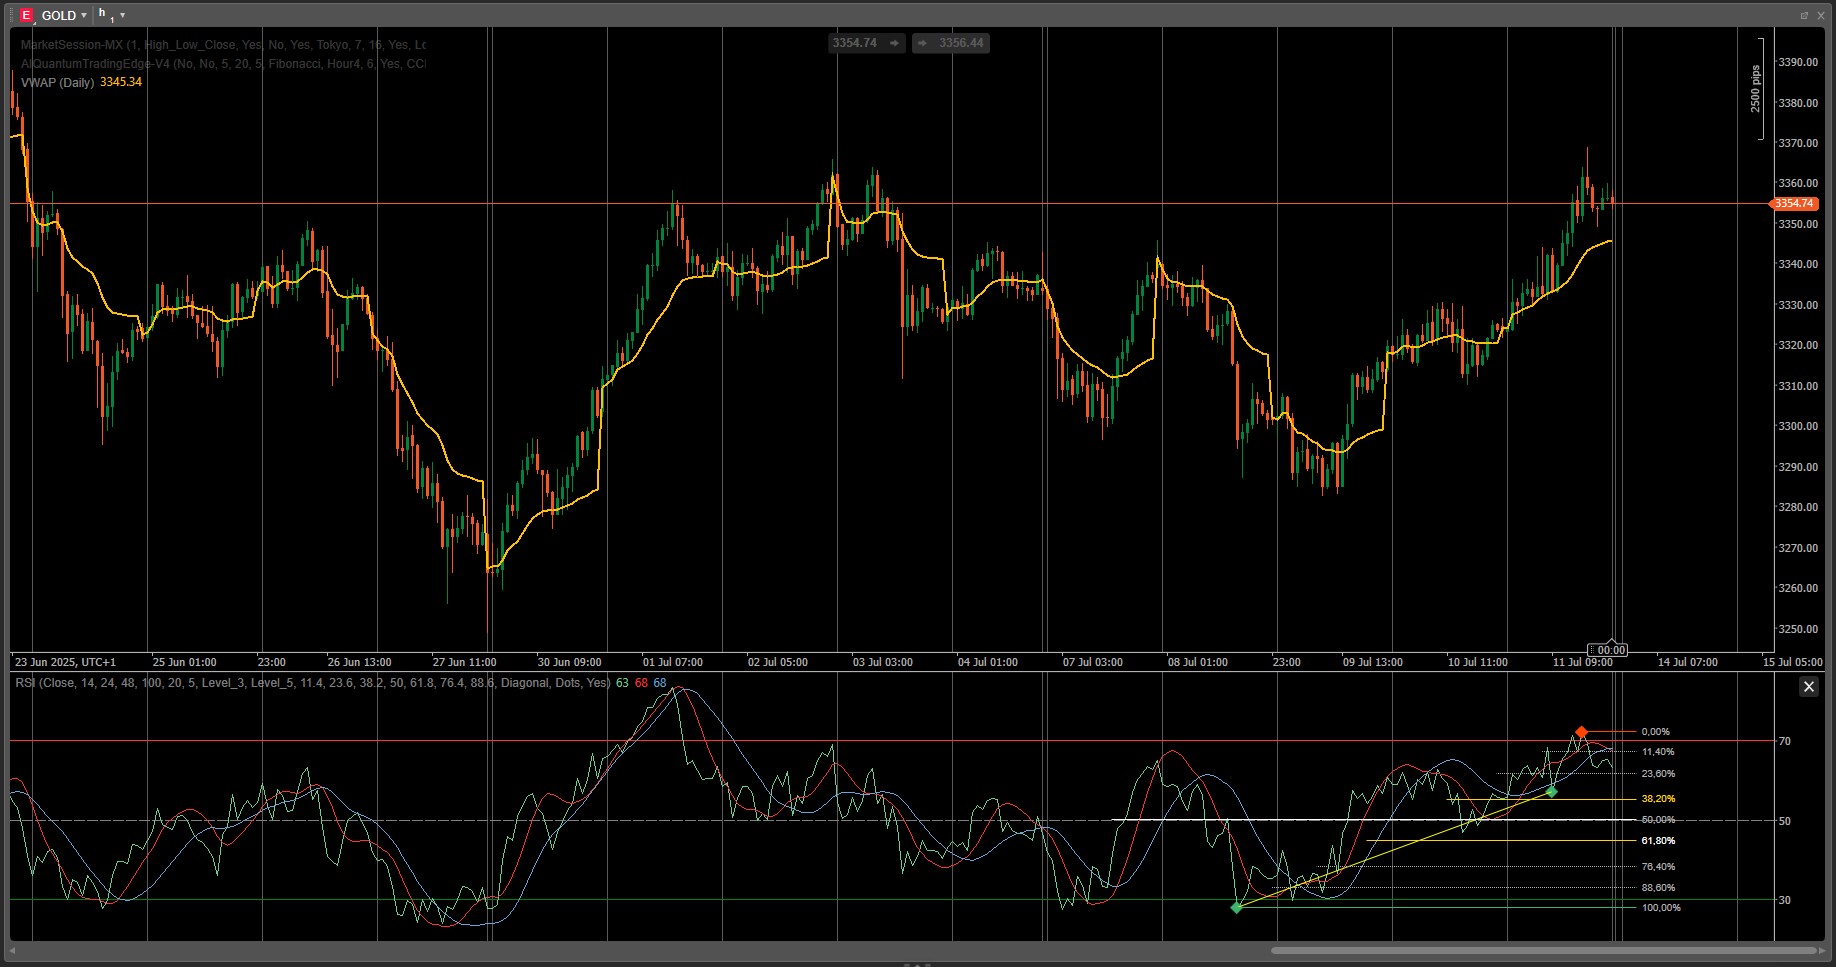
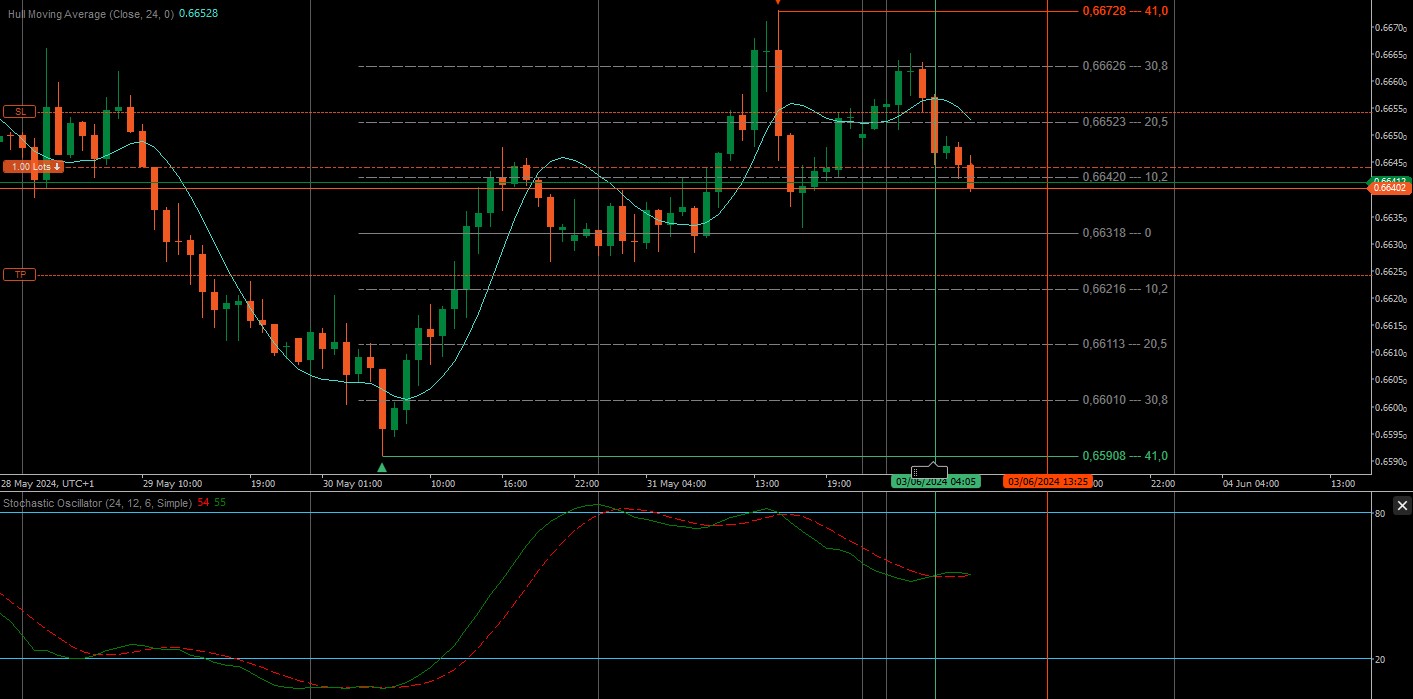
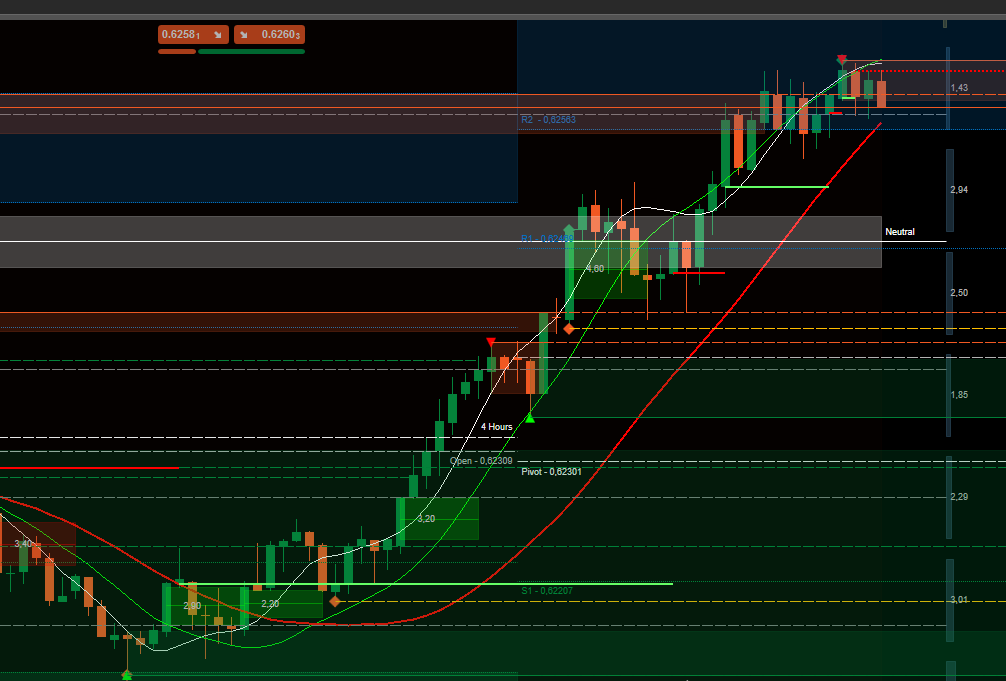
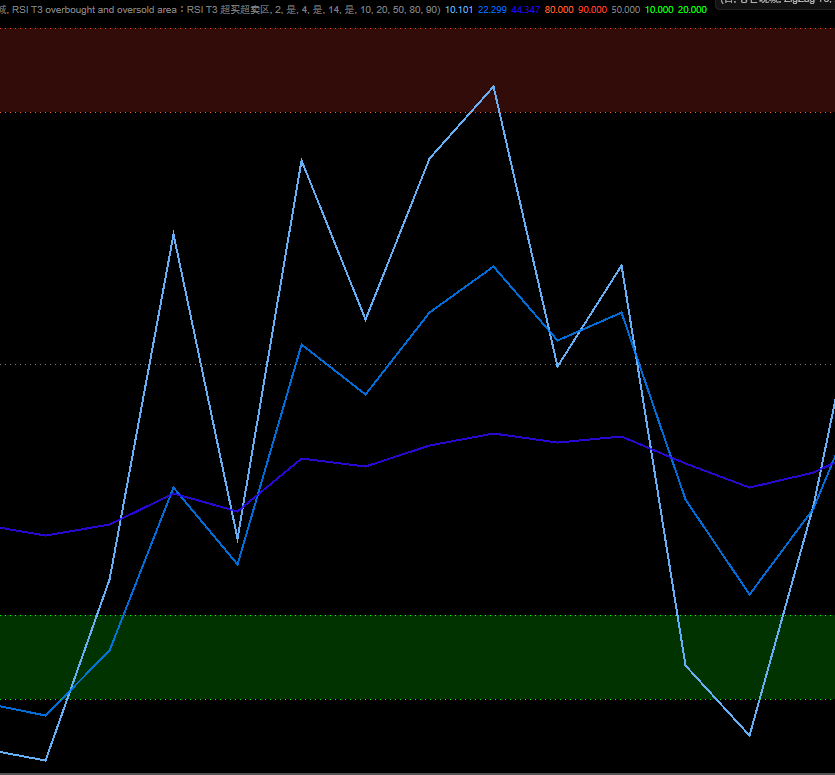
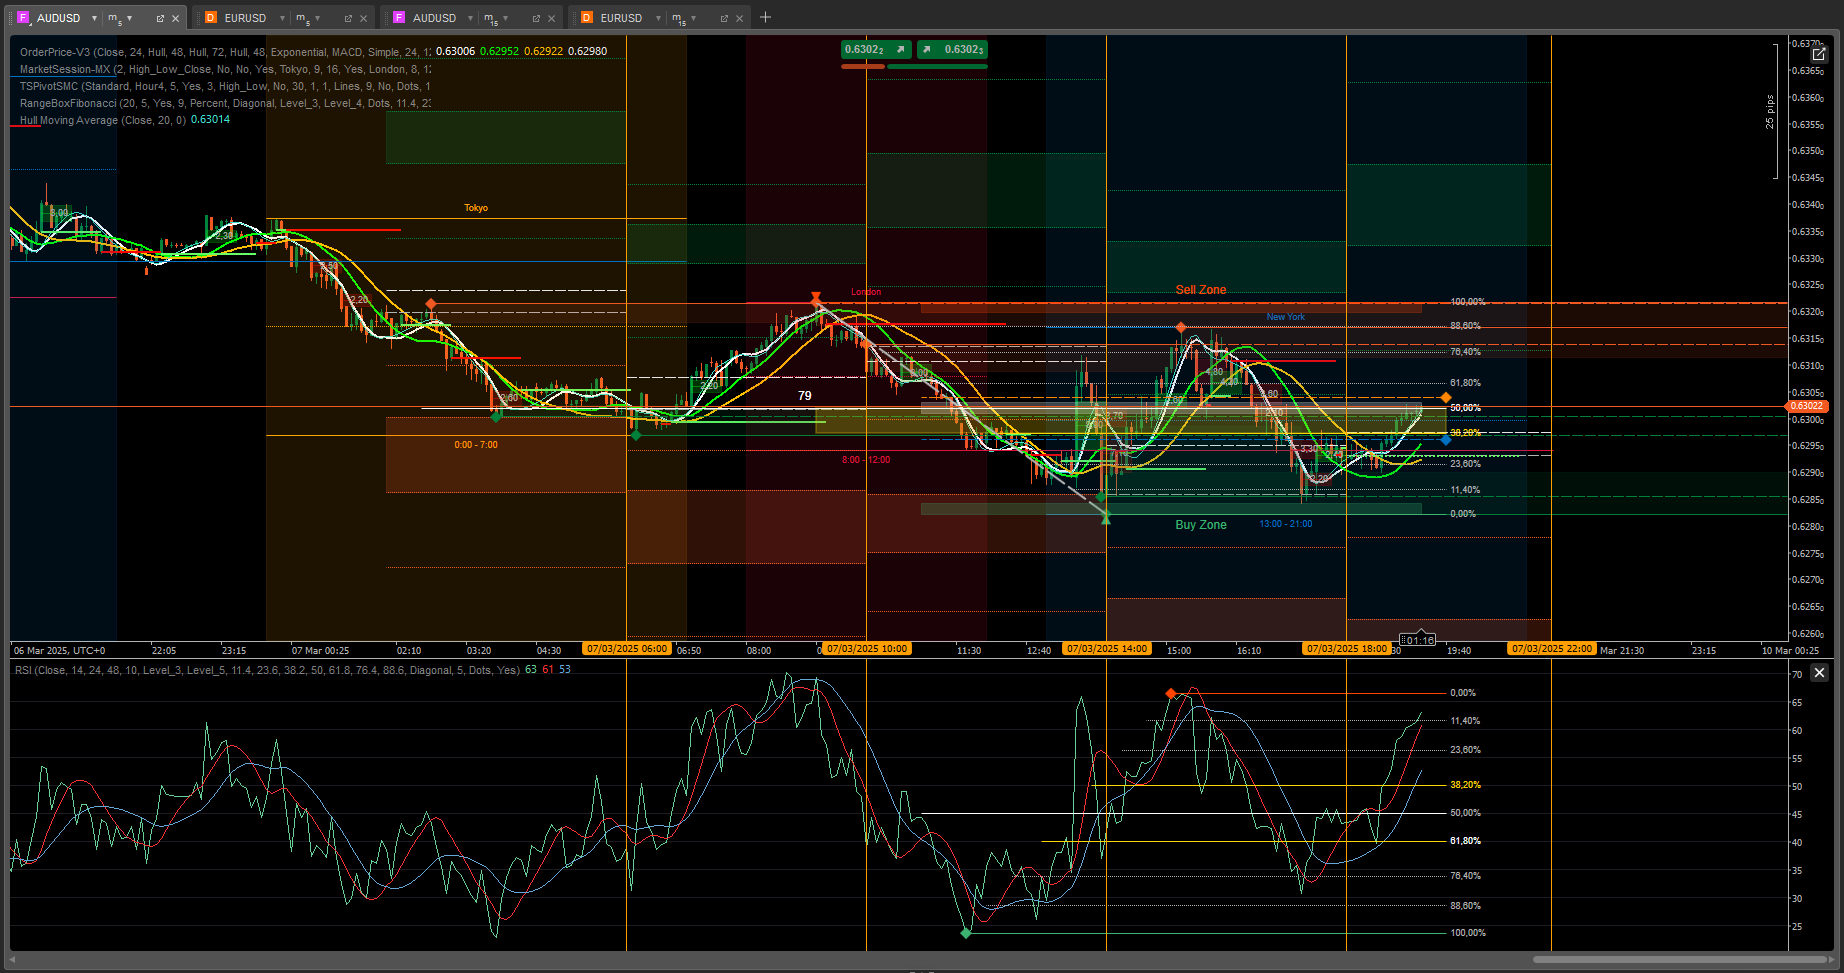
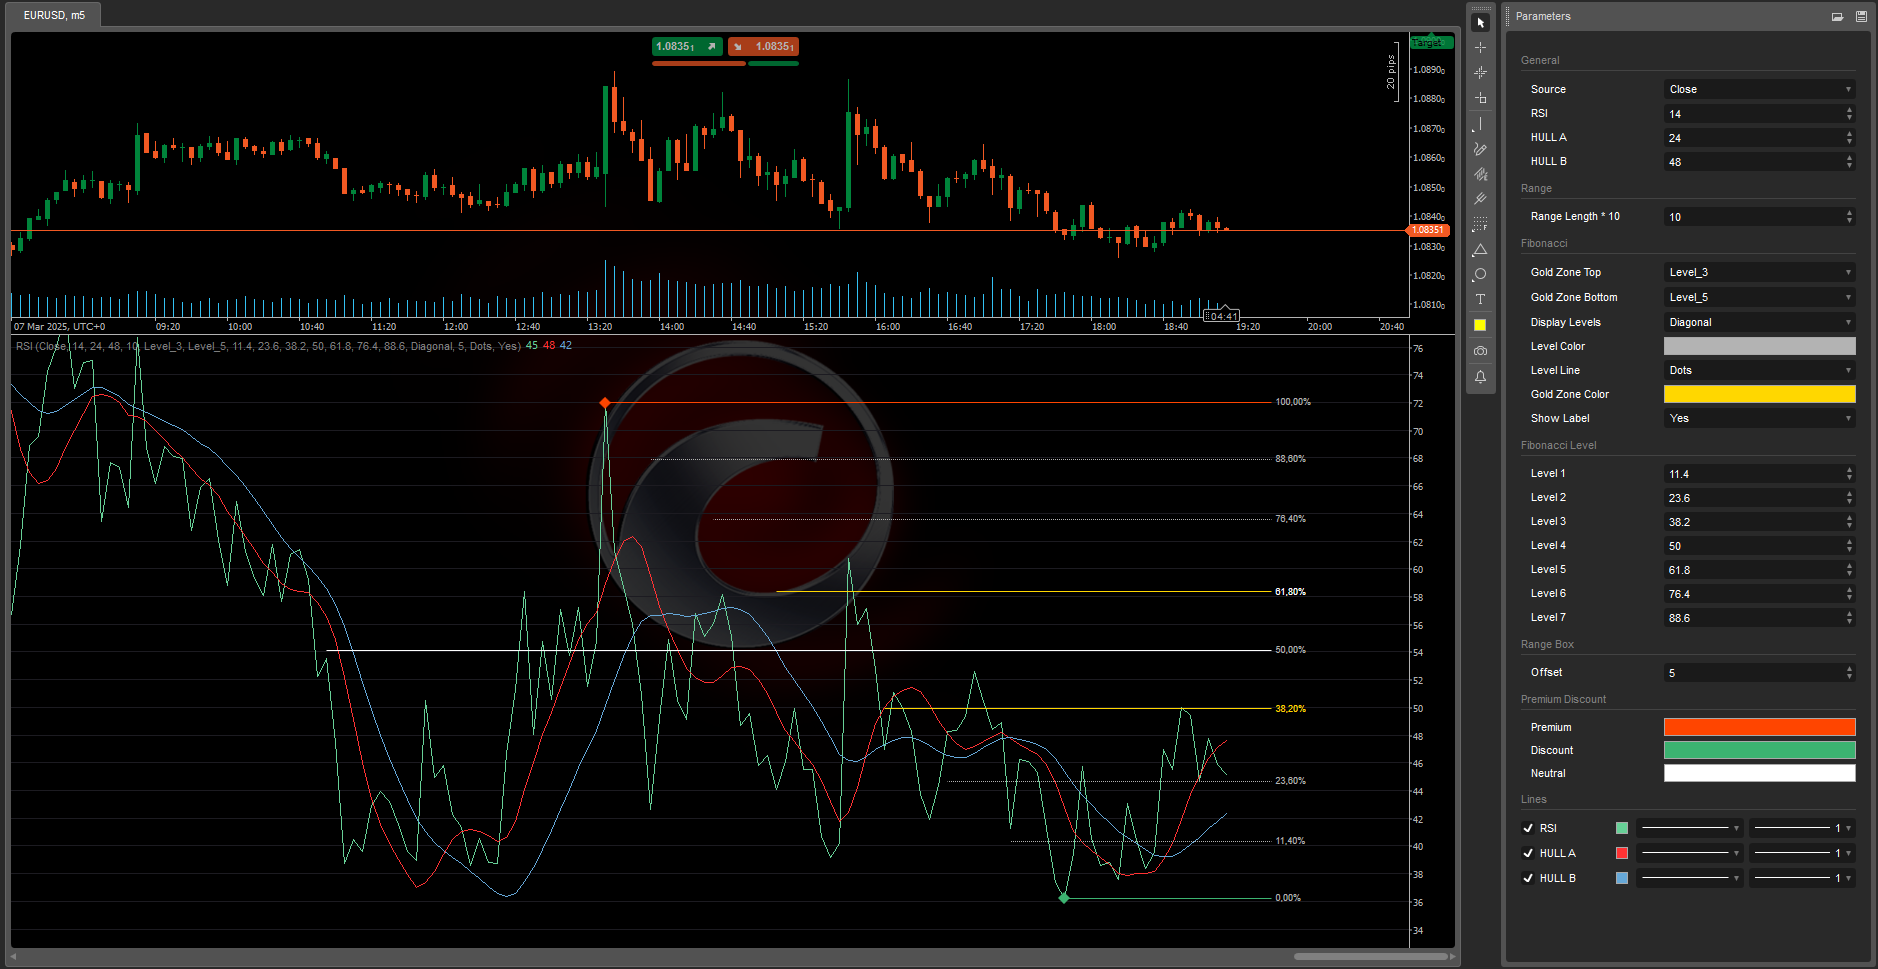
  1. RSI with Fibonacci Levels:
    • Identifies key support and resistance zones based on Fibonacci levels.
    • Helps detect potential reversals and continuations with greater precision.
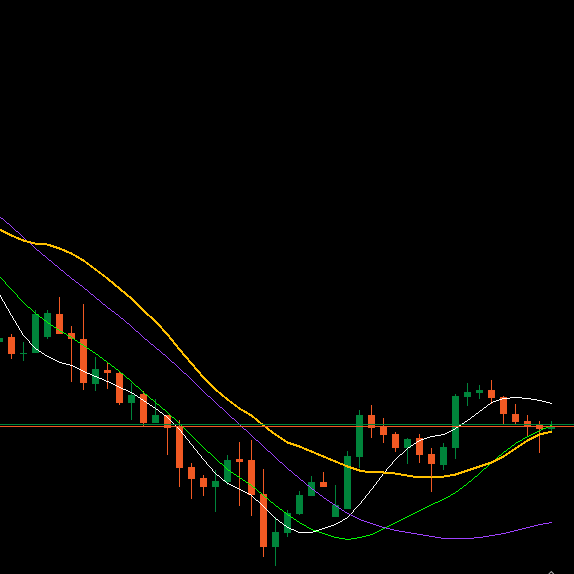
  2. Hull Moving Averages:
    • Includes two Hull Moving Averages (Hull A and Hull B) to filter out market noise and capture trends more efficiently.
    • Provides clear entry and exit signals based on crossovers and direction changes.
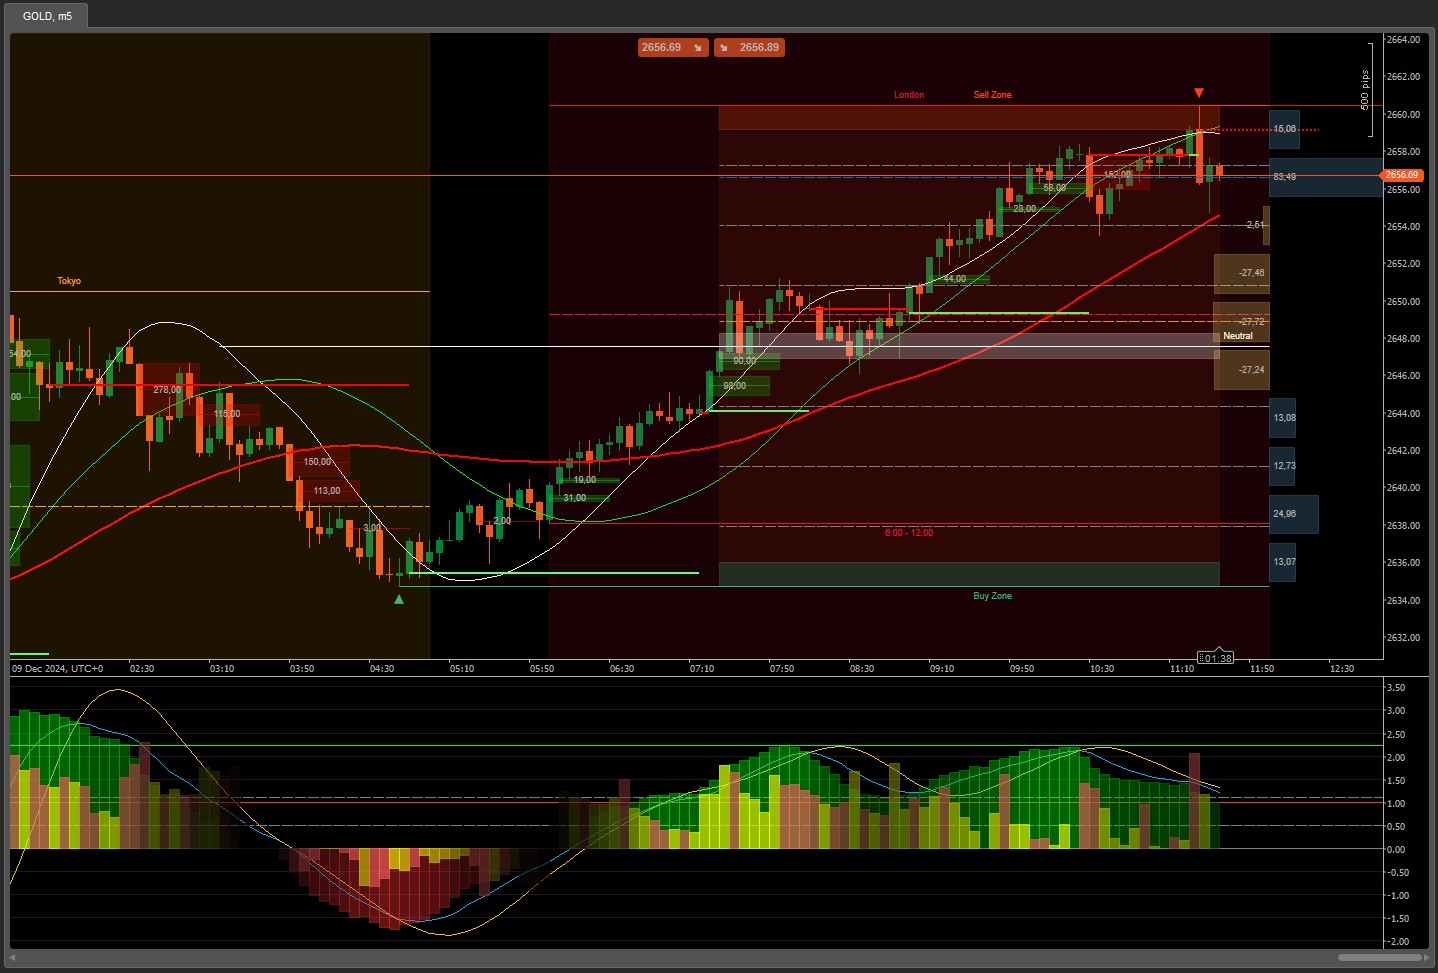
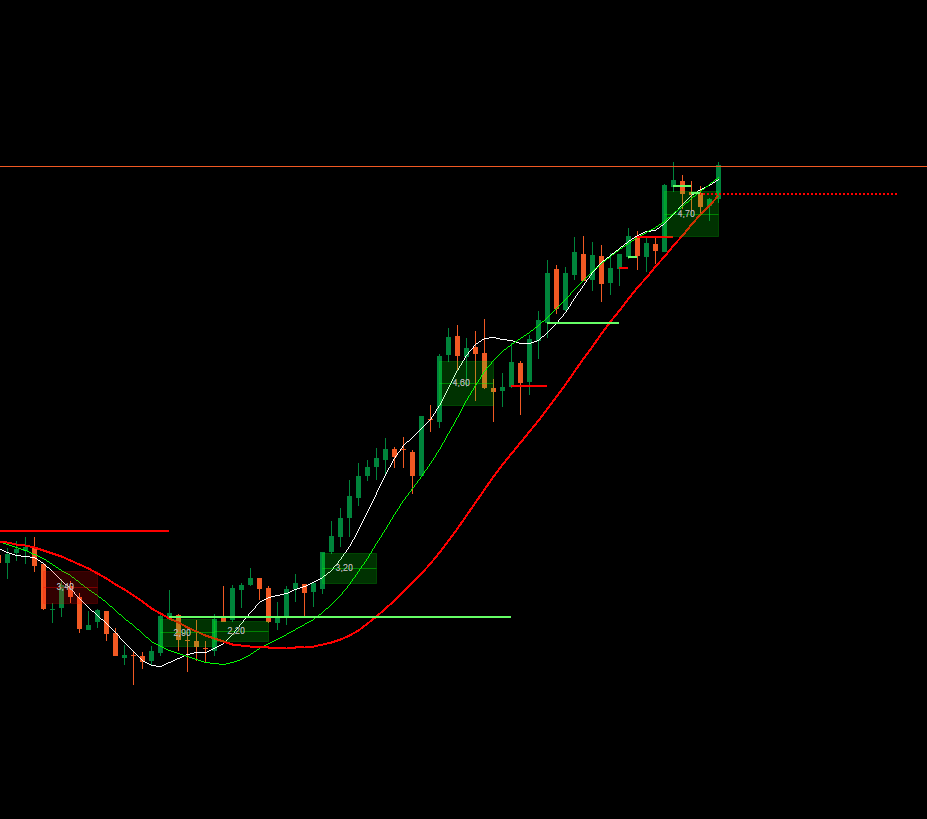
  3. Trend Change Zones:
    • Highlights critical areas where trend changes are likely to occur, helping you anticipate significant moves.
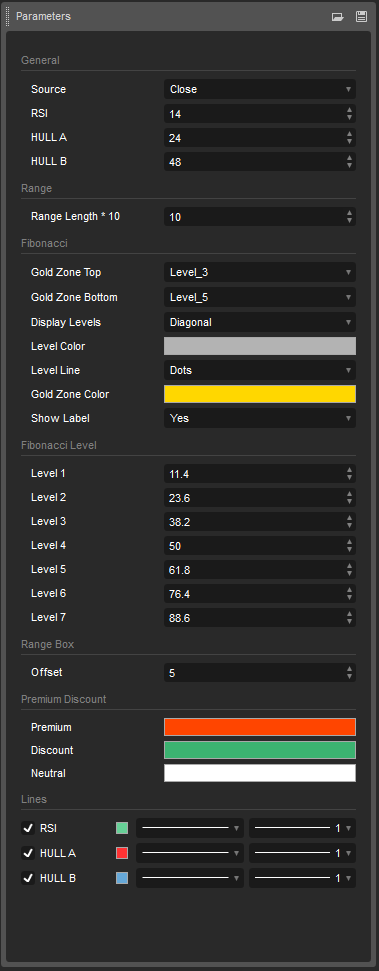
  4. Full Customization:
    • Adjust Fibonacci levels, colors, and line styles to suit your preferences.
    • Configure the Hull Moving Averages to fit your trading strategy.
  5. Clear Visualization:
    • Well-defined icons and trendlines for quick and easy interpretation.
    • Optional labels to display Fibonacci levels in percentages.

Benefits for Traders:

  • Greater Accuracy: Combines RSI with Fibonacci levels and Hull Moving Averages for more reliable signals.
  • Time-Saving: No need to overlay multiple indicators; everything is integrated into one tool.
  • Versatility: Works on any timeframe and market (forex, stocks, cryptocurrencies, etc.).
  • Ease of Use: Designed for traders of all levels, from beginners to experts.

Why Download This Indicator?

  • Innovative: A unique combination of classic and modern tools that you won't find in other indicators.
  • Effective: Helps you identify trading opportunities with greater clarity and confidence.

How to Use It:

  1. Identify the Trend: Use the Hull Moving Averages to determine the market direction.
  2. Look for RSI Signals: Check if the RSI is in overbought or oversold conditions near Fibonacci levels.
  3. Confirm with Fibonacci: Use Fibonacci levels to identify key support and resistance zones.
  4. Make Informed Decisions: Enter or exit trades with greater confidence based on clear and precise signals.

Download Now and Improve Your Trading!

Don't waste more time analyzing charts manually. With this indicator, you'll have everything you need in one place. Make your trading more efficient and profitable!

And with two tools you can stop worrying about what the market is going to do, with a simple glance you will know – buy or sell and move on to another task.

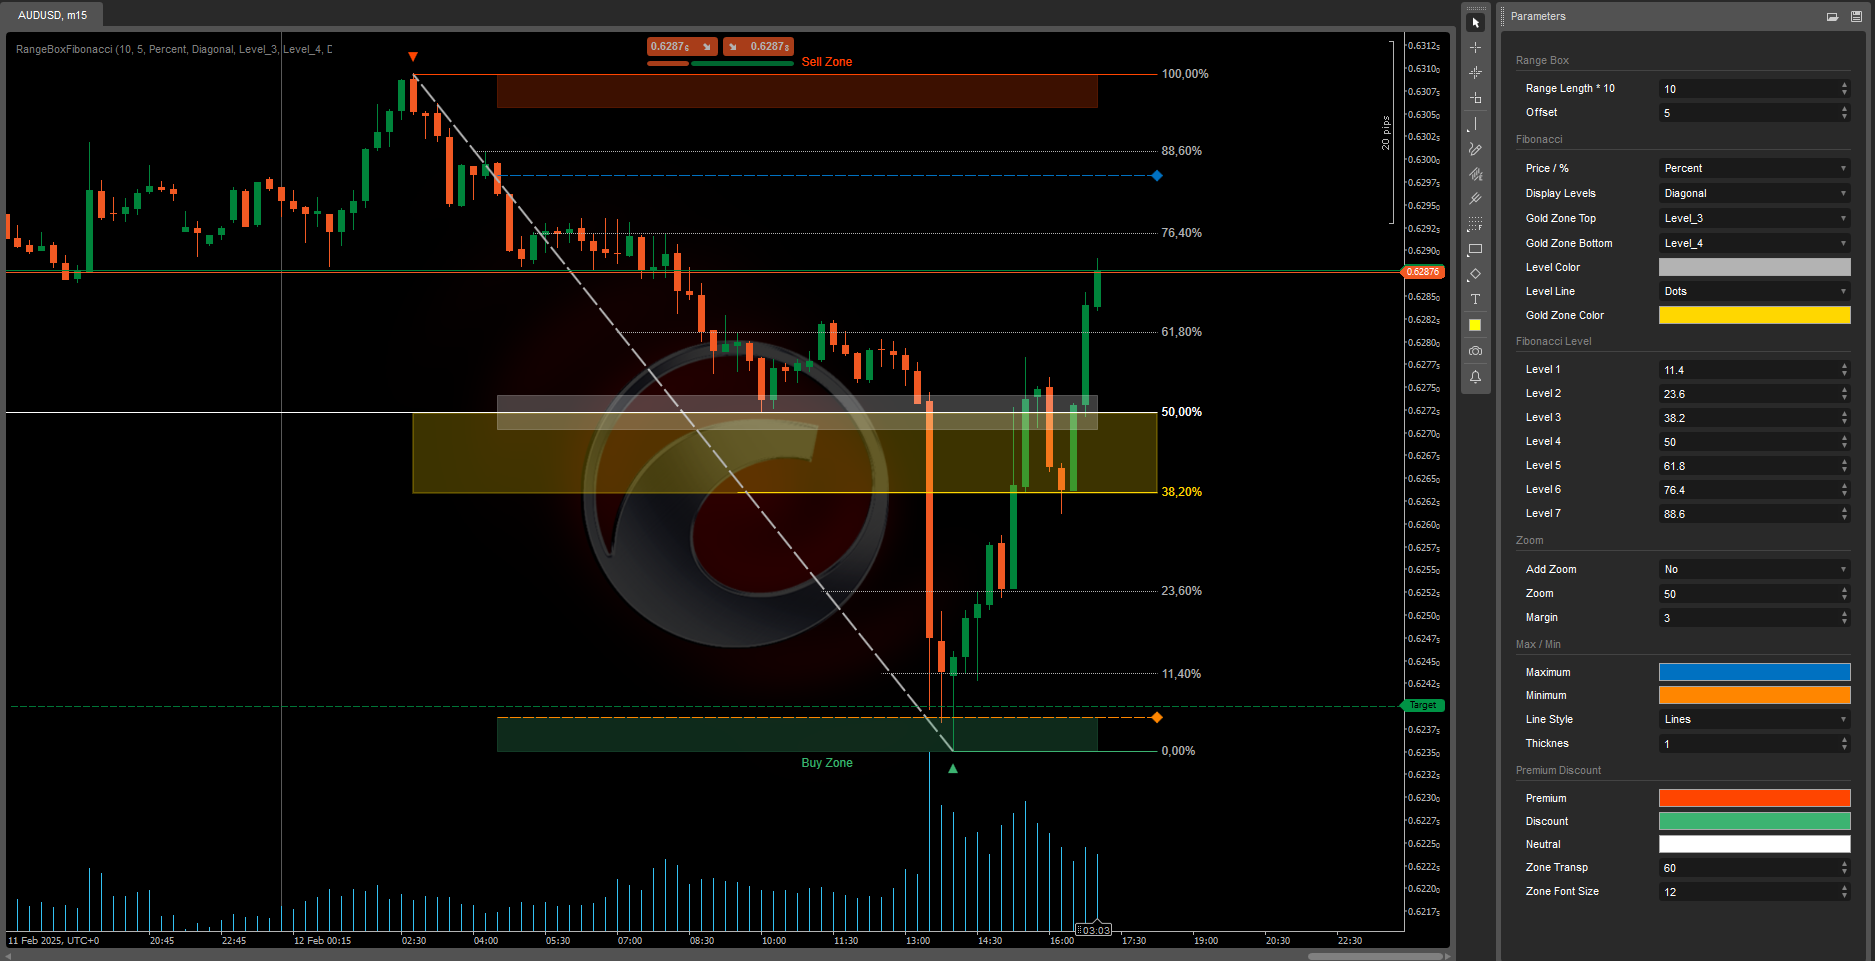
RangeBoxFibonacci: https://ctrader.com/products/526?u=VIZAINT

OrderPrice-V3: https://ctrader.com/products/397?u=VIZAINT


And for choosing

NTMPICLL https://ctrader.com/products/327?u=VIZAINT

MacdVolume https://ctrader.com/products/267?u=VIZAINT

MarketSession-MX: https://ctrader.com/products/525?u=VIZAINT

More from this author
Indicator
Indices
Prop
Commodities
+3
4MA
This indicator consists of 3 moving averages that can be configured to your liking, from the type of moving average....
Indicator
NAS100
NZDUSD
XAUUSD
+10
MarketSession-MX
😎Read the description before purchasing💩
VWAP-Free
VWAP only timeframe
Indicator
Grid
NAS100
NZDUSD
+15
RangeBoxLevel
This technical analysis indicator provides information on market sentiment, trend and price levels....
cBot
Commodities
MACD
SparrowBot-FreeTrial-V2
This bot can automatically generate buy and sell orders based on three specific Fixed bugs
Indicator
Stocks
Forex
MACD
MACDVolume
😎Read the description before purchasing💩
Indicator
NAS100
NZDUSD
XAUUSD
+11
SessionOne
Session One is a tool for marking from to, useful if you've set the hours you want to trade
Indicator
Grid
NAS100
NZDUSD
+15
RangeBoxFibonacci
With this Fibonacci retracement indicator, traders have full control over the retracement levels displayed on the chart.
Indicator
Grid
NAS100
NZDUSD
+16
AllPattern
🔍 Discover All Candlestick Patterns… Absolutely Free!
Indicator
Grid
Indices
Prop
+8
TSPivotSMC
Pivot Point MultiTimeFrame with Order Block
Indicator
Indices
Prop
Stocks
+5
New Way Sar - Free
The Parabolic SAR, or "Stop and Reverse," is a dynamic technical analysis tool
Indicator
Indices
RSI
Commodities
+1
OrderPrice-V3
A straightforward yet effective tool signals entry points for both buying and selling. Include 3 Moving Average
Indicator
Grid
NAS100
NZDUSD
+15
TS_Pivot
Those who are involved in trading know how important it is to take into account the previous session. With Order Block
Indicator
NAS100
RSI
NZDUSD
+18
HAIQuantum-V10
The HAI Quantum V10 is an advanced indicator designed for technical analysis
Indicator
Indices
Prop
Breakout
+7
NTNPICLL
NTNPICLL is a tool to check the best trading hours for the assets and also includes the highest and lowest point
Indicator
Indices
Prop
Stocks
+4
Pivot Point Smart Money Concept
Transform your approach to trading with our innovative Pivot Point Indicator.
Indicator
Indices
Prop
Stocks
+6
New Way Sar - Pro
The Parabolic SAR, or "Stop and Reverse," is a dynamic technical analysis tool
Plugin
Breakout
Signal
RiskRewardCalculator
The Risk-Reward plugin is a tool to visualize a trading idea based on other analysis tools,
You may also like
Side Volume Profile
Right-anchored cTrader Volume Profile with VAH/VAL/POC, LVZ, top volume+EMA, themes, and fast, readable visuals.
SupertrendHTF
Overlay higher-timeframe SuperTrend to filter noise, follow real trends, and avoid lower-timeframe whipsaws. As
Indicator
Grid
NAS100
RSI
+16
Smart Money Breakout Channels
Smart Money Breakout Channels – Auto-detect breakout zones with price, volume & volatility insights on cTrader.
Indicator
Breakout
PDHL
PDHL - Previous Day High&Low
Indicator
Breakout
Pivot Points Daily Session
Pivot Point with base zone daily Asia-London-New york Session.
Indicator
RSI
Breakout
XAUUSD
+6
Volume POC Heatmap
📊 Shows volume by price levels, highlights POC, and key zones. Identifies dynamic support/resistance and imbalances.
IR Spread
show spread on chart
MTF Candle Countdown
Stay ahead with a real-time countdown to candle closes on all key timeframes: 5m, 15m, 30m, 1H, 4H, and Daily.
MultiTimeFrame Moving Averages
3 moving averages with different periods and different time frames.
Indicator
Indices
Prop
Commodities
+3
4MA
This indicator consists of 3 moving averages that can be configured to your liking, from the type of moving average....
Vishal Volume Profile v2.0
Volume Profile plots traded volume at each price level, highlighting high activity zones of precise support & resistance
Indicator
RSI
XAUUSD
Breakout
+5
Prime Trend Targets
PrimeTrend: ATR trendline detects reversals, plots entry/SL/3 targets. Tune params (speed vs. robustness). Backtest +
Indicator
RSI
Breakout
Supertrend
Zig-Zag Extremity Tracker
Dynamically adjusts regression channels based on ZigZag extremes, resetting when price breaks bands to track real trends
TraderMaxBBflterXDemo-
TraderMax BB Filter X (DEMO) for cTrader 🧪 Limited-Time Demo Version (24h) TraderMax BB Filter X (DEMO) is a precision
Indicator
VWAP
Breakout
Scalping
VWAP & Sessions & D,W,M HLO Levels
Killzone Session With VWAP – Precision Meets Price Action
Indicator
Breakout
Forex
On Balance Volume
On Balance Volume (OBV) measures buying and selling pressure as a cumulative indicator.
Market Sessions Advanced
Advanced Market Sessions with ICT killzones
Indicator
ZigZag
VWAP
RSI
+6
RSI T3 Overbought and oversold areas
Three parameter RSI