Indicator
RSI
Indices
ATR
AlgoCorner Crosshair Edge
"AlgoCorner Crosshair Edge" logo
03/09/2025
Desktop
Since 08/08/2024
Sales
2
Free installs
68
"AlgoCorner Crosshair Edge" uploaded image

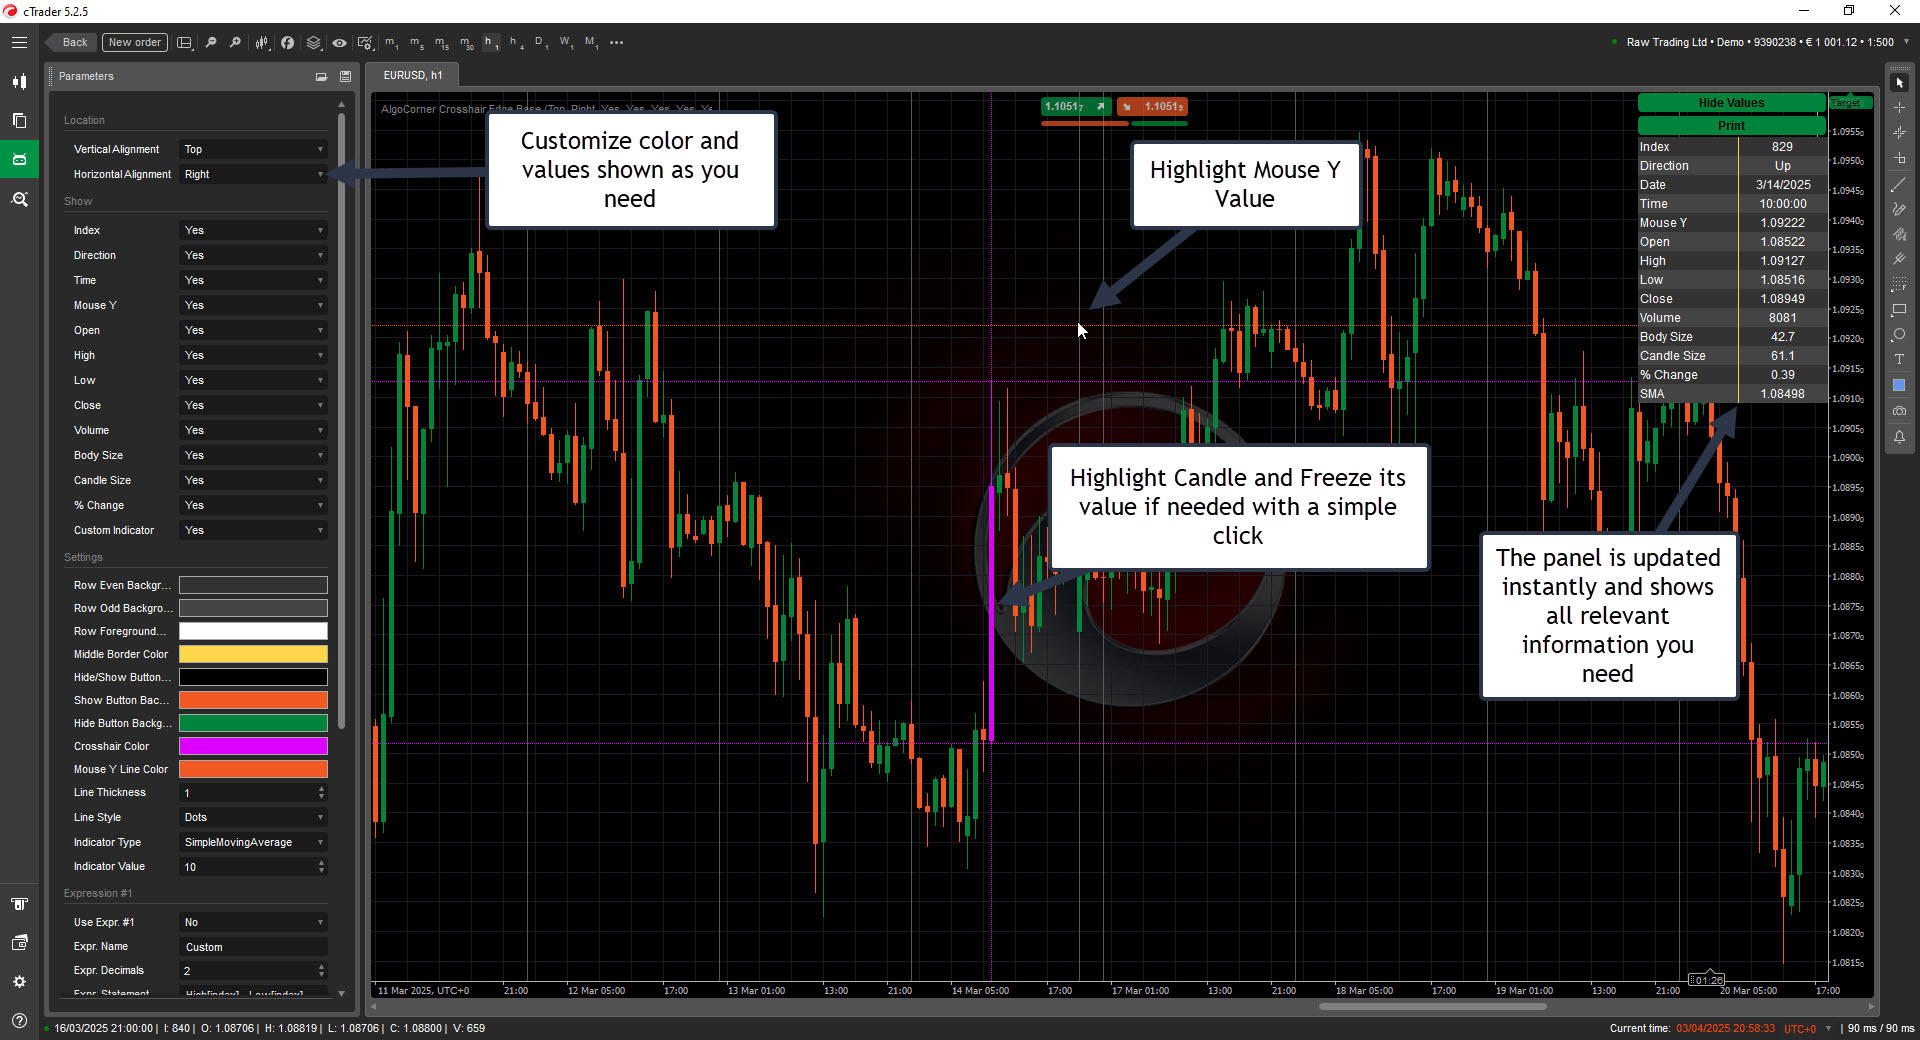
Crosshair Edge: The best cTrader Data Visualization Tool

With Crosshair Edge, a robust tool that improves the visualization of market data inside the cTrader platform, you can elevate your chart analysis to new heights.

Enhanced Chart Interaction

  • Highlight the current bar and its range
  • Freeze the crosshair on a specific candle with a click, and unlock again with a click when needed
  • Send values to your log so it can be easily copied
  • Show or hide the layout as needed


Full Customization

  • Personalize the colors to your style
  • Adjust the crosshair to any location you need inside the chart
  • Select which values are on display and which values should be omitted

Instant Candle Data Display

Simply hover on any candle to check all its details and more

  • Index
  • Direction
  • Date
  • Time
  • Mouse Y Price
  • Open
  • High
  • Low
  • Close
  • Volume
  • Body Size
  • Candle Size
  • % Change
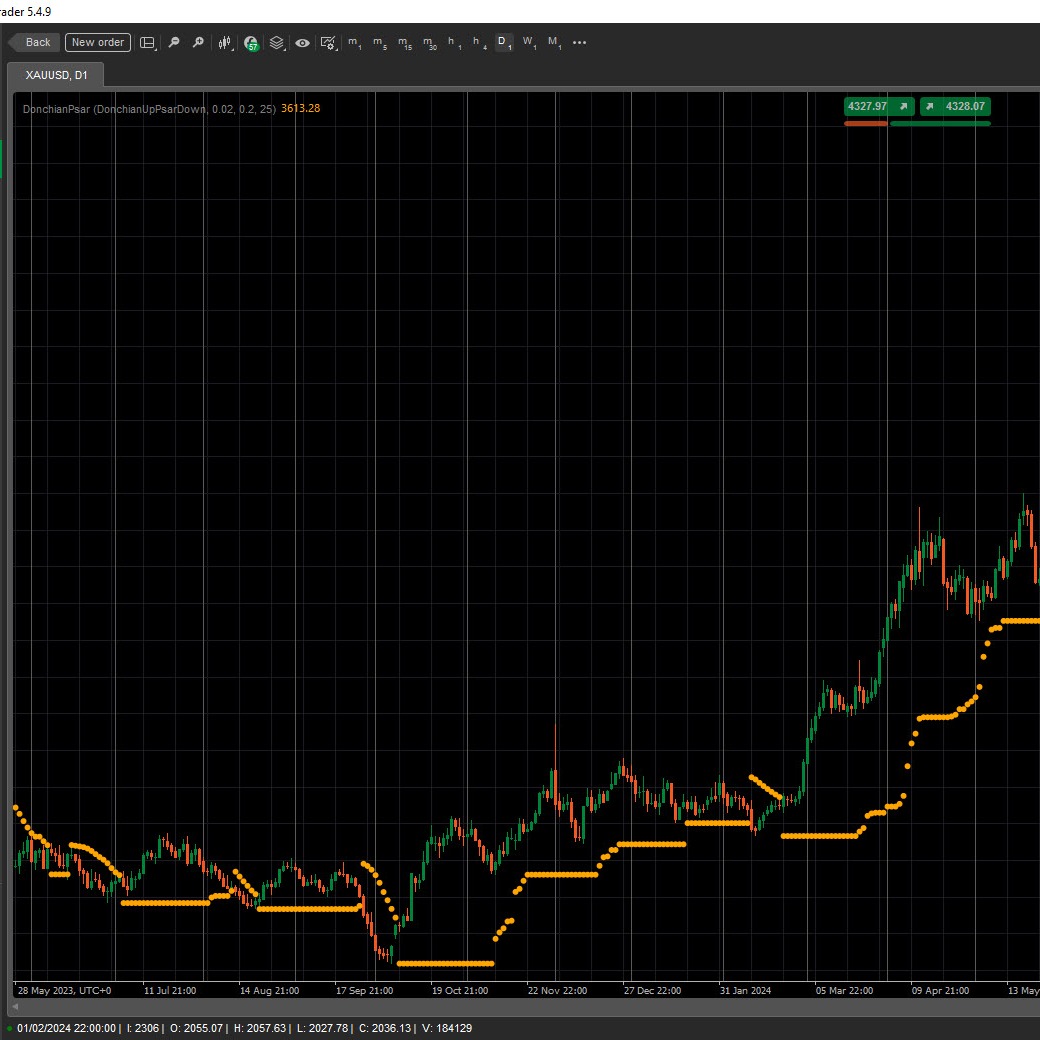
  • Multiple indicator values
    • ADX
    • ATR
    • Chaikin Money Flow
    • EMA, HMA, SMA, TSMA, TMA, WMA
    • On Balance Volume
    • RSI
    • STD
    • Weighted Close
    • Welles Wilder Smoothing
    • Williams %R
  • Draw Horizontal/Vertical Lines with easy hotkeys
    • Draw Horizontal Line: Ctrl + 1
    • Draw Vertical Line: Ctrl + 2
    • Hotkeys fully customizable
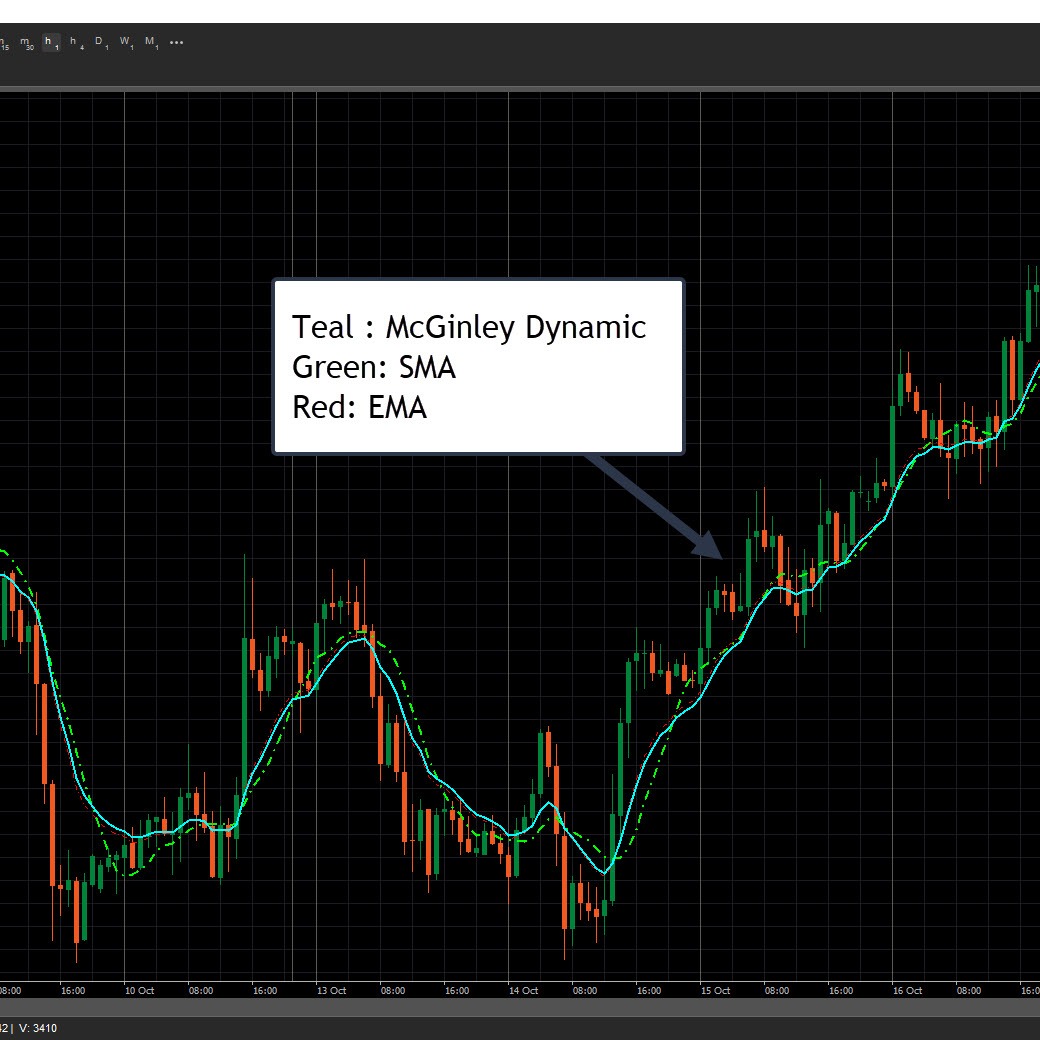
  • Customizable Formulas
    • Use Open, High, Low, Close, and Index to compute formulas that suite your needs
    • Example, Typical Price: (High[index] + Low[index] + Close[index])/3.0

Seamless Integration

  • License linked to your cTrader ID for ease of use
  • Future updates included

Upgrade your trading experience with Crosshair Edge today! 🚀

0.0
Reviews: 0
Customer reviews
No reviews for this product yet. Already tried it? Be the first to tell others!
More from this author
Indicator
NAS100
Indices
XAUUSD
+2
AlgoCorner DonchianPSAR
Visualize market asymmetry like never before — steady climbs meet sudden drops with the Donchian PSAR
cBot
Grid
NAS100
NZDUSD
+8
AlgoCorner Gradient Orders
This tool will help you spread your trades very quickly with a few clicks
Indicator
Forex
EURUSD
GBPUSD
AlgoCorner McGinley Dynamic
Designed to follow price more naturally, adjusting automatically to market speed, to reduce lag and false signals.
Indicator
Supertrend
Signal
SuperTrend Scanner
Supertrend Scanner – Track trends across assets & timeframes in real-time with alerts. Stay ahead, and trade smarter!
AlgoCorner Trading Dashboard MP
Custom trading dashboard for fast one-click orders. Set Stop Loss, Take Profit, and customize layout & symbols easily.
Indicator
NZDUSD
Forex
EURUSD
+2
AlgoCorner Market Sessions
Show each Market Session with full details, including grid mode for higher timeframes, statistics, and other metrics.
You may also like
Indicator
RSI
XAUUSD
Breakout
+4
ZScore Reversion
Z-Score: Measures price deviations from its mean. Spots overbought/sold (±2-3 SD) & reversals. Key for stats trading
Time To Break Even Indicator v2
Time To Break Even Indicator. This indicator helps you time your trade's entry.
Cumulative Delta_noSourceCode
Demo of my main indcator.
Alpha Sentiment Pro
Alpha Sentiment Pro - See the Market's Pulse Before It Moves
Momentum Trend Analyzer
Provides comprehensive trend and momentum analysis by combining EMAs, RoC, normalized ATR, RSI, and volume..
Indicator
Indices
Breakout
Commodities
+3
Trend Lines Auto - FXMaster
Auto Trend Line Indicator for cTrader
Flex VWAP
Flexible VWAP indicator with timezone-aware, custom time periods and automatic DST handling.
Indicator
NAS100
NZDUSD
Martingale
+22
Indicators Volume Profile 1
Taiz Pro Volume Profile مؤشر احترافي لتحليل الحجم (Volume Profile) يكشف عن مناطق الدعم والمقاومة الحقيقية التي يركز عليه
Indicator
RSI
Indices
StochasticRSI
Stochastic RSI (StochRSI) is a technical indicator used to measure the strength and weakness of the RSI.
Indicator
Indices
Prop
Stocks
+6
New Way Sar - Pro
The Parabolic SAR, or "Stop and Reverse," is a dynamic technical analysis tool
HeatMap Candle
HeatMap Candle
Indicator
Indices
ATR
Stocks
+4
UT Bot Alert
A powerful ATR-based indicator generating clear BUY/SELL signals. Features real-time alerts and customizable sensitivity
Indicator
NAS100
RSI
NZDUSD
+15
Inside Candle
Highlight market consolidation zones instantly with this Inside Candle indicator — precise, clean, and powerful.
Indicator
Breakout
ATR
LT_SmartSwings
Detects swing highs/lows, structure, breakouts, trend lines, and fibs — great for price action trading.
Market Entropy
Market entropy + DC. Spot crystallization/chaos shifts with an optional on-chart overlay.
Indicator
Indices
FVG
Stocks
+4
FAIR VALUE GAP INDICATOR
Pinpoint FVGs, track fills and see mitigation stats — trade imbalances with clarity and confidence.
Time To Break Even Lite Version
This is the trial version of Time To Break Even, which help you time your trade entry.