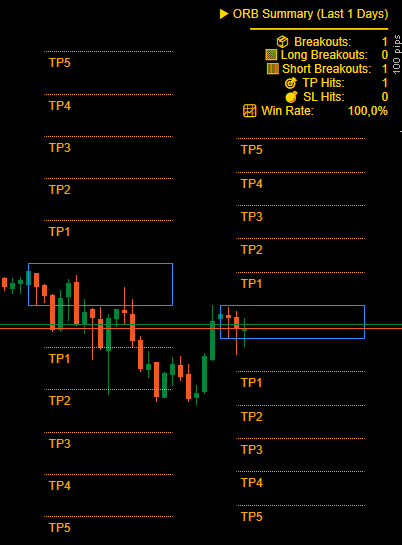
Pinescriptlabs Store indicators: Pinescriptlabs Store cBots : (cBot) Gold & BTC BreakoutSession Pivots(new)
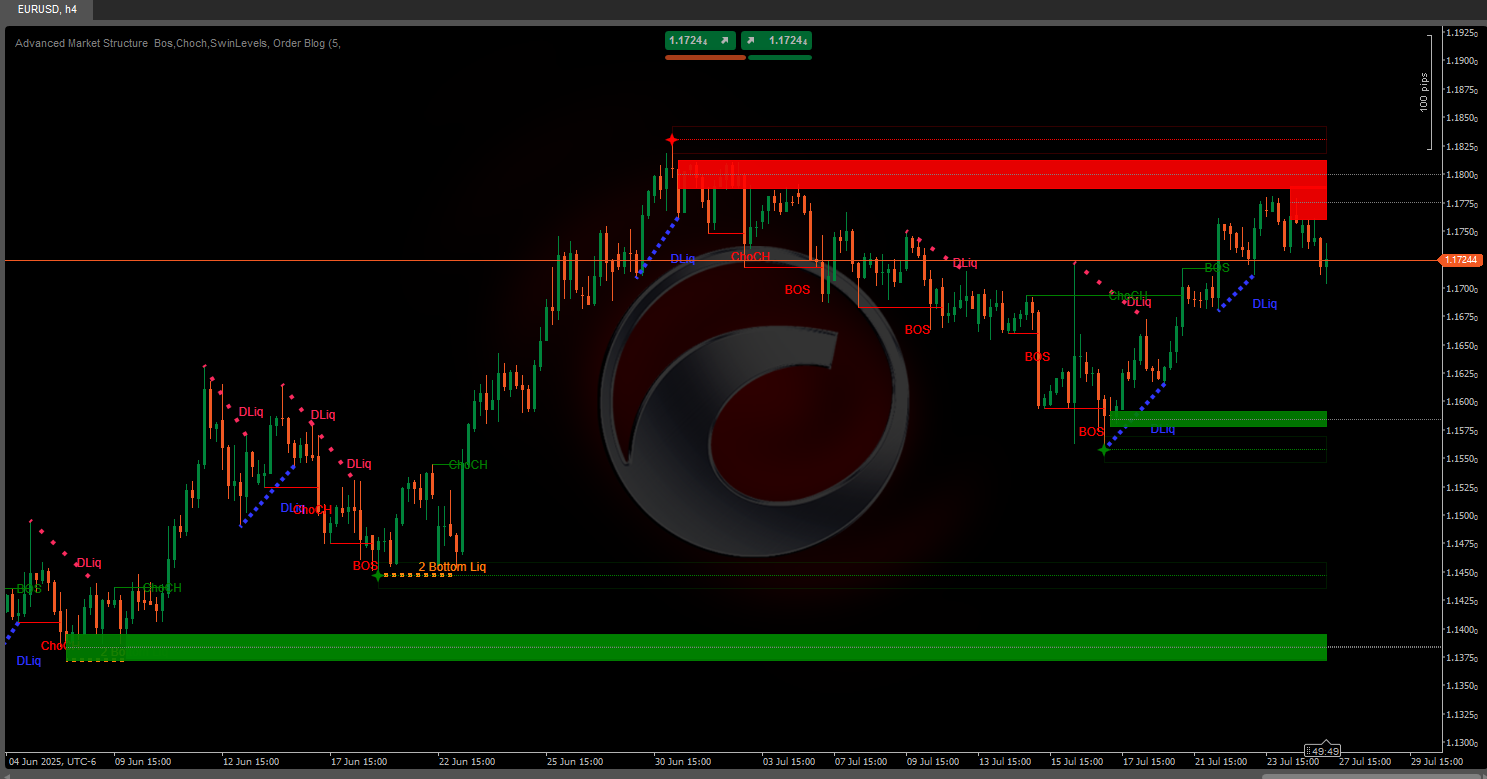
Advanced Market Structure: Bos, Choch, SwinLevels, Order Blocks, Market Structure & Liquidity Finder (New)
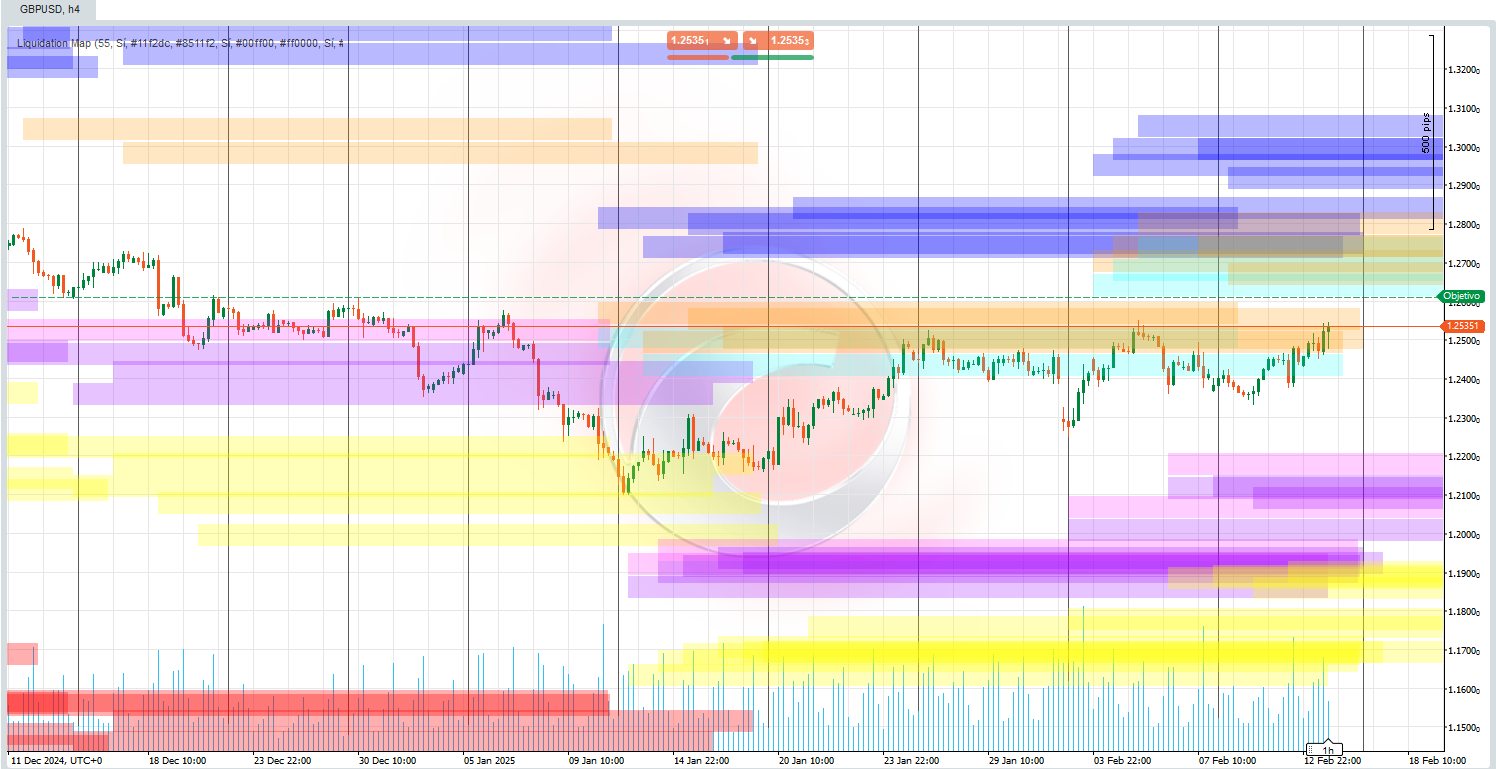
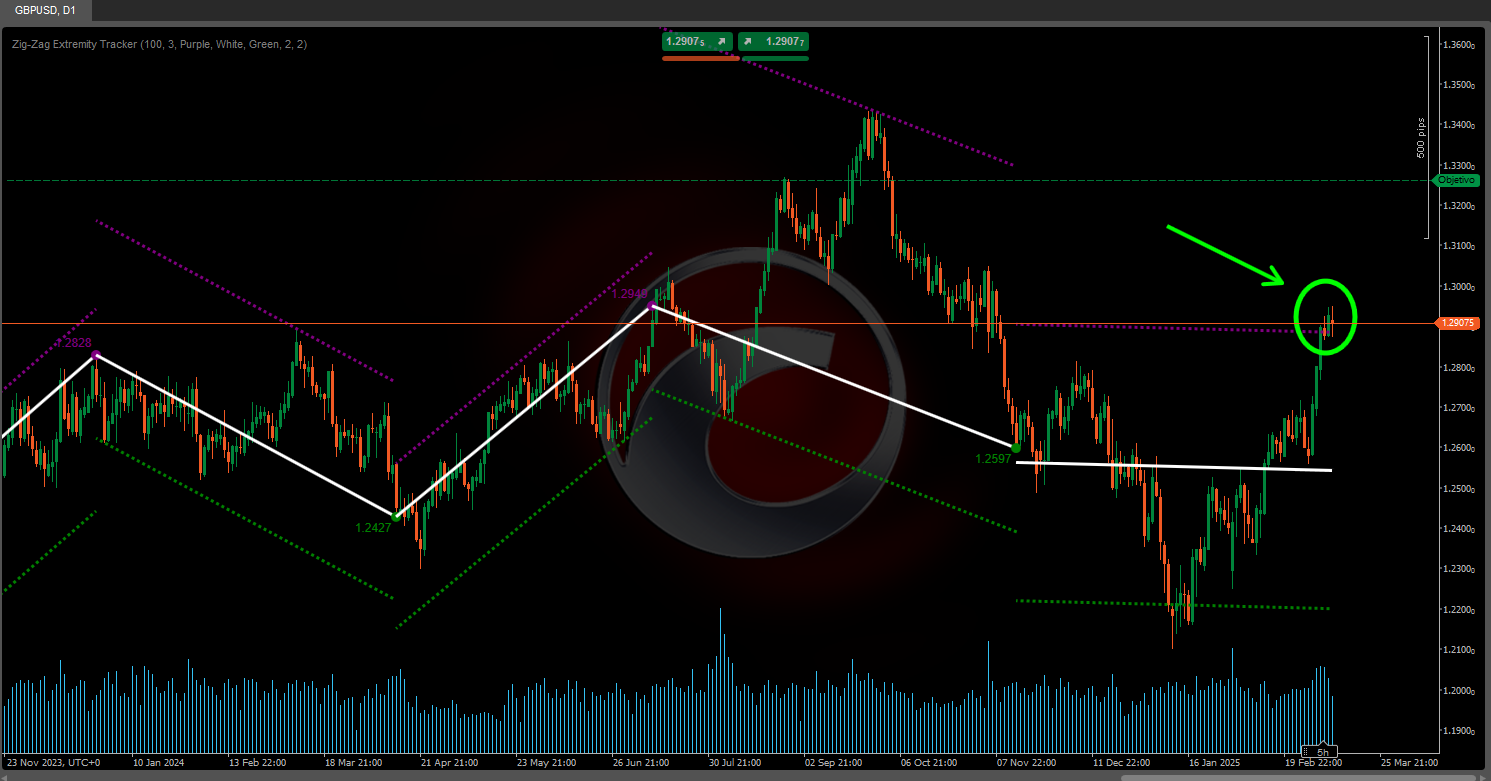
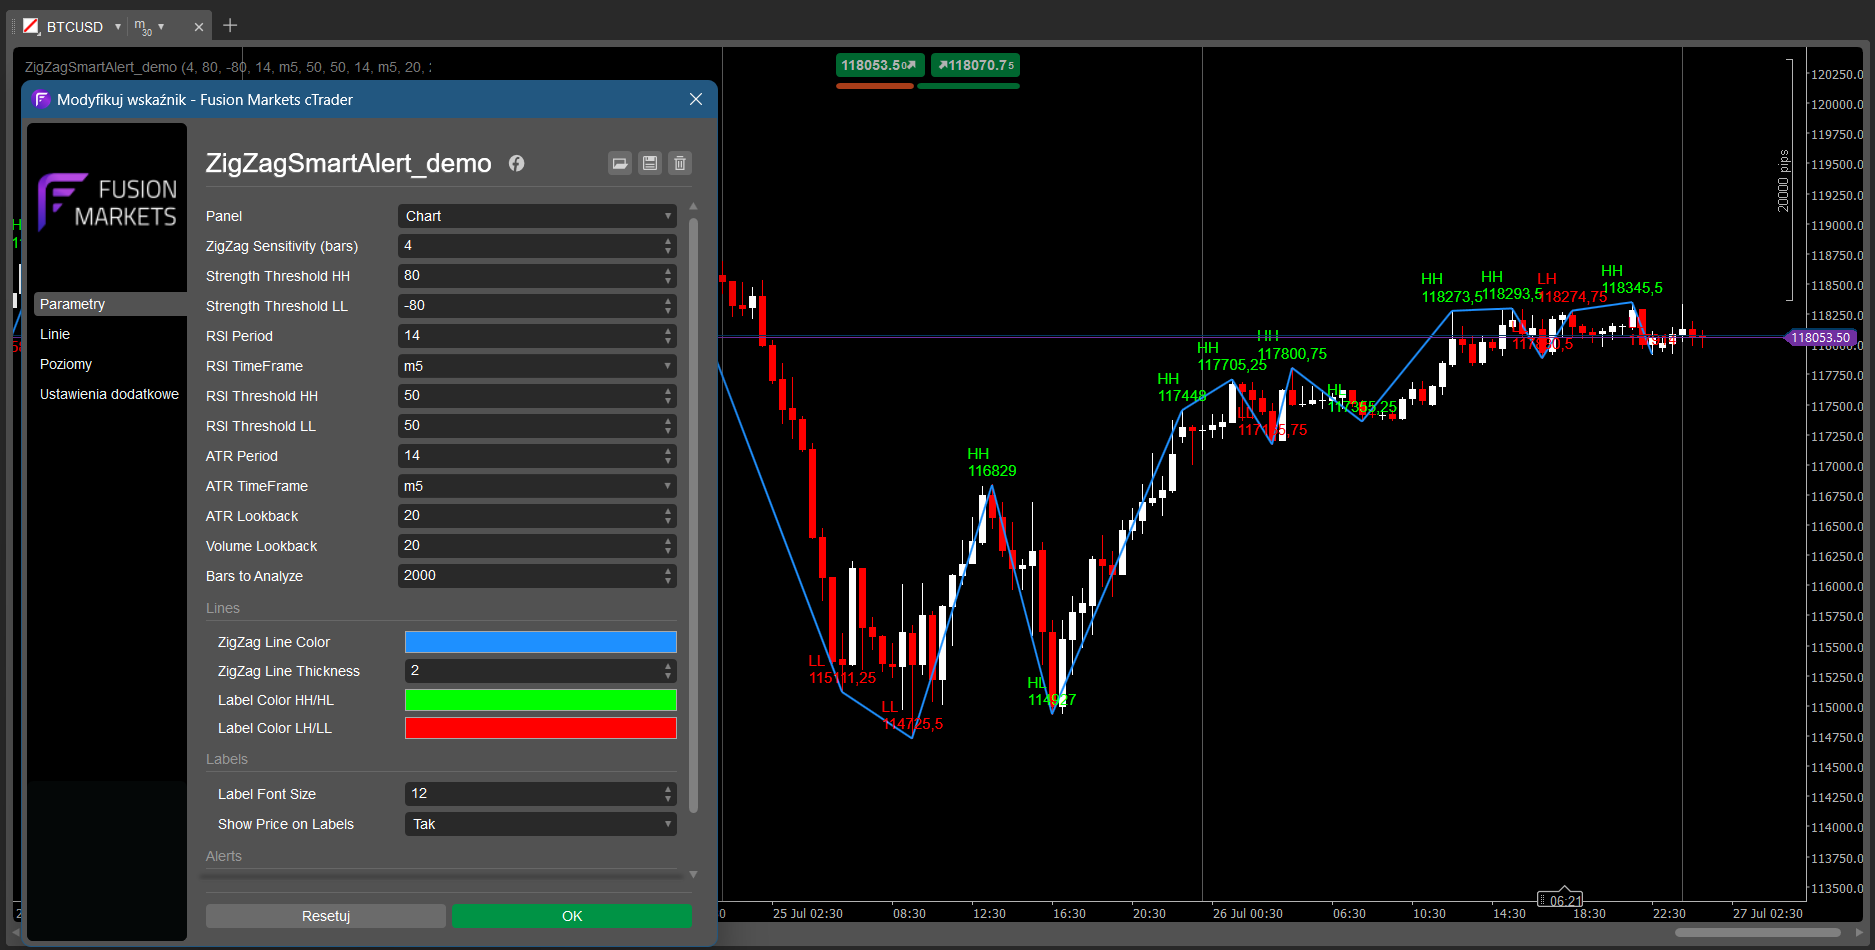
ZigZag Price Liquidity Projection
Trailing Smart Algorithm (new)
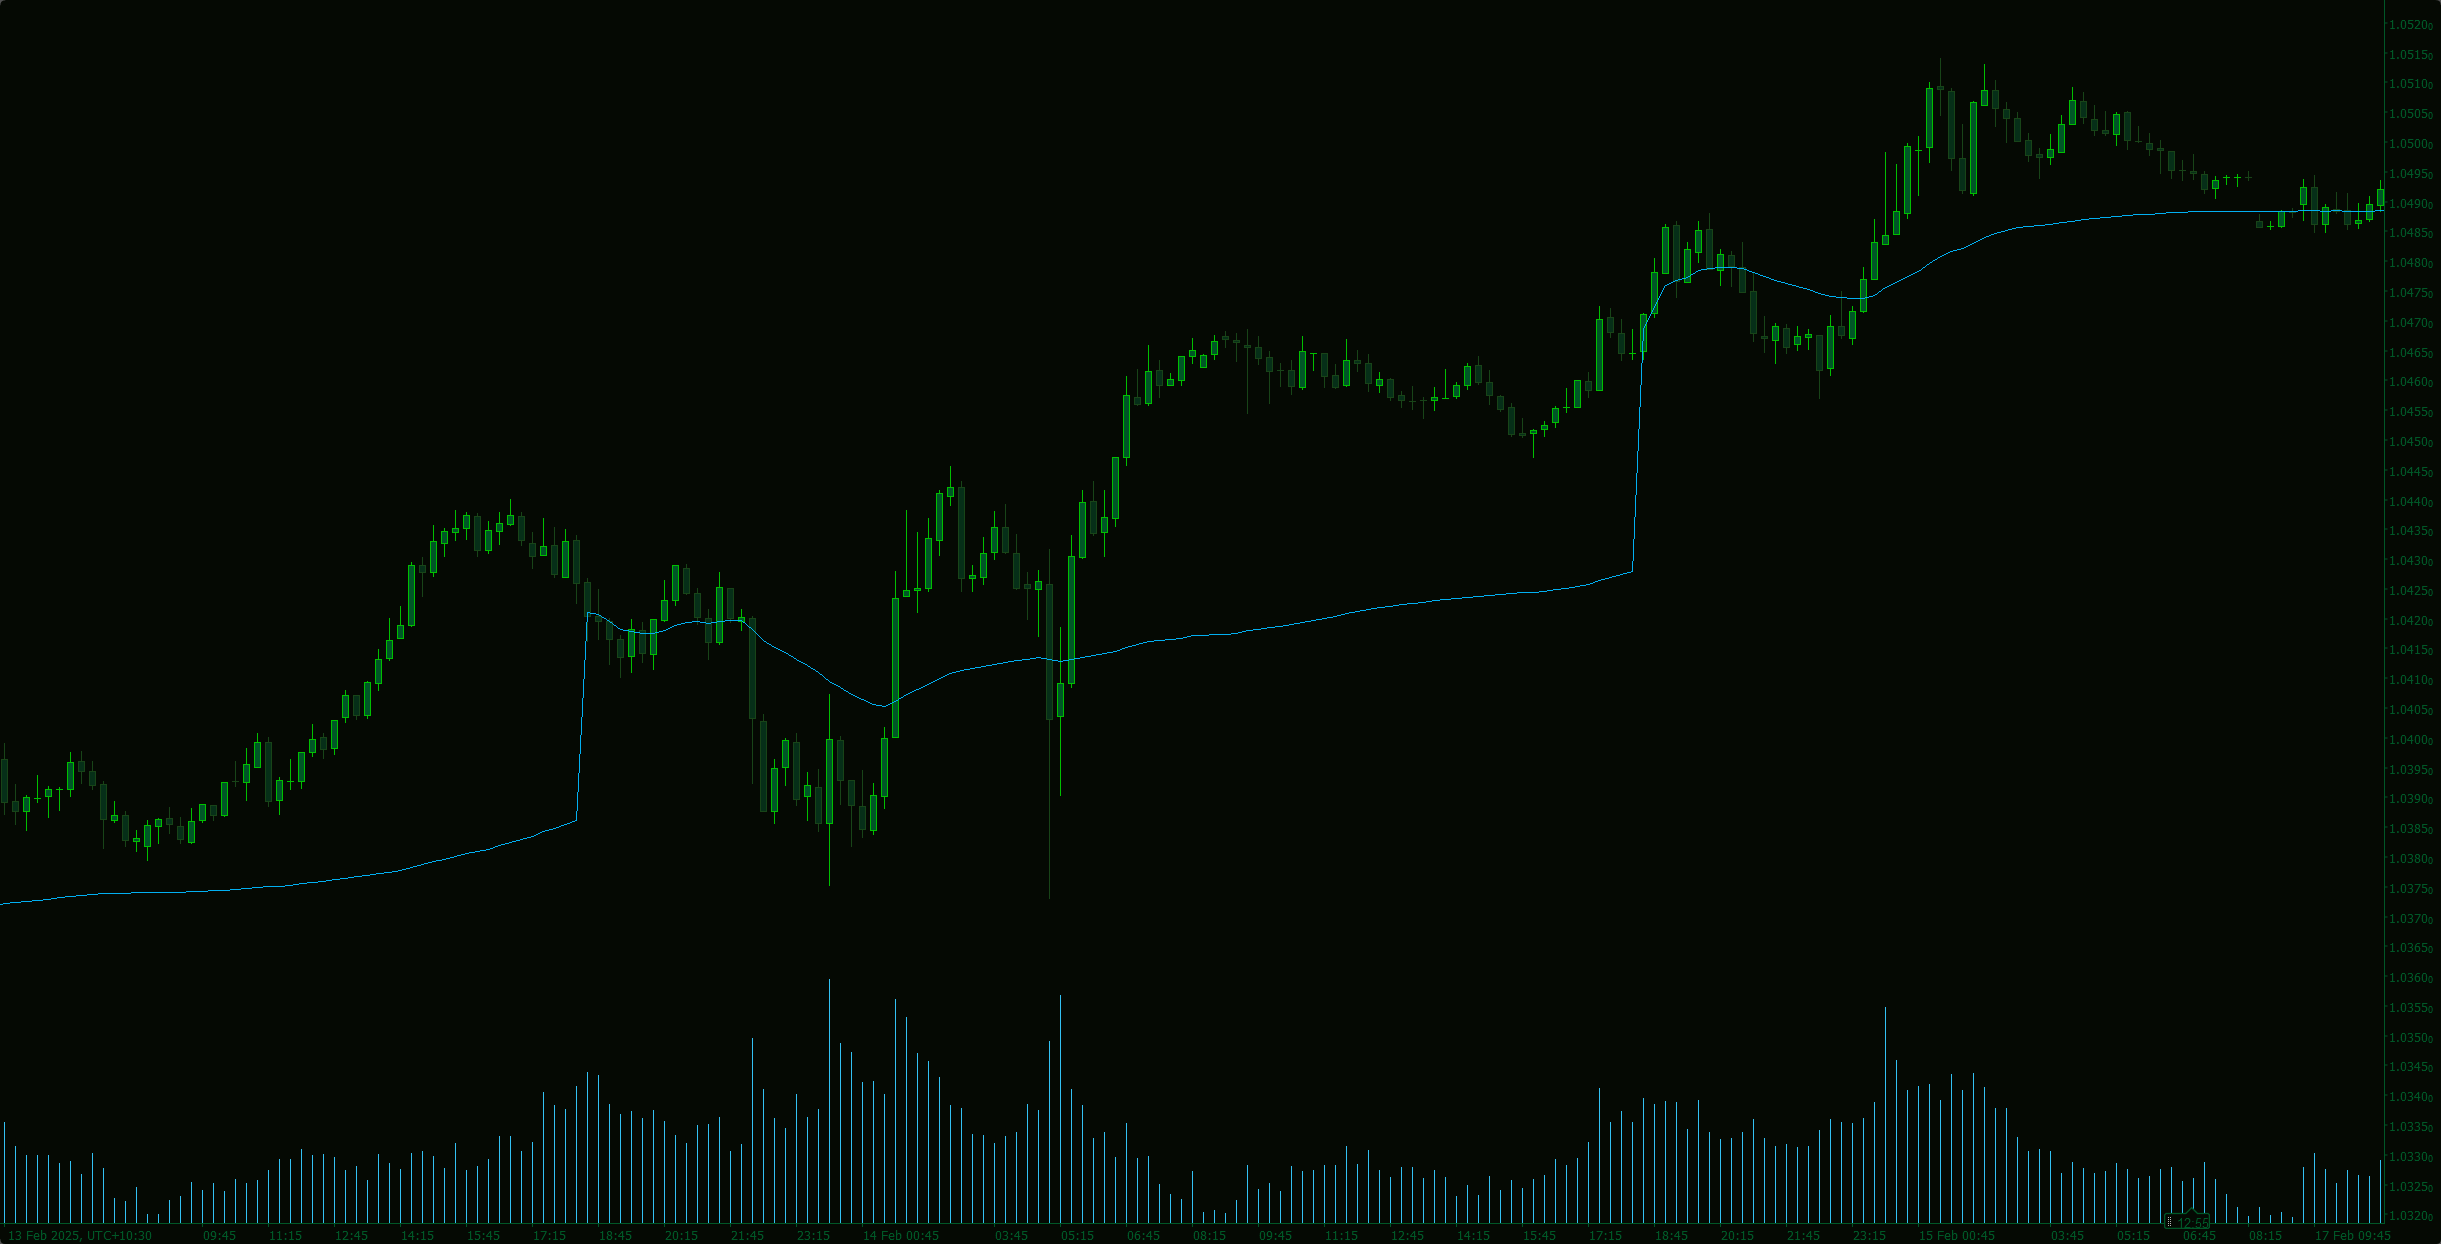
Prediction Based on Linreg & ATR
SmartTrend Support &
Resistance
Lines
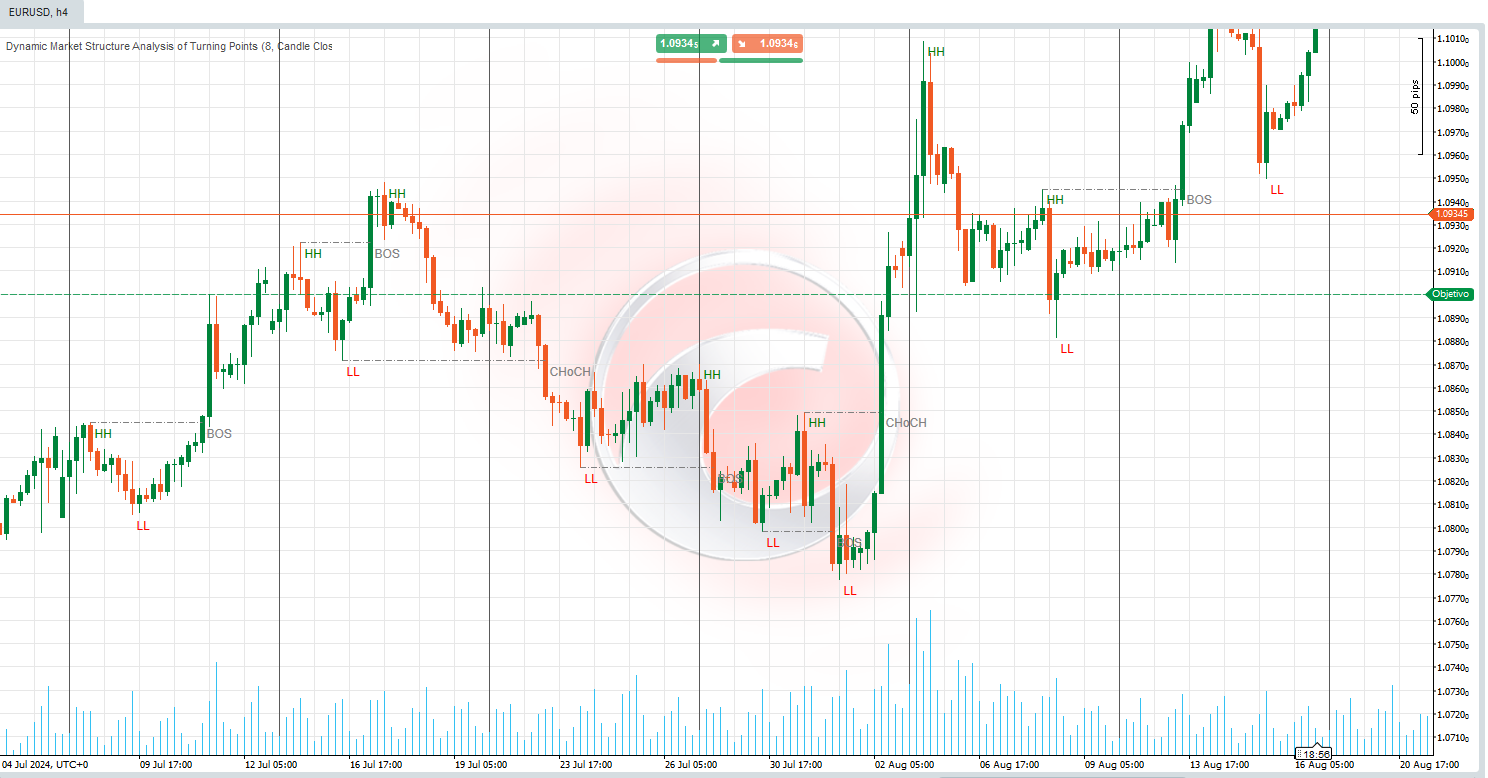
Dynamic
Market Structure
Analysis
of
Turning
Points
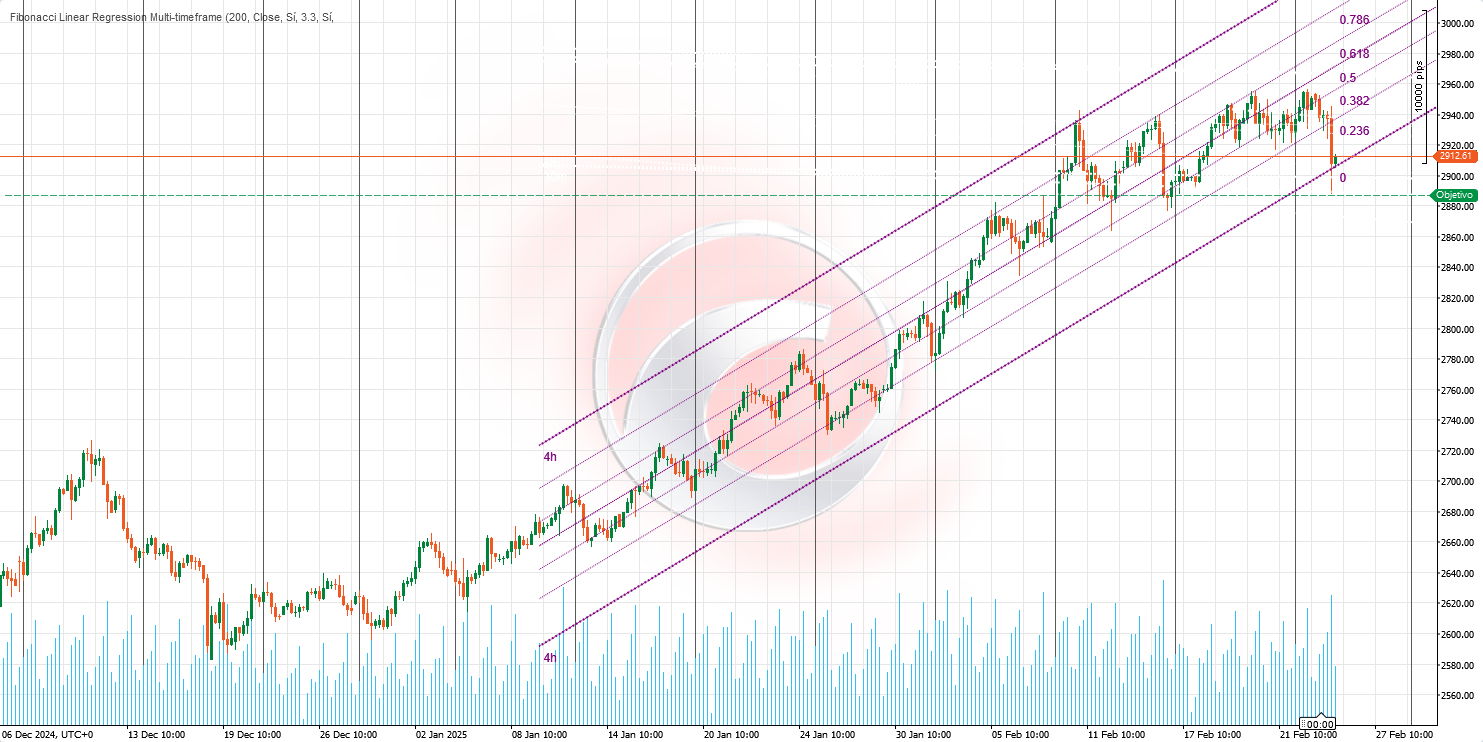
Fibonacci
Linear
Regression
Multi-timeframe
Auto
Support and
Resistance
Trend
Lines
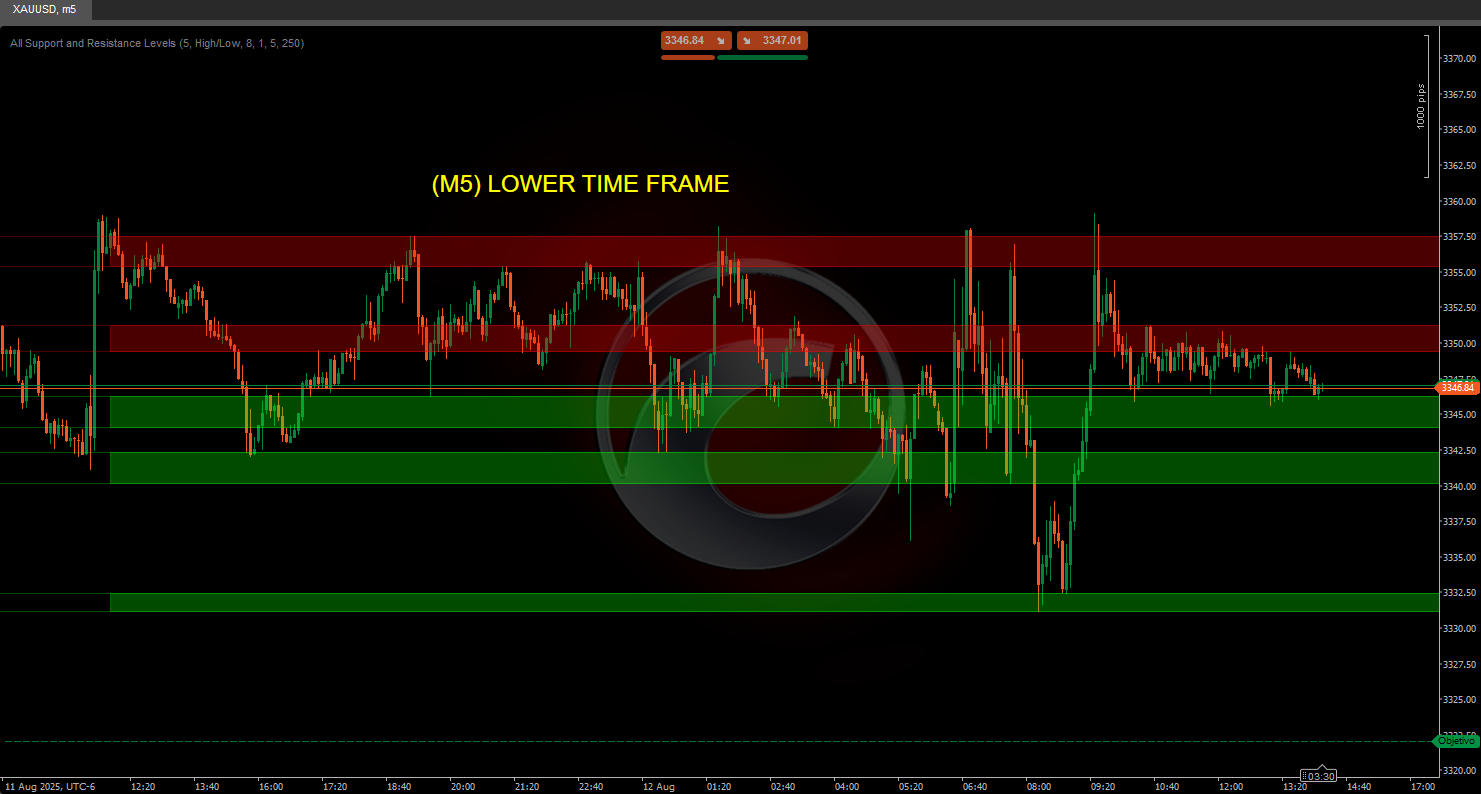
All
Support and
Resistance
Levels
🌟 Great effort from the team to develop this Ctrader indicator! Support us by sharing - visual improvements including horizontal scroll coming soon!
⚠️ Technical Note: Manual zoom/scroll currently required for optimal viewing ("Temporary limitation: Works best on timeframes below 1H due to Ctrader platform visual constraints")
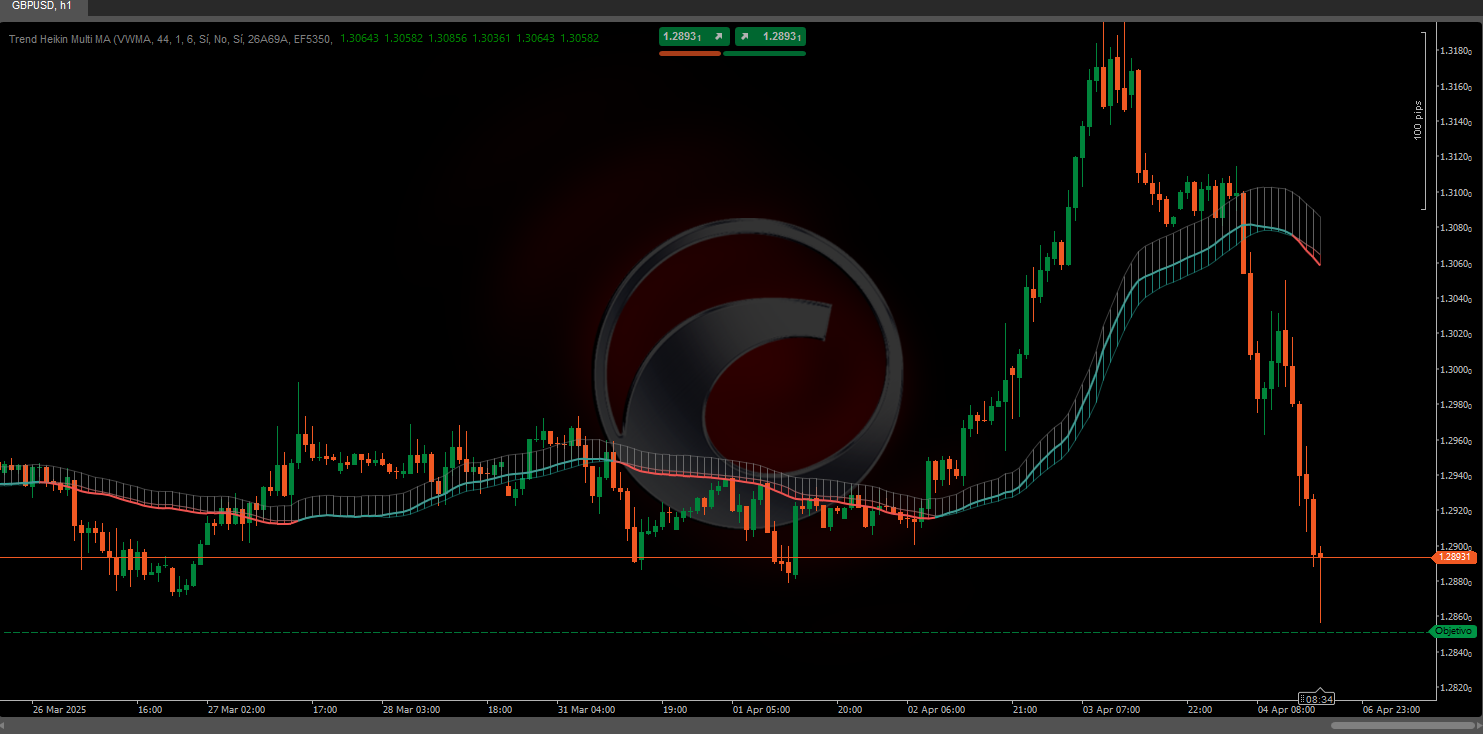
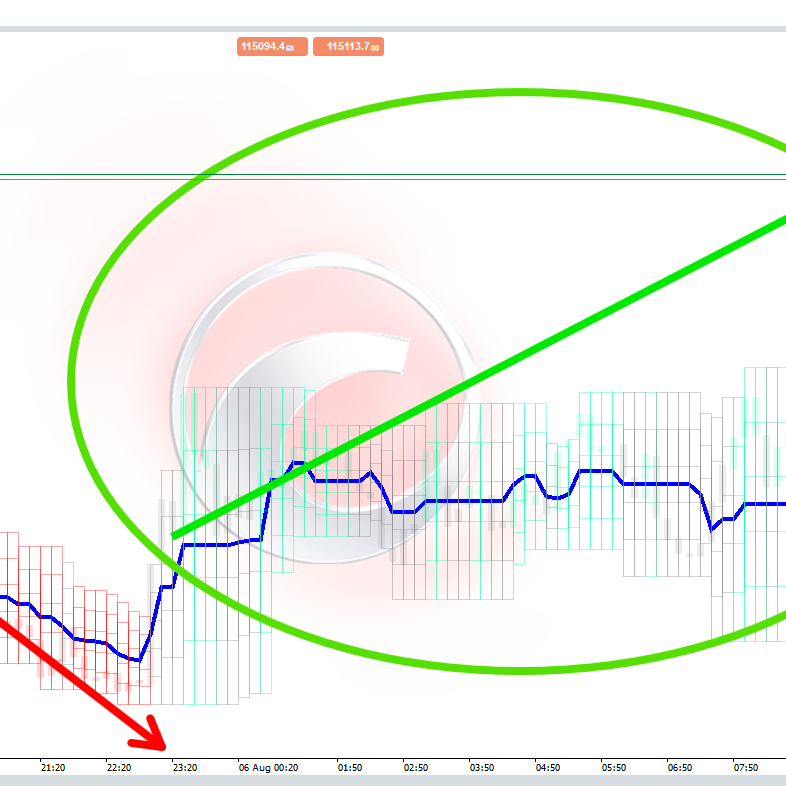
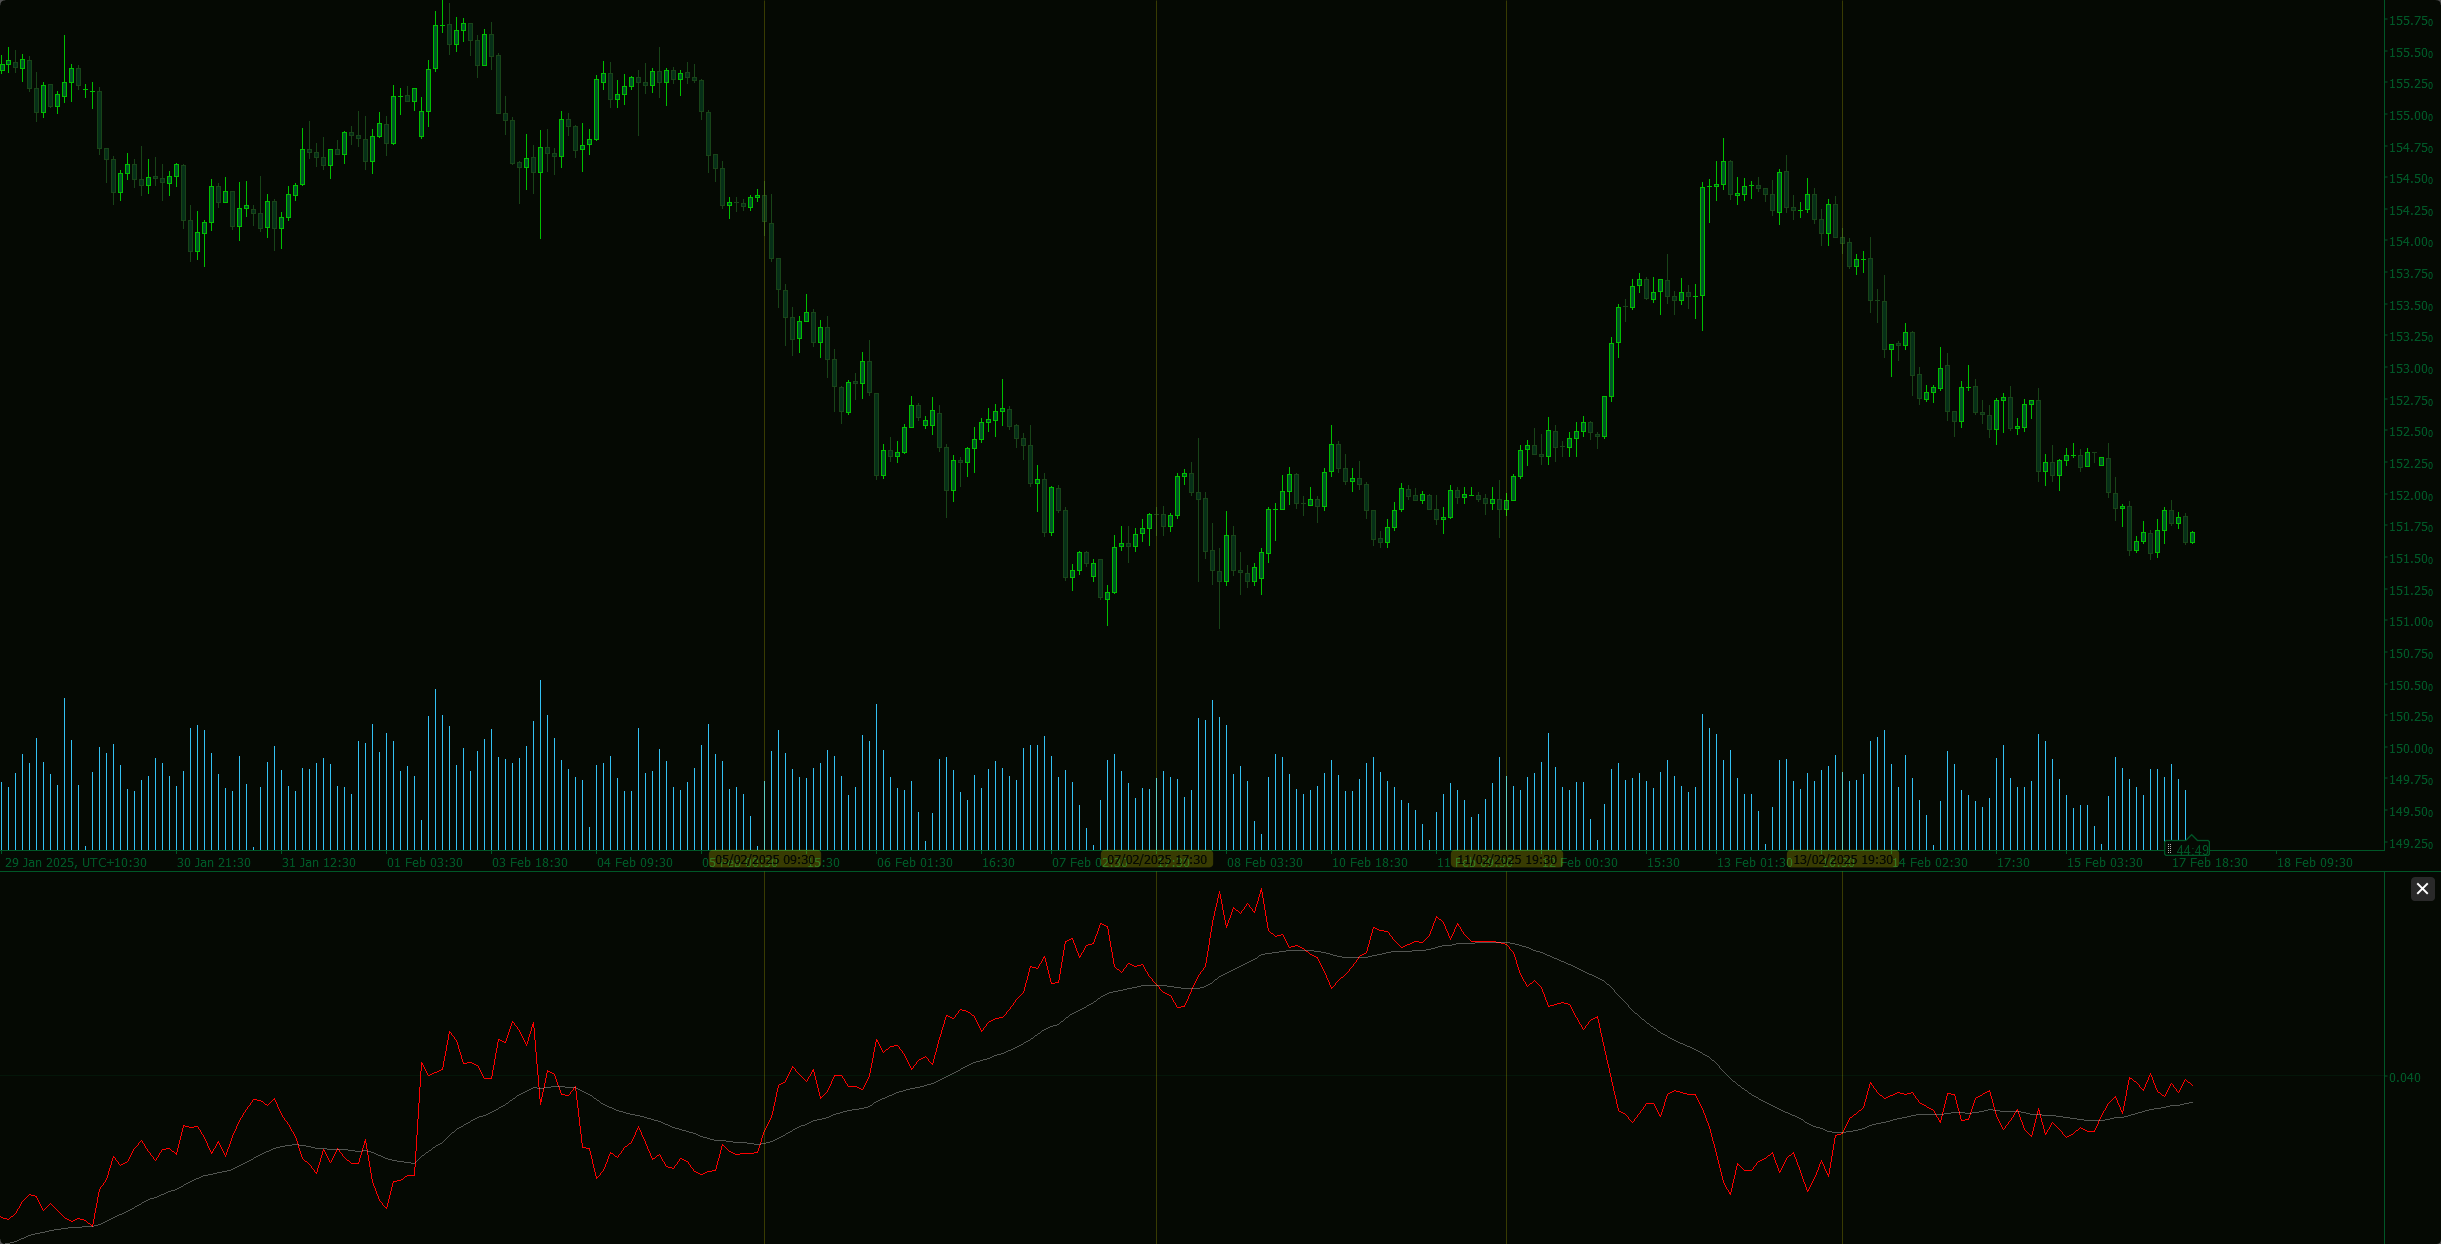
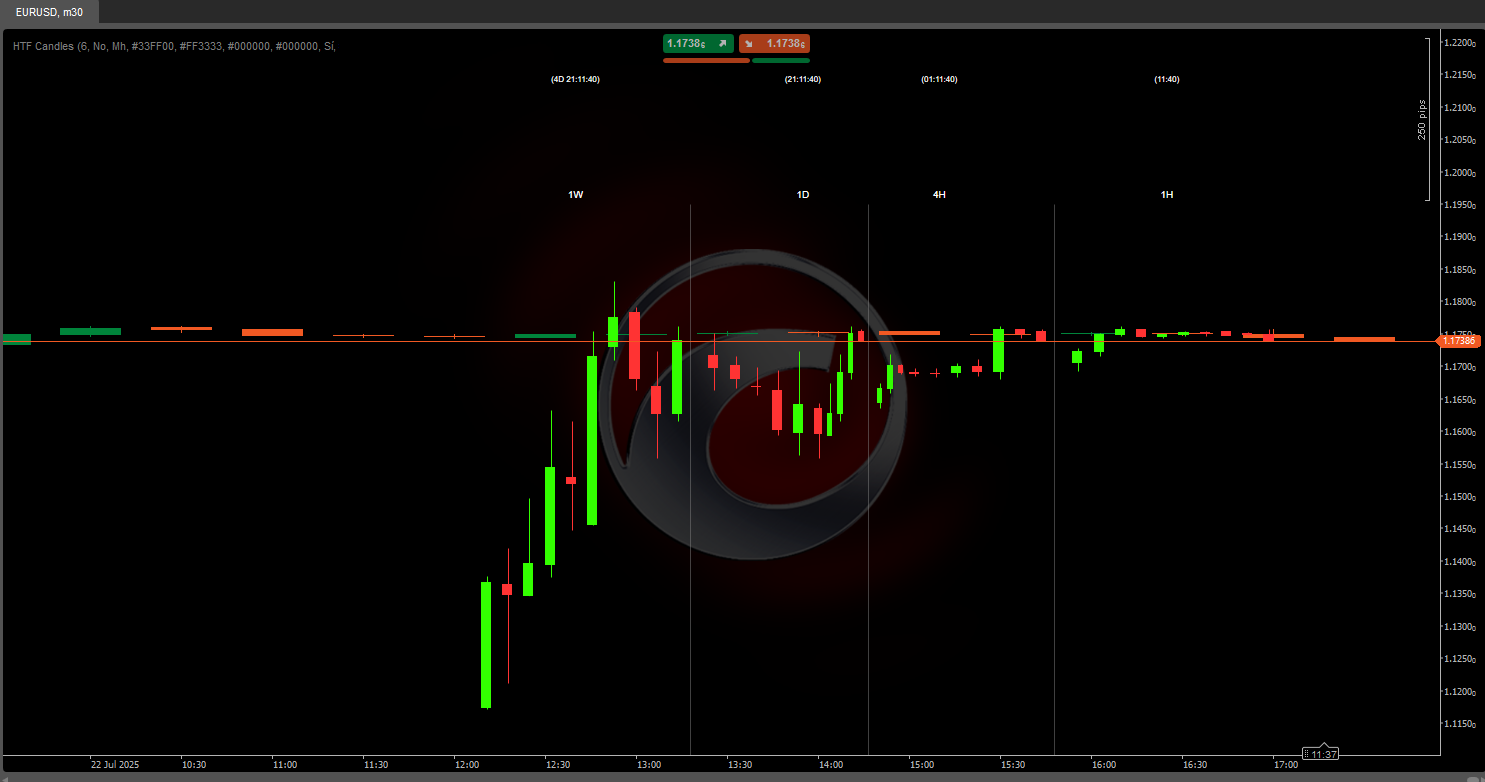
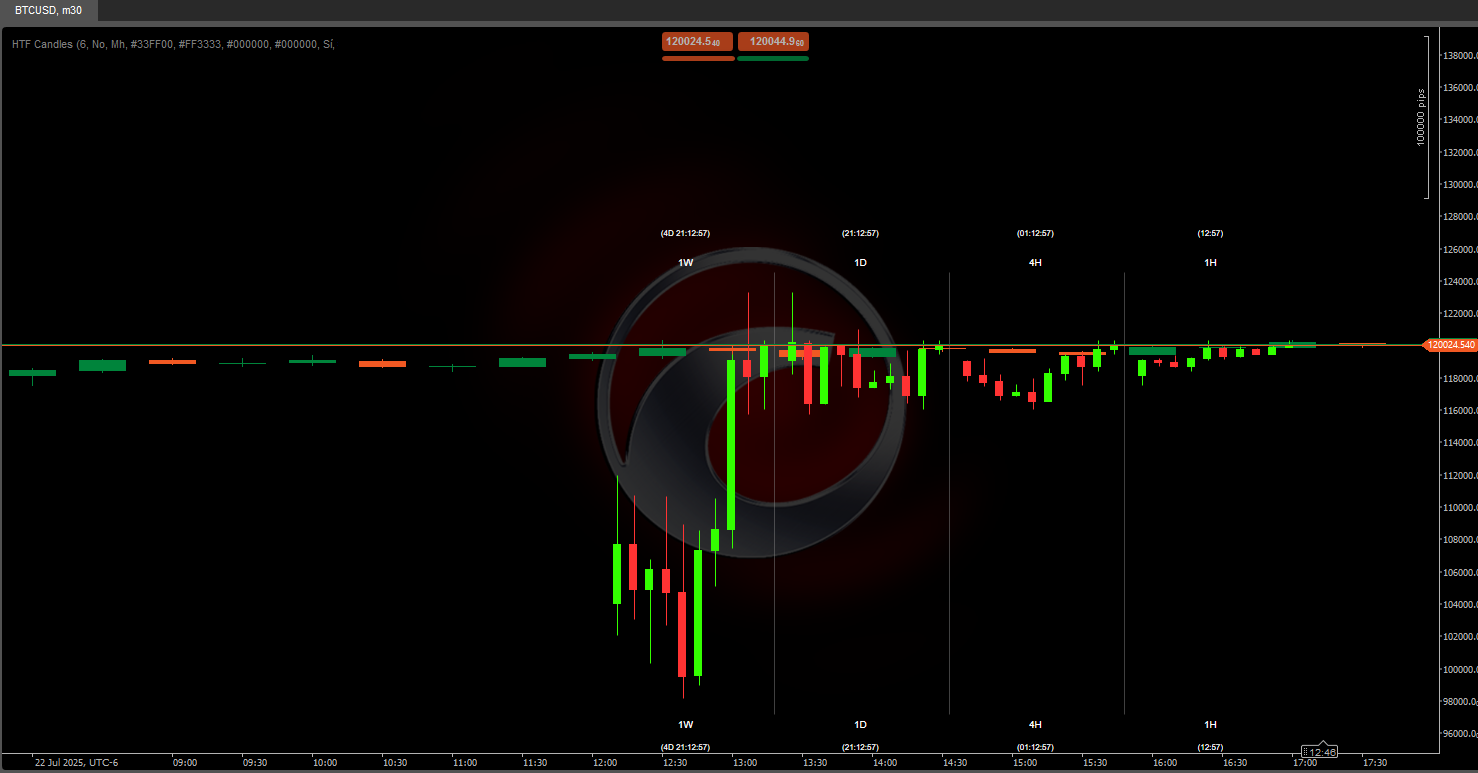
📊 Real-Time HTF Visualization
This algorithm displays higher timeframe candles (1W, 1D, 4H, 1H) directly on your trading chart, giving you complete market structure at a glance - no window switching needed!
🔍 Quick Analysis
Spot major trends (daily/weekly direction) while trading lower timeframes
• Advanced Feature: HTF candles update in real-time - color changes instantly show momentum shifts
⚙️ How To Use
• Toggle individual HTF blocks on/off
• Adjust visible candles (1-10 per timeframe)
💡 Game-Changing Benefits
Now you can:
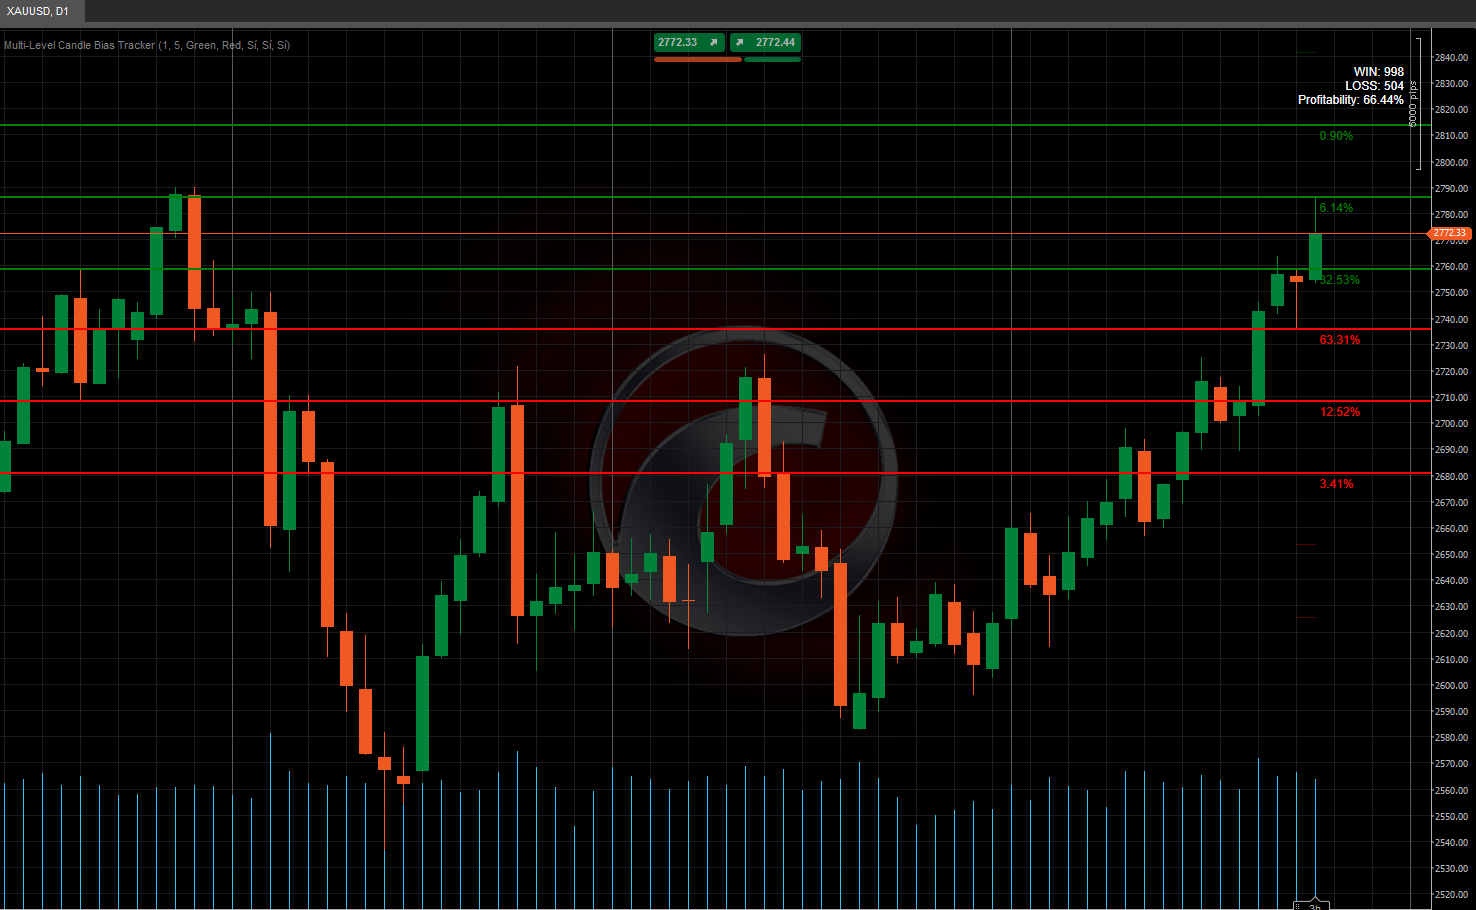
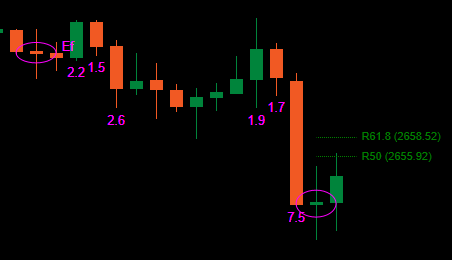
1️⃣ Anticipate key candle closings
2️⃣ Detect trend reversals live
3️⃣ Monitor key levels across multiple timeframes simultaneously
🚀 Coming Improvements
Horizontal scroll will enable:
• Historical HTF pattern analysis
• Current vs. past structure comparison
• Key zone identification on higher timeframes
📚 Practical Examples
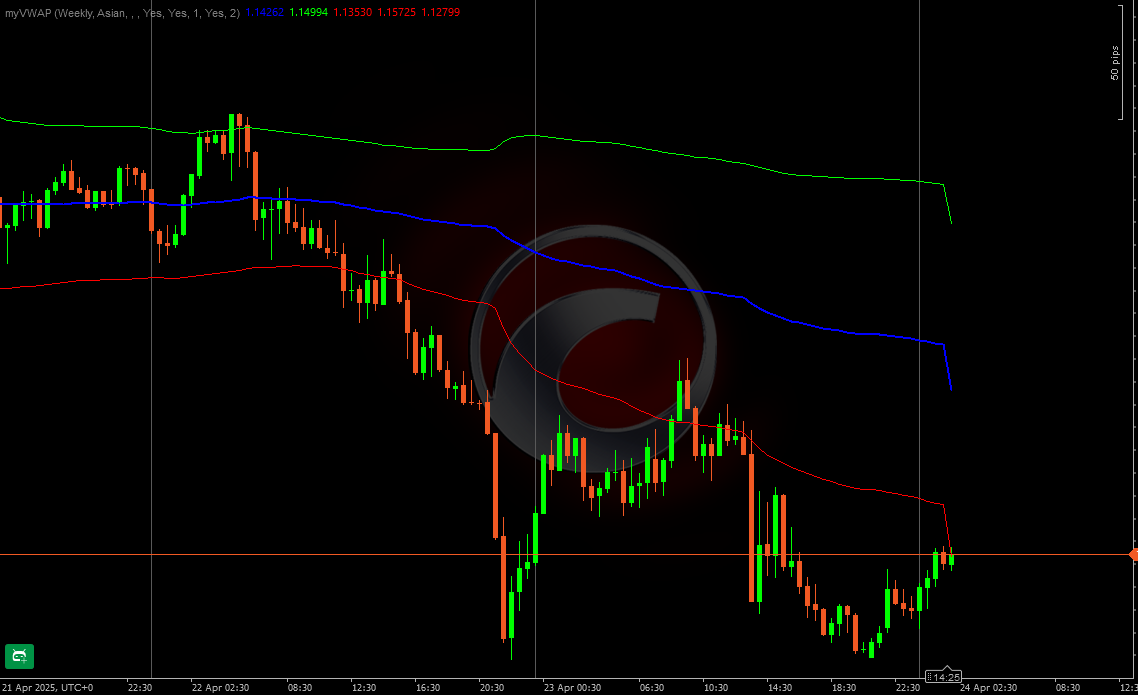
• When 1W = green & 1D = red → Market is correcting within bullish trend → Only short at key resistance bounces
• Trend Hierarchy: 1W > 1D > 4H > 1H → Always trade with weekly candle direction
• Confluence Entries:
- Price at 1D support + emerging green 4H candle = Long opportunity
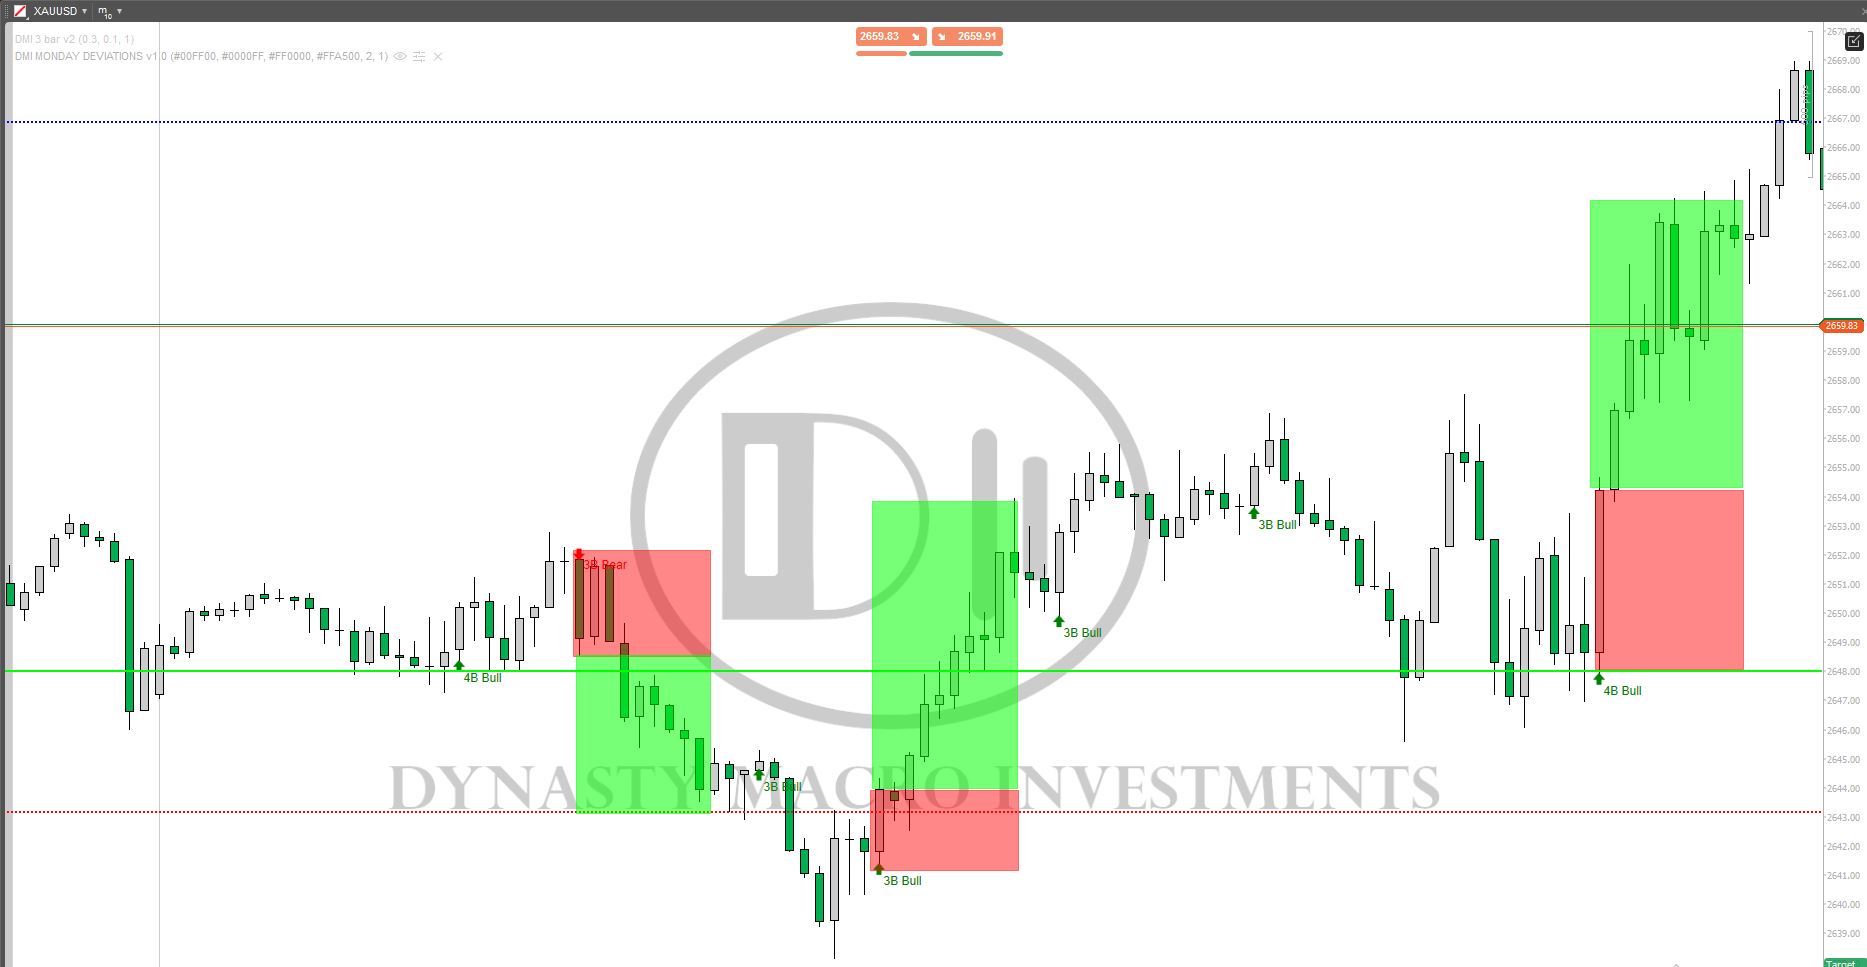
- Resistance at 1H high + red 4H candle = Short with stop above high
• Breakout Patterns: - If 1H candle breaks previous high before closing (timer active), expect bullish continuation