Indicator
Indices
E7 BlackScholes Model

5.0
03/09/2025
150
Desktop
Since 18/12/2024
Free installs
2252
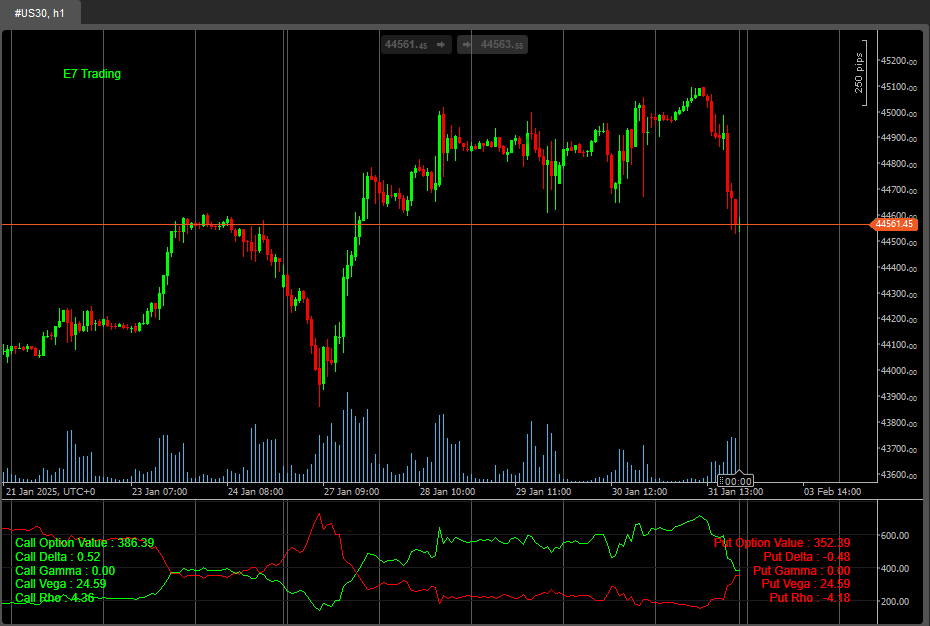
This is a very simple example of using the ‘Math.Numerics’ package inside cTrader to calculate Option pricing using the BlackScholes model.
Future version will include more sophisticated implementations.
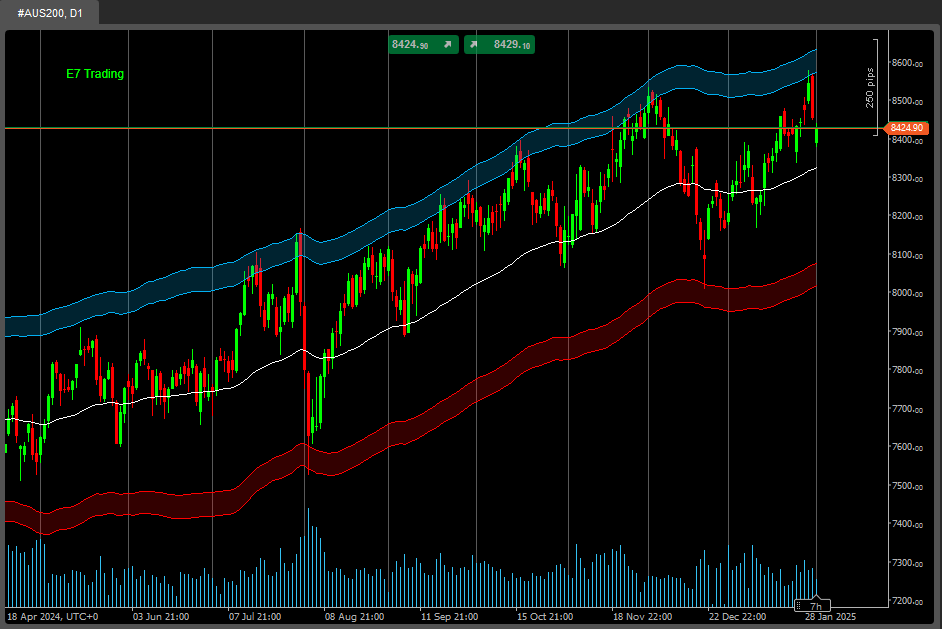
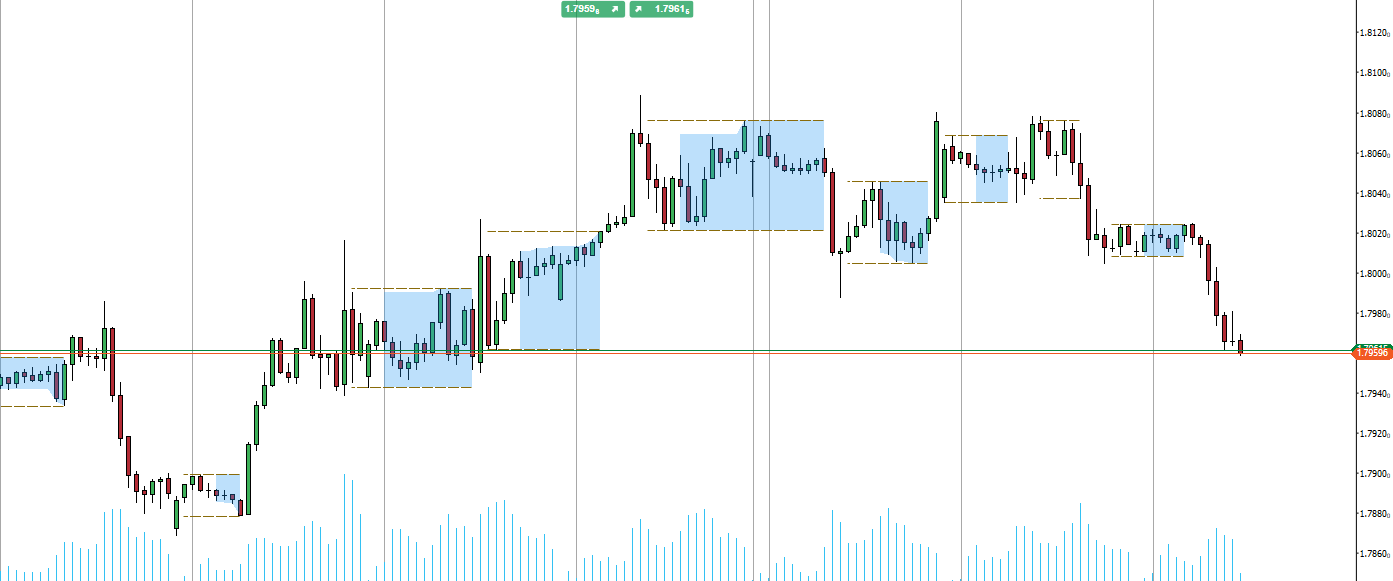
This should only be used for indices for now, thanks.
Happy hunting!
More from this author
Indicator
Prop
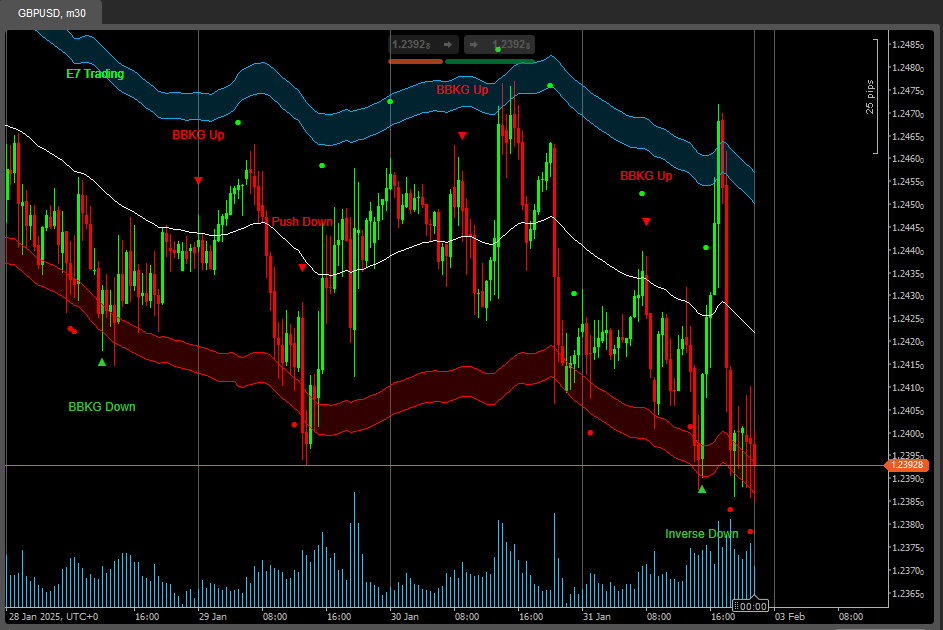
E7 BBKG Indicator
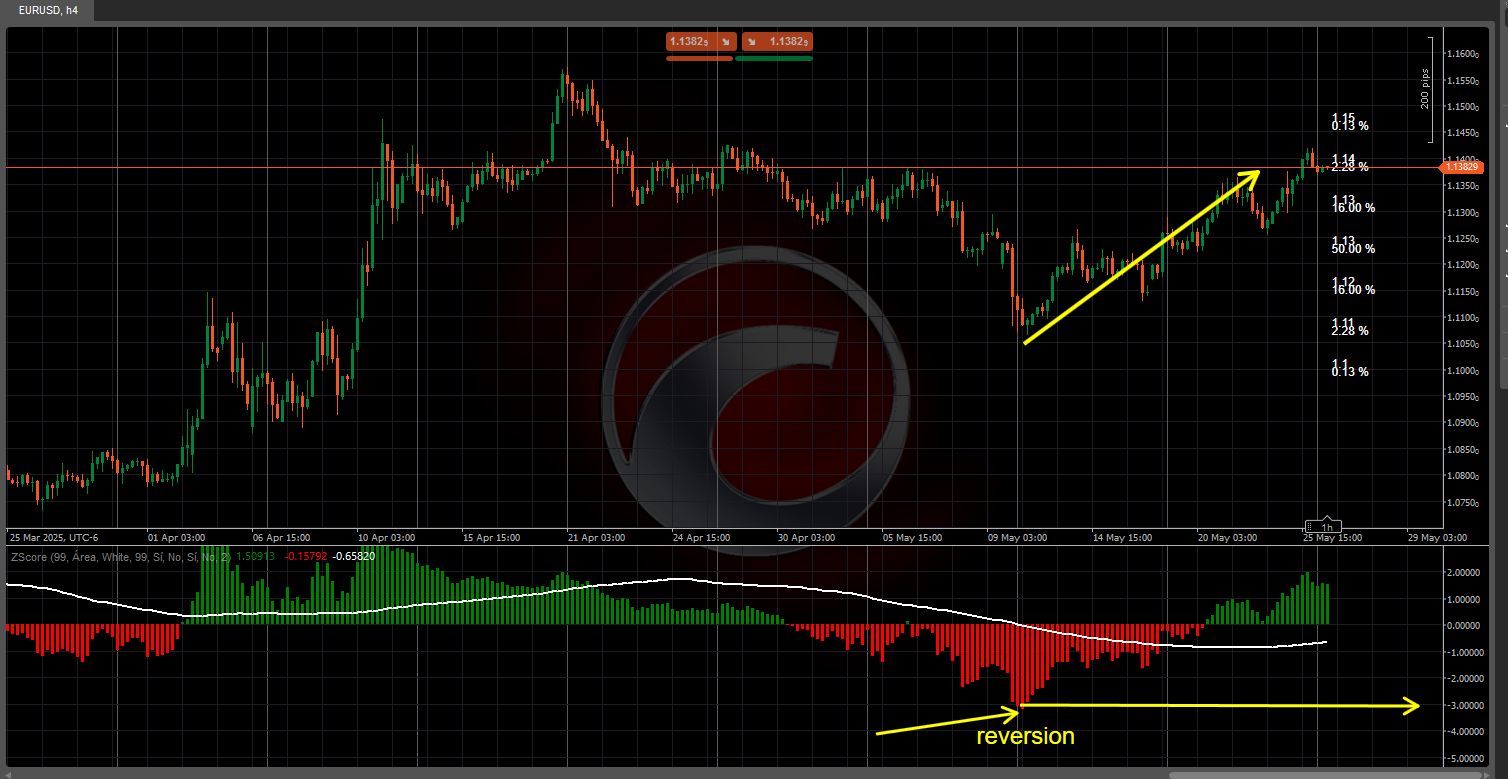
E7 BBKG indicator with 80% plus accuracy used to show both, possible reversal and trend.
Indicator
Bollinger
E7 Indicators Free Overlays
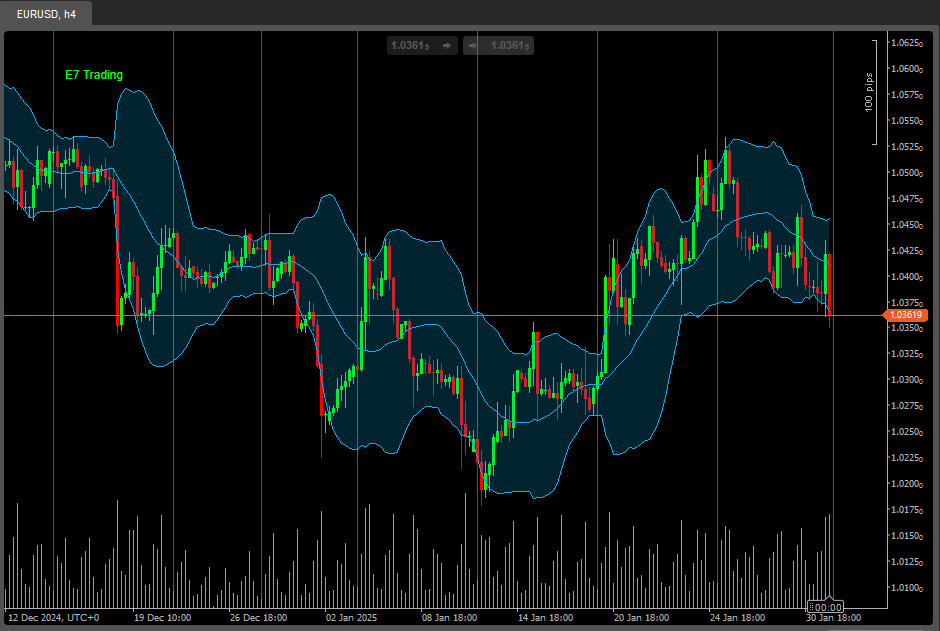
Bollinger Band Cloud, Heiken Ashi, Trend Follower and Parabolic SAR.
Indicator
Bollinger
E7 Indicators Free Studies
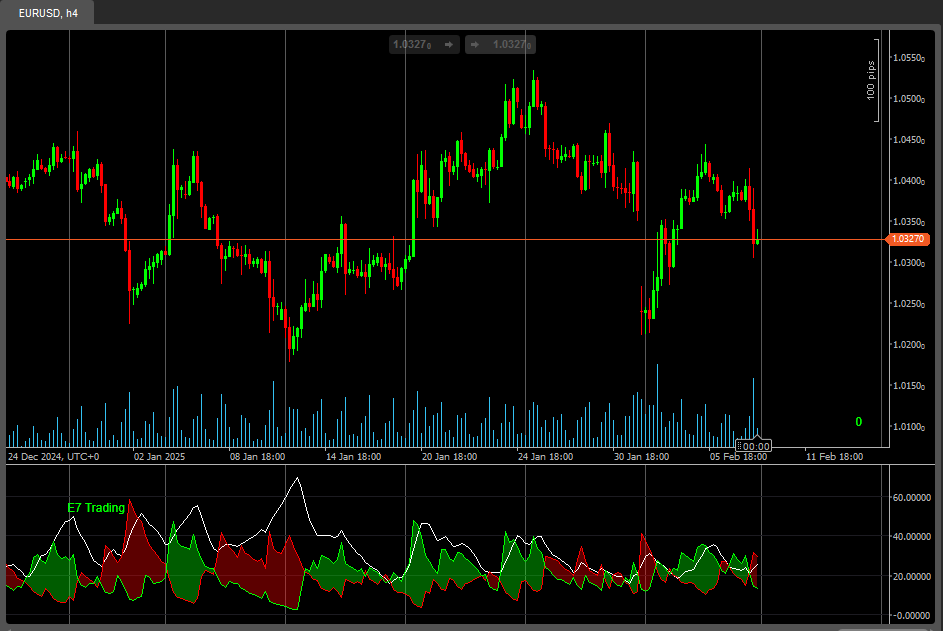
ADXR, KDJ, SineWave, Bollinger Band Volatility and AEOscillator.

cBot
AI
E7 BBKG NumSharp Sample
NumSharp and Pandas Sample CODE ONLY!!! Our mission is to make Machine Learning inside cTrader easier for everyone.
You may also like
Indicator
EURUSD
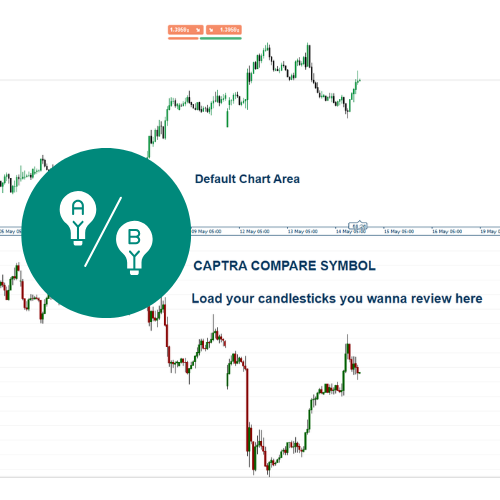
Compare Symbol
Plots chosen symbol's close price, candlestick (wick, body) on cTrader chart, supports multiple timeframes.


Indicator
RSI
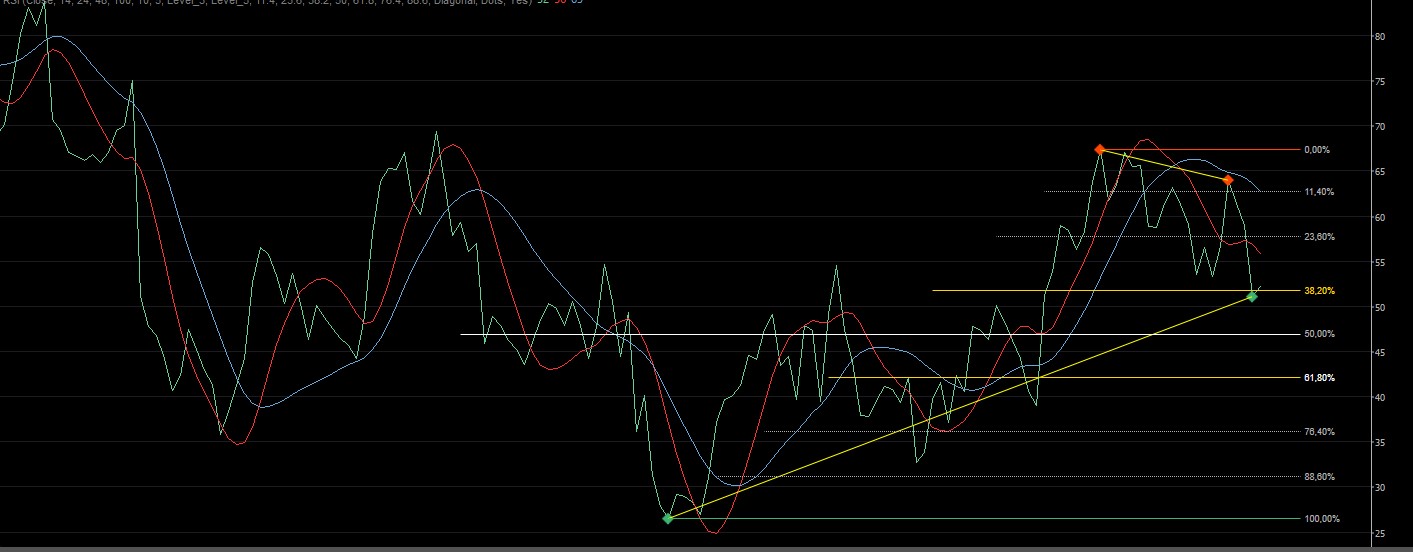
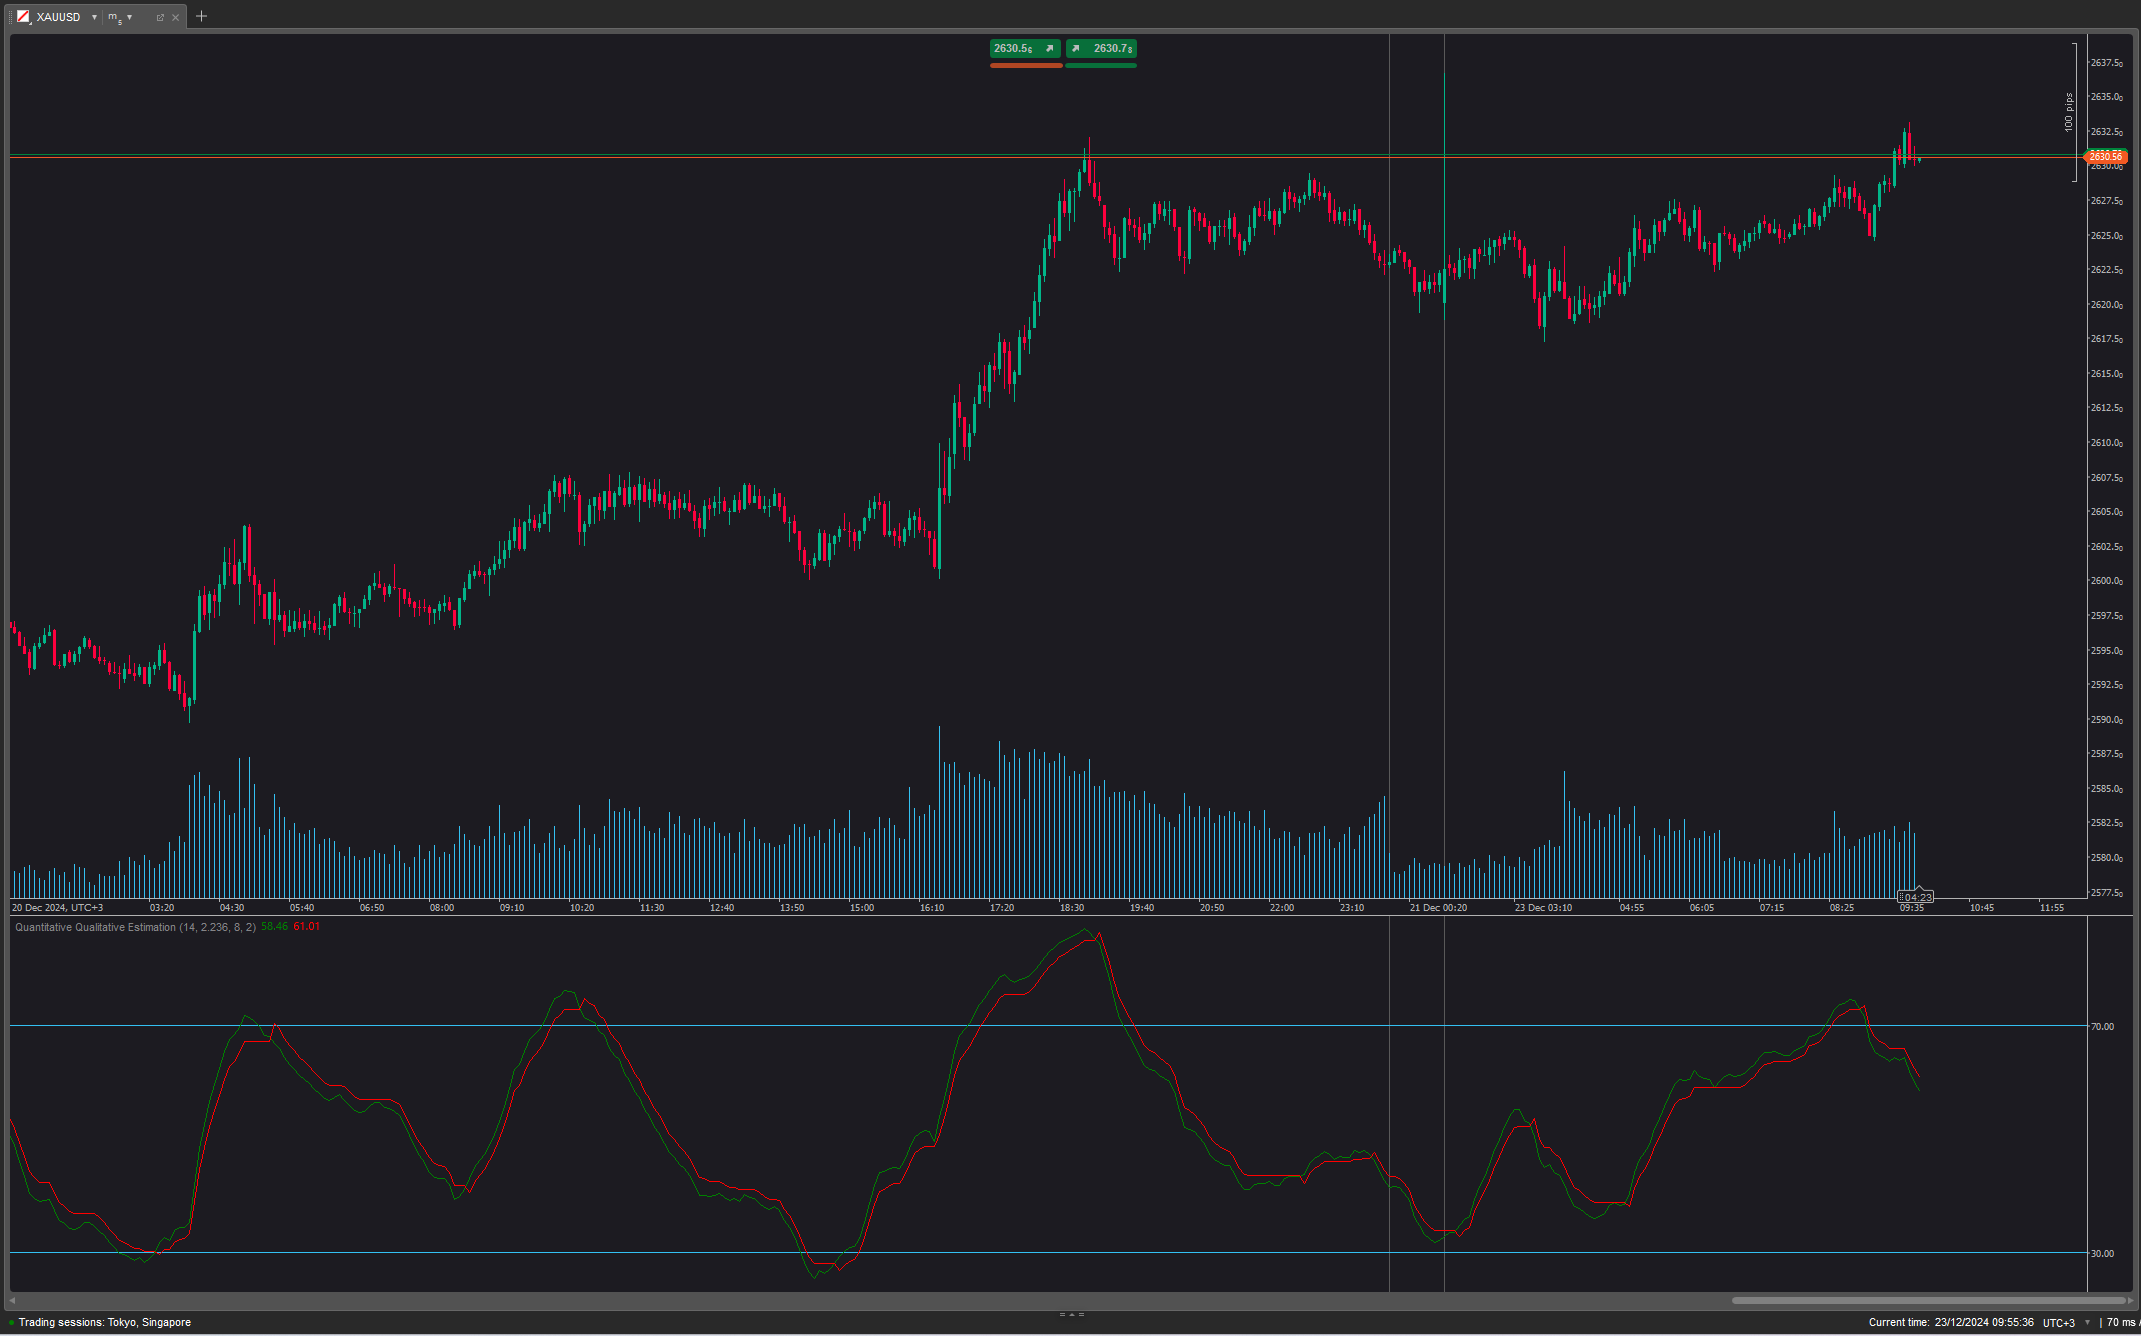
Quantitative Qualitative Estimation
The QQE (Quantitative Qualitative Estimation) Weighted Oscillator improves its original version by weighting the RSI.
Popular

Indicator
Breakout
VegaXLR - Fixed Range Volume Profile
Identify key support and resistance levels through detailed volume distribution analysis.