Indicator
Forex
VegaXLR - Fibonacci Bands
08/09/2025
1
Desktop
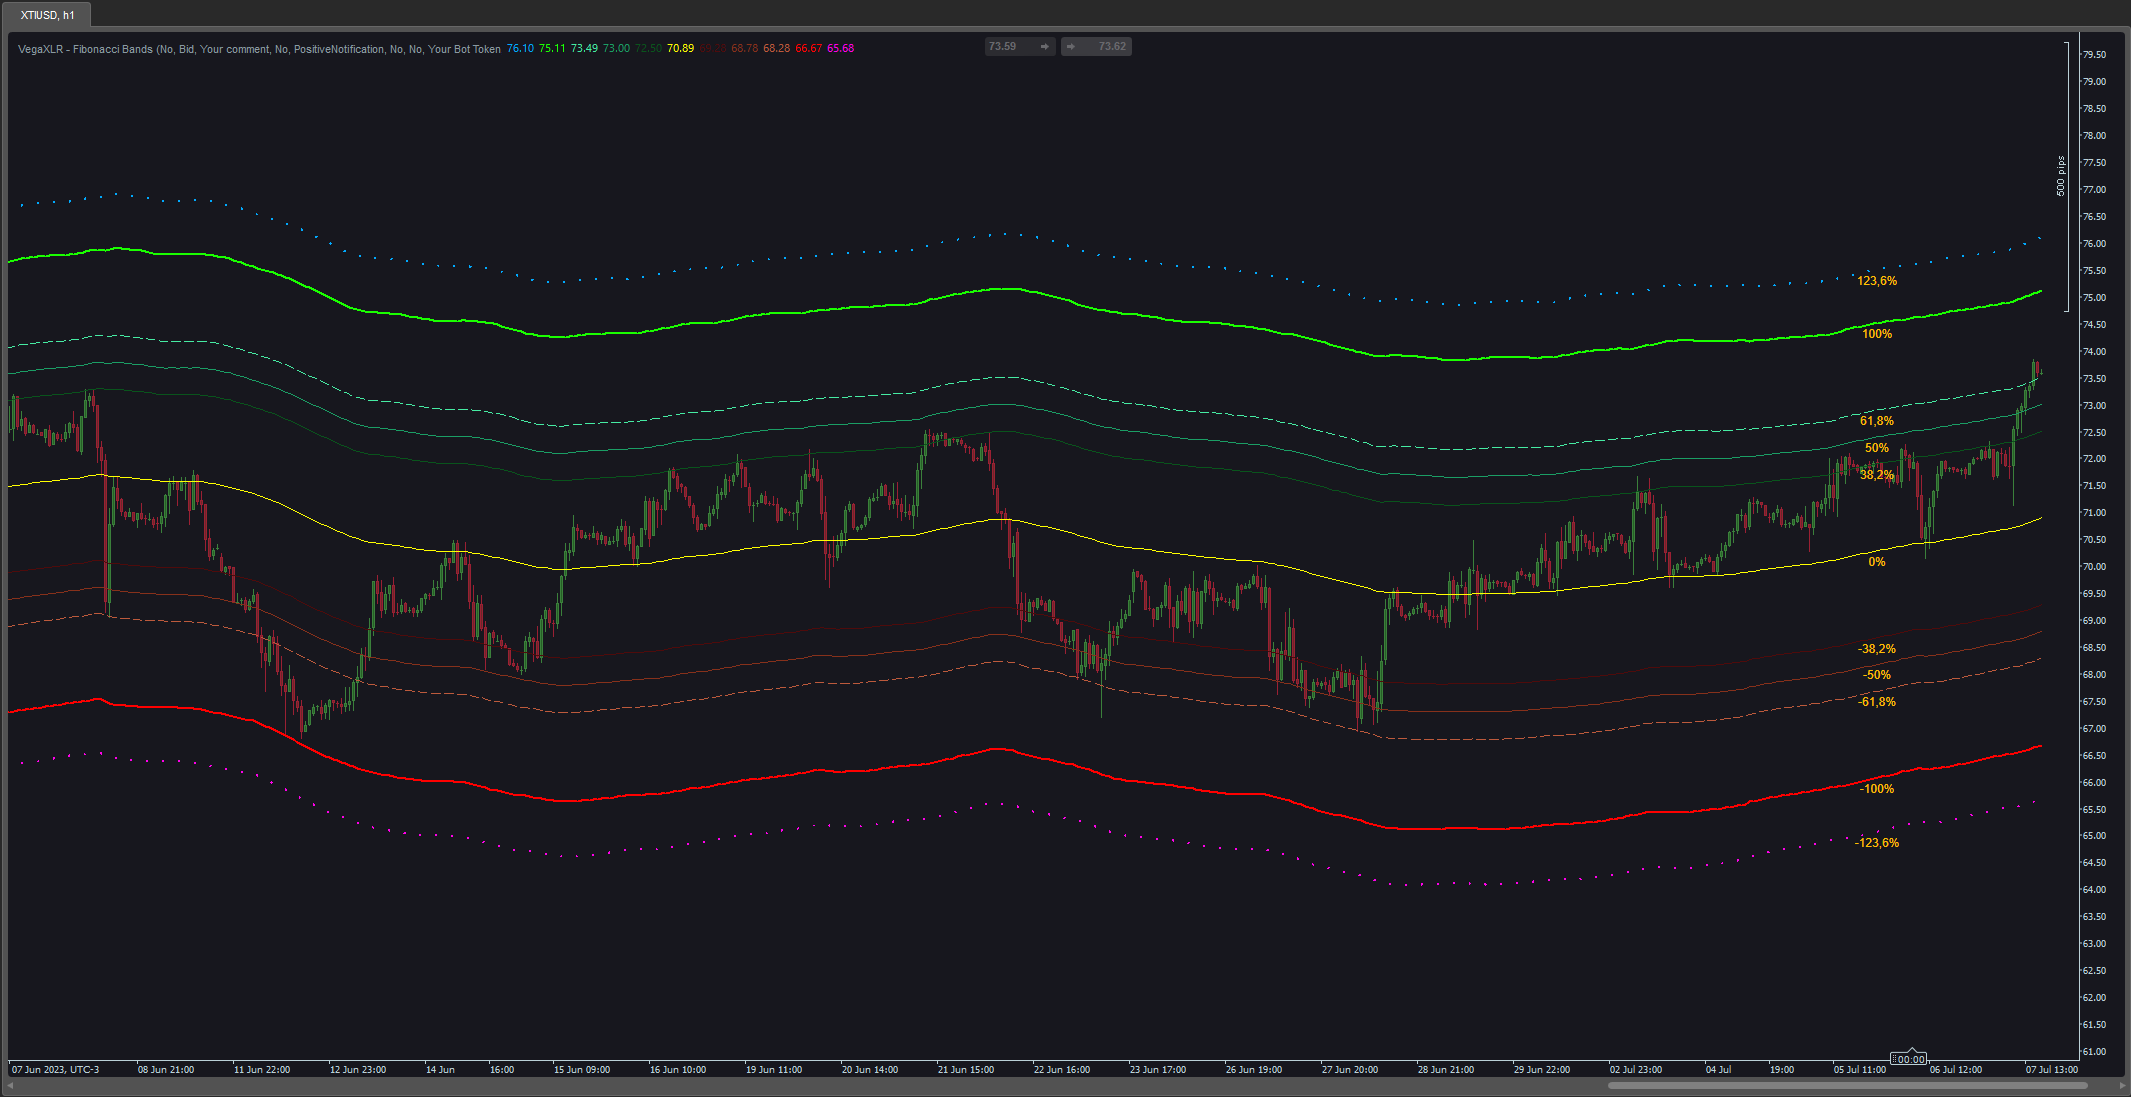
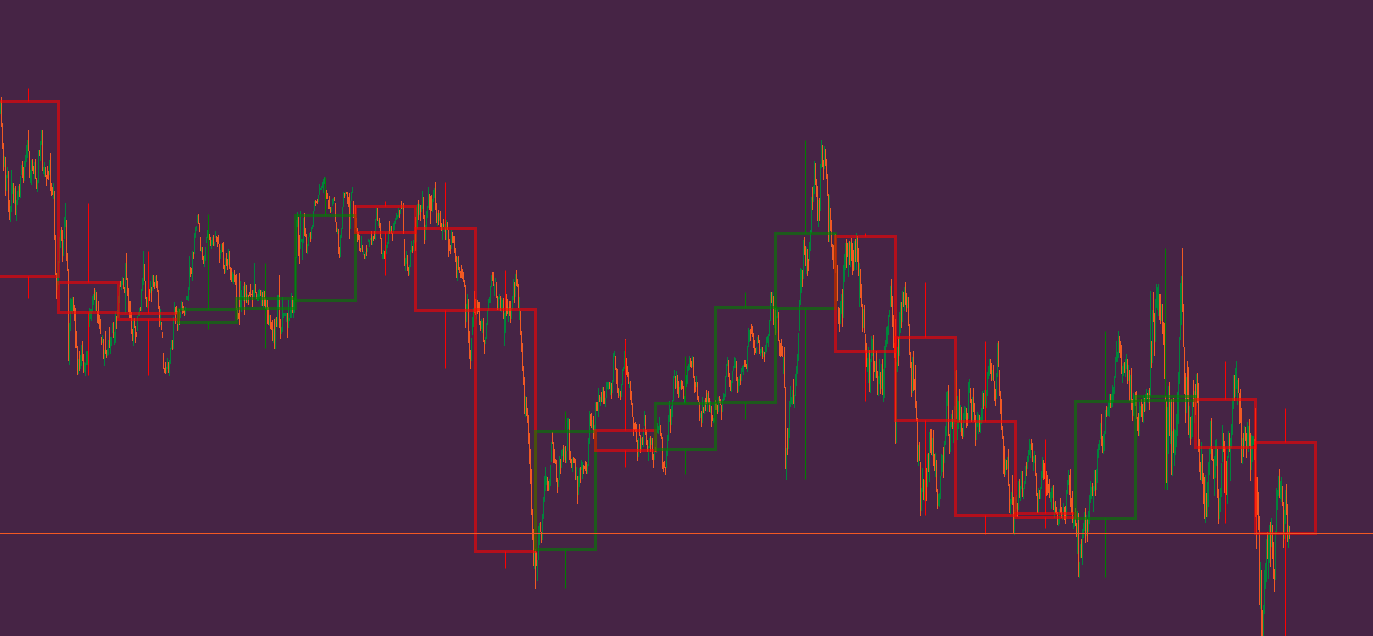
If you're looking for a dynamic Fibonacci channel indicator for cTrader, look no further. This indicator automatically draws Fibonacci bands parallel to a moving average of your choice. It's user-friendly and, like my other indicators, provides alerts through Pop-up, Sound, Email, and Telegram messages. Plus, you have the flexibility to customize the Bands, Fibonacci levels, and Alerts.
Here's a list of its features:
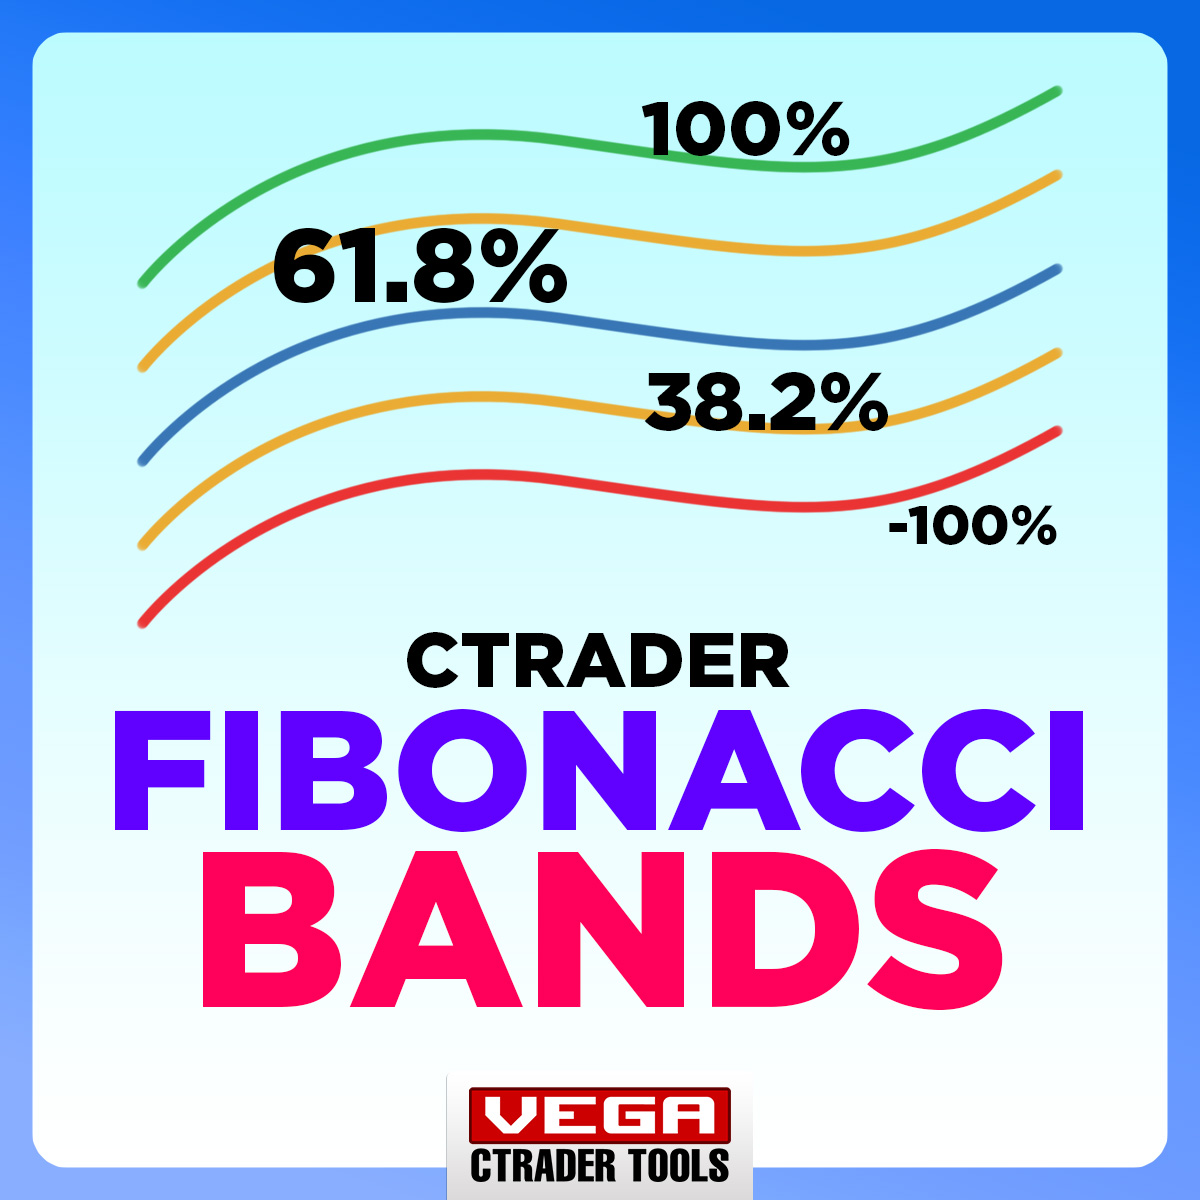
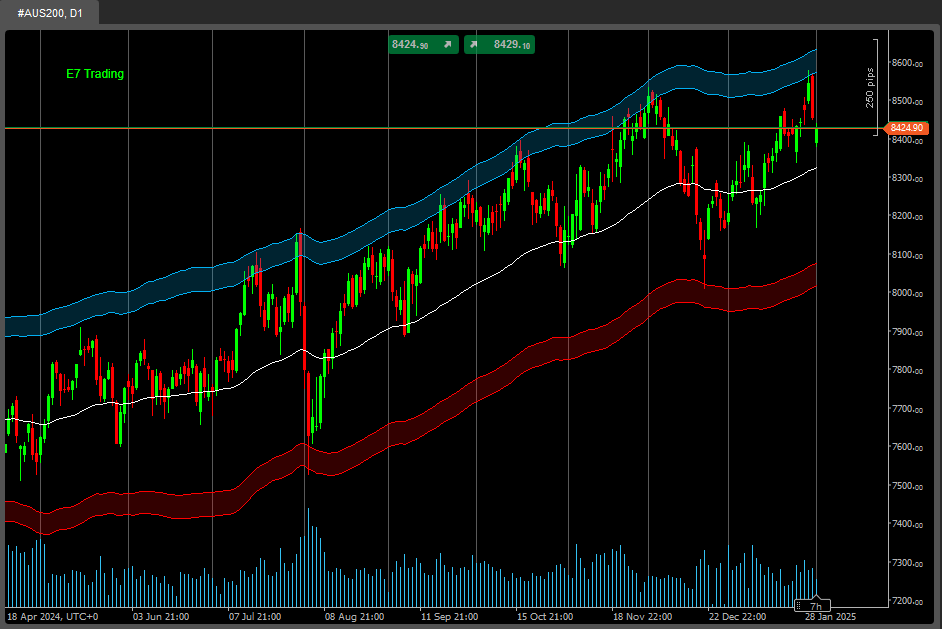
- Fibonacci Bands Calculation: The indicator calculates and plots Fibonacci bands based on your selected moving average. These bands stem from Fibonacci levels (e.g., 0.0%, 38.2%, 61.8%, or any others) and extend above and below the moving average by a specified factor.
- Moving Average Configuration: Customize the moving average type (e.g., Simple, Exponential, etc.) and the number of periods used in the calculation. The moving average serves as the foundation for the Fibonacci bands.
- Alert Functionality: The indicator offers various alert options to notify traders about specific events. This includes price level touch alerts and proximity alerts.
- Price Level Touch Alerts: Configure the indicator to trigger alerts when the price touches specific Fibonacci levels. Alerts can be based on the closing price or immediately when the price touches the level.
- Proximity Alerts: Set up proximity alerts to receive notifications when the price approaches or moves away from a specified Fibonacci level within a defined distance. Alerts can trigger when the price is approaching or distancing from the level.
- Alert Output Options: Choose from sound alerts, pop-ups, Telegram messages, and email notifications for alerts. Sound alerts can be customized by selecting different sound files.
- Visualization Options: Customize the visualization of Fibonacci levels with options such as displaying percentage values, setting color for percentage labels, controlling label location on the chart, enabling/disabling specific bands, and choosing color, thickness, and appearance of the bands.
- Configurable Fibonacci Levels: Tailor the indicator to your trading strategy by adjusting the specific Fibonacci levels used in the calculation. Positive and negative Fibonacci levels can be customized individually.
- Built-in User Guide: You can access the user guide for this indicator directly from the chart.
In summary, the VegaXLR - Fibonacci Bands indicator combines Fibonacci analysis and moving averages to help identify potential support and resistance levels. With configurable alert functionality and visualization options, it's an invaluable tool for traders who rely on Fibonacci retracements or expansions.
More from this author
Popular

Indicator
Breakout
VegaXLR - Fixed Range Volume Profile
Identify key support and resistance levels through detailed volume distribution analysis.

Indicator
Forex
VegaXLR - Chart Patterns Alerts
Enhance your trading strategy with automated detection and alerts for key chart patterns.
Indicator
Forex
VegaXLR - Candlestick Patterns Alerts
Real-Time Candlestick Pattern Detection with Custom Alerts & Trend Analysis for cTrader
Indicator
Forex
VegaXLR - ZigZag Alerts
cTrader ZigZag Alerts: Precision Swing Detection, Alerts, and Fibonacci.
Popular
Indicator
Forex
VegaXLR - cTrader Multi-Timeframe Pivot Pro
Customizable multi-timeframe pivot point indicator for cTrader with alerts, Fibonacci, CPR, and more!
Indicator
RSI
VegaXLR - RSI and StochRSI Alerts
VegaXLR's cTrader StochRSI identifies overbought/oversold RSI levels for precise trade entries.
Indicator
Forex
VegaXLR - Auto Support and Resistance
cTrader Auto Support & Resistance detects key levels with Fibonacci analysis and sends real-time trading alerts.
cBot
Forex
VegaXLR - Fibonacci Trading cBot
Automate Fibonacci trading with this cTrader cBot—advanced risk management, alerts, and seamless order execution.
Indicator
Forex
VegaXLR - Candlestick Patterns Pro
Identify 34 candlestick patterns, track trends across timeframes, and get instant alerts with this powerful trading tool

Indicator
Forex
VegaXLR - Market Sessions Alerts
The cTrader Market Sessions Alerts Indicator marks global sessions, highlights key levels, and sends real-time alerts.
cBot
RSI
VegaXLR - cTrader Account Protector
This is an advanced tool designed to protect your trading account by managing drawdown and run-up levels.
You may also like
!["[Stellar Strategies] Market Regime Filter" logo](https://market-prod-23f4d22-e289.s3.amazonaws.com/cb84a98c-46f6-4cfd-b0ba-16518a618cb1_cT_cs_4141285_EURUSD_2025-04-20_16-50-30.png)
.jpeg)

Indicator
Indices
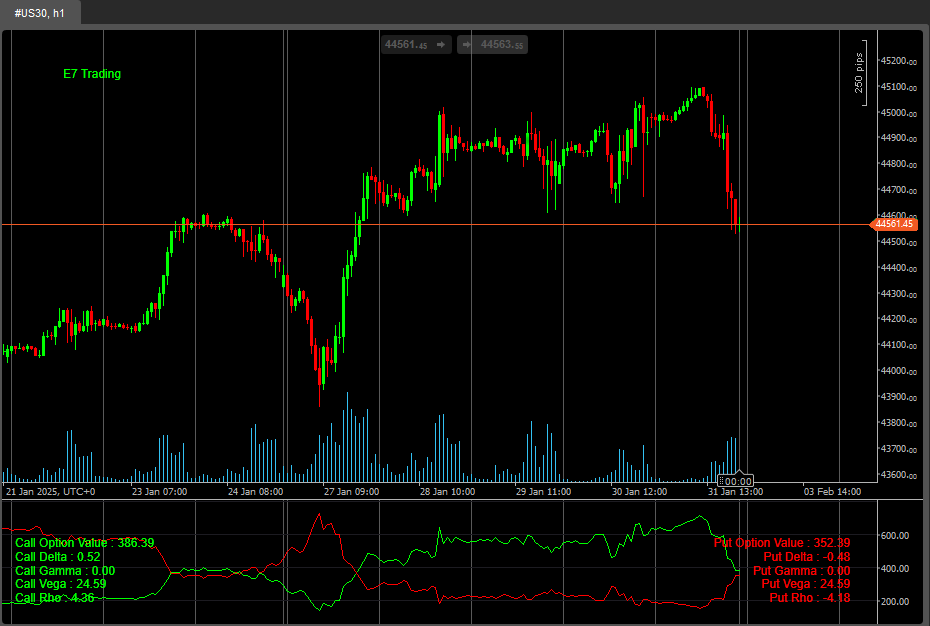
E7 BlackScholes Model
Option pricing using the BlackScholes model and the Math.Numerics packages