Chart Overview
"Chart Overview" logo
03/09/2025
Desktop
Since 23/12/2024
"Chart Overview" uploaded image"Chart Overview" uploaded image"Chart Overview" uploaded image

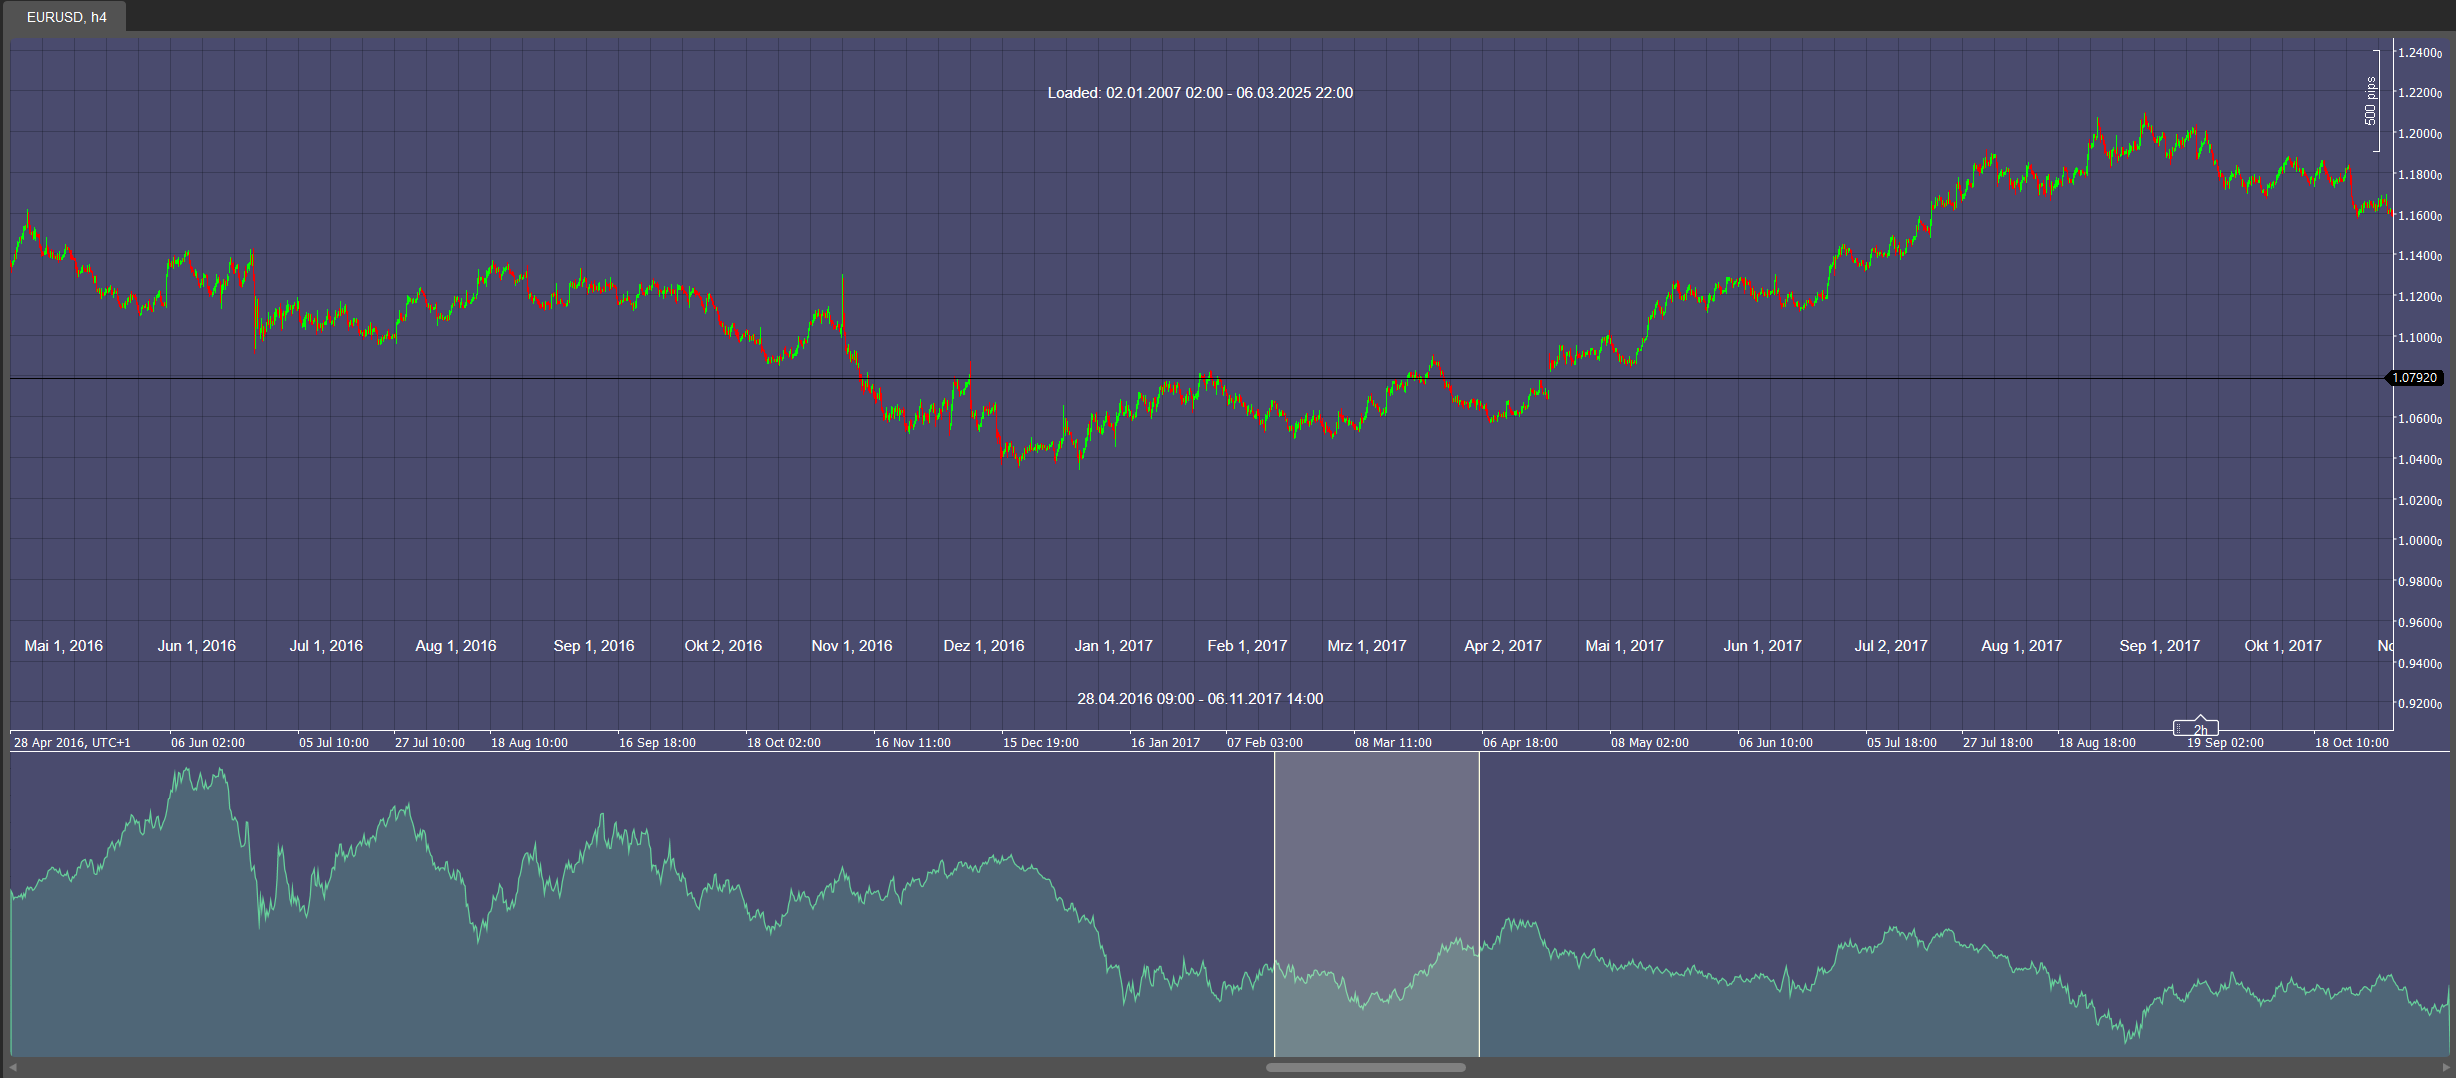
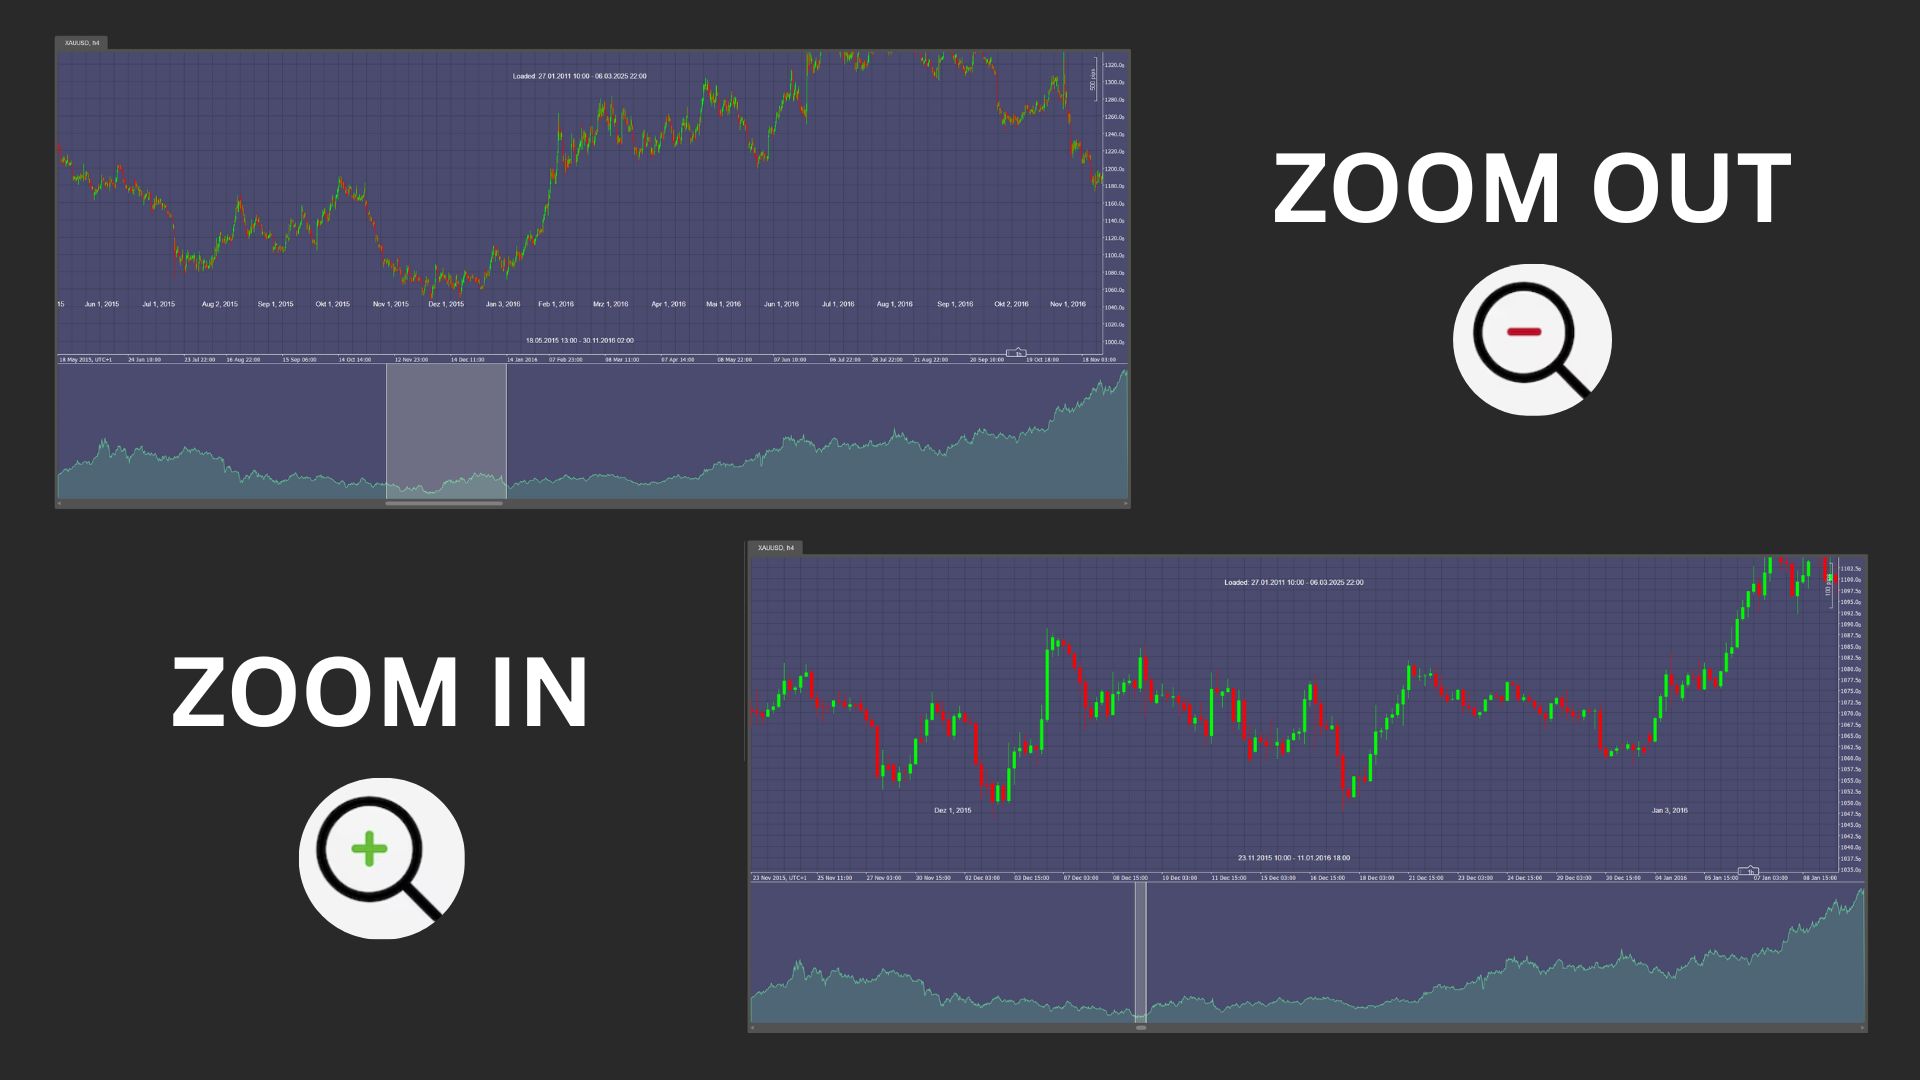
ChartOverview keeps you fully informed of the market’s entire data range, from the earliest to the latest available data point. At the top of your chart, you see a clear display of the complete loaded timeframe, while the current visible period is showcased directly on the chart for real-time insights.

This dynamic indicator updates seamlessly as you scroll, drag, or resize your chart, ensuring you always have up-to-date information. Its intuitive design allows you to quickly identify market trends and opportunities, enhancing your ability to make timely, well-informed trading decisions.

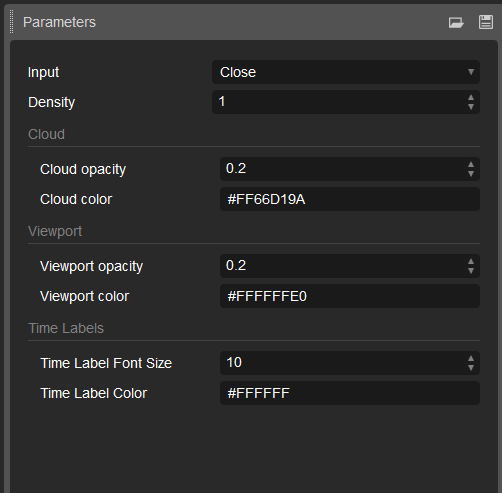
With extensive customization options for colors, opacity, and display settings, ChartOverview integrates perfectly into your personal trading setup. Empower your analysis and gain a competitive edge with a tool designed to deliver a precise and comprehensive market overview.

0.0
Reviews: 0
Customer reviews
No reviews for this product yet. Already tried it? Be the first to tell others!
More from this author
Renko Box Algo
Renko Overlay Algo: Fully Automated Renko Trading with Smart Risk Management
You may also like
Bollinger Bands Breakout Oscillator (+ Alerts)
BB Breakout Oscillator with alerts! Spot trend reversals using Bollinger Bands. Bullish/Bearish crossovers Alerts.
Indicator
Breakout
AI
Scalping
KaufmanEfficiencyRatio
A precision tool for measuring how efficiently price moves from point A to B.
[Stellar Strategies] BOS Trend 1.0
[Stellar Strategies] BOS Trend: Premium multi-timeframe BOS indicator for precision trend analysis.📈📉
Indicator
NAS100
NZDUSD
XAUUSD
+11
Samurai Breakout Lite
⚔️Limited version. Draws clean session box (Tokyo / London / New York / Overlap) and optional breakout plan (EP/TP/SL)⚔️
Indicator
Indices
FVG
Stocks
+4
FAIR VALUE GAP INDICATOR
Pinpoint FVGs, track fills and see mitigation stats — trade imbalances with clarity and confidence.
Indicator
Indices
Prop
Stocks
+3
Fractals
Fractals is a precision-engineered trading indicator for cTrader that reveals the hidden architecture of price action.
Indicator
RSI
Indices
Signal
QQE-MTF
Multi-timeframe version of the Quantitative Qualitative Estimation (QQE) indicator.
SupertrendChannels
Supertrend-based channel for entries, trailing stops, and dynamic support/resistance zones.
Indicator
NZDUSD
XAUUSD
Commodities
+3
AlgoCorner Correlations Map
Check the correlations between dozens of assets in one elegant display.
ScalpingSignalIndicator
Scalping signals with EMA/RSI/ATR logic. Visual cloud shows precise entry and exit zones. Built for M1/M5 scalpers.
Indicator
NAS100
NZDUSD
Martingale
+26
Info Dashboard_noSourceCode
Read the market with AI: live sentiment, news impact, equity, spread & neural net signals in one dashboard.
Indicator
Indices
Signal
Whale Hunting For boom crash
The **Whale Hunting Indicator** is a trading tool for **Boom & Crash and Volatility indices**, featuring **Auto Trend De
VolumeProfile_8
Scalpers Volume Profile
market session
Market session indicator (Asia, Frankfurt, New York, London)
Previous Day Liquidity Zones (PDH - PDL)
Useful indicator for traders who want to visualize key price levels based on previous daily highs and lows.
Indicator
RSI
Breakout
XAUUSD
+5
Prediction Based on Linreg & ATR
📊Predicts price movement by combining multi-timeframe trend analysis, market volatility 📉, and..
Indicator
Indices
RSI
Signal
Rsi + Volume
This indicator combines RSI (Relative Strength Index) with volume analysis to generate more reliable trading signals.
Indicator
VWAP
Indices
Forex
TPO Profile v2.0
TPO Profile v2.0