Indicator
NAS100
NZDUSD
Breakout
XAUUSD
FVG
Commodities
Forex
Fibonacci
Signal
EURUSD
GBPUSD
BTCUSD
SMC
ZigZag
Indices
Prop
ATR
Stocks
Crypto
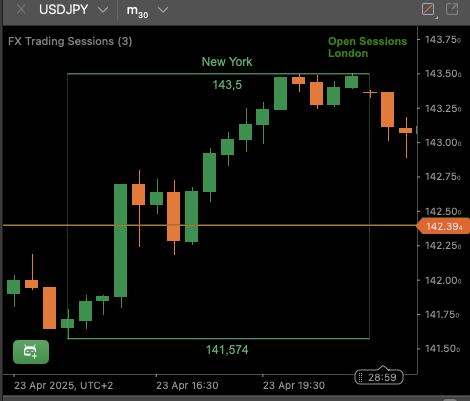
USDJPY
Scalping
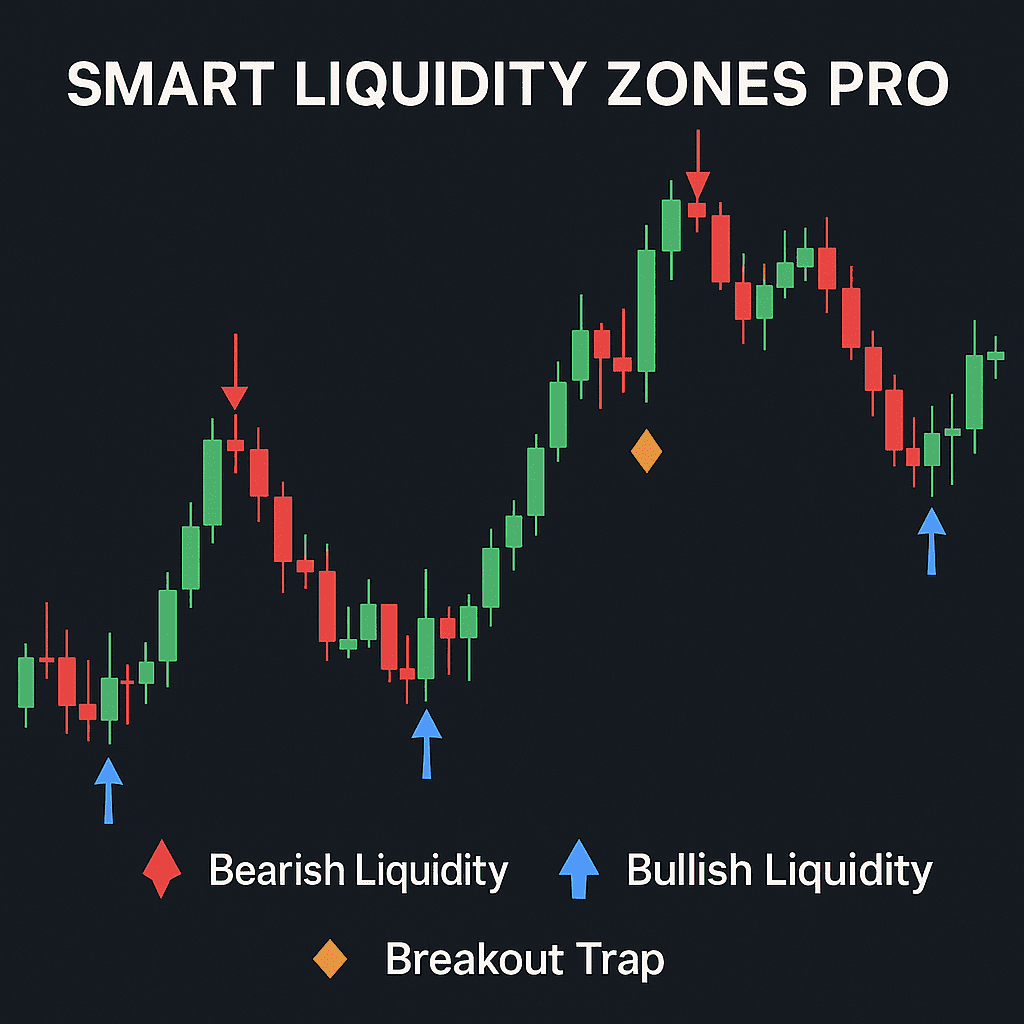
Free Smart Money Concepts (SMC) from TradingView

5.0
17/10/2025
266
Desktop
- 🔷 What is Smart Money Concepts (SMC)?
- SMC is a price-action framework focused on how institutional “smart money” accumulates and distributes positions.
- It replaces basic patterns with a logical map of market structure (BOS/CHoCH), liquidity (EQH/EQL), Order Blocks (OB), Fair Value Gaps (FVG), and premium/discount zones to anticipate likely continuations or reversals.
- 🚀 What this indicator does
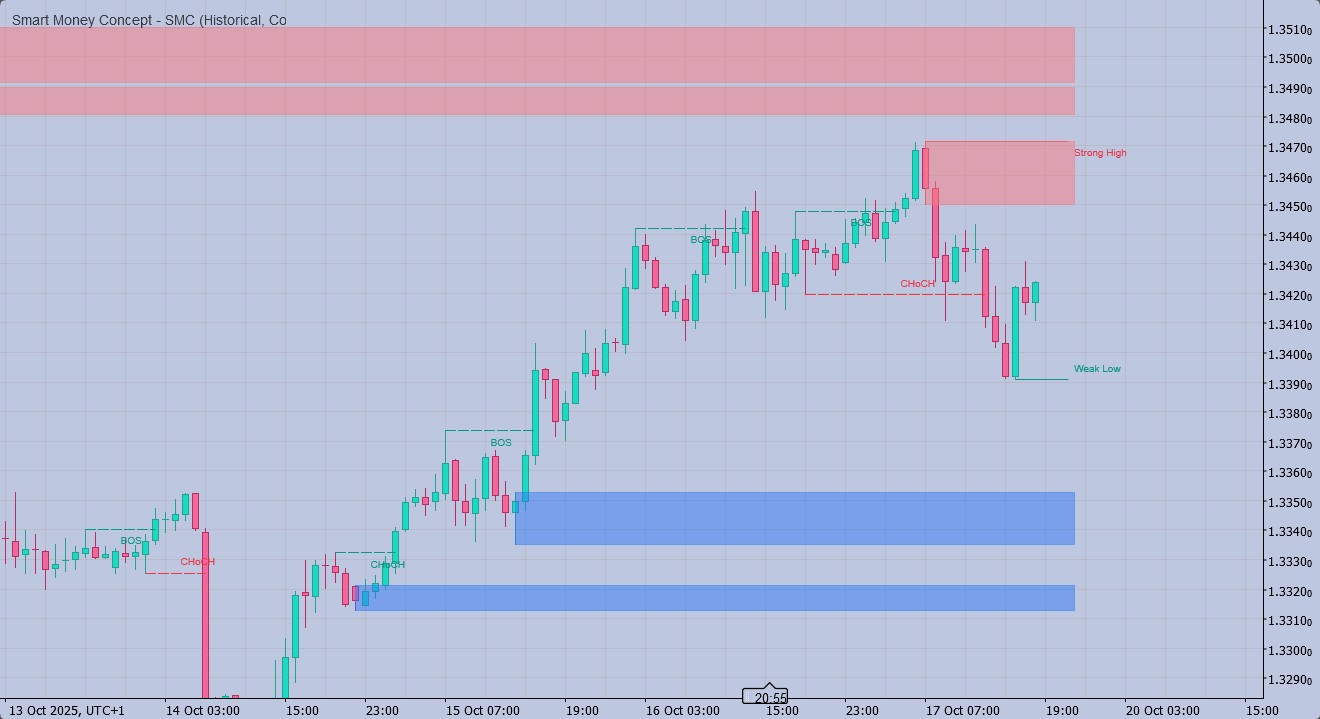
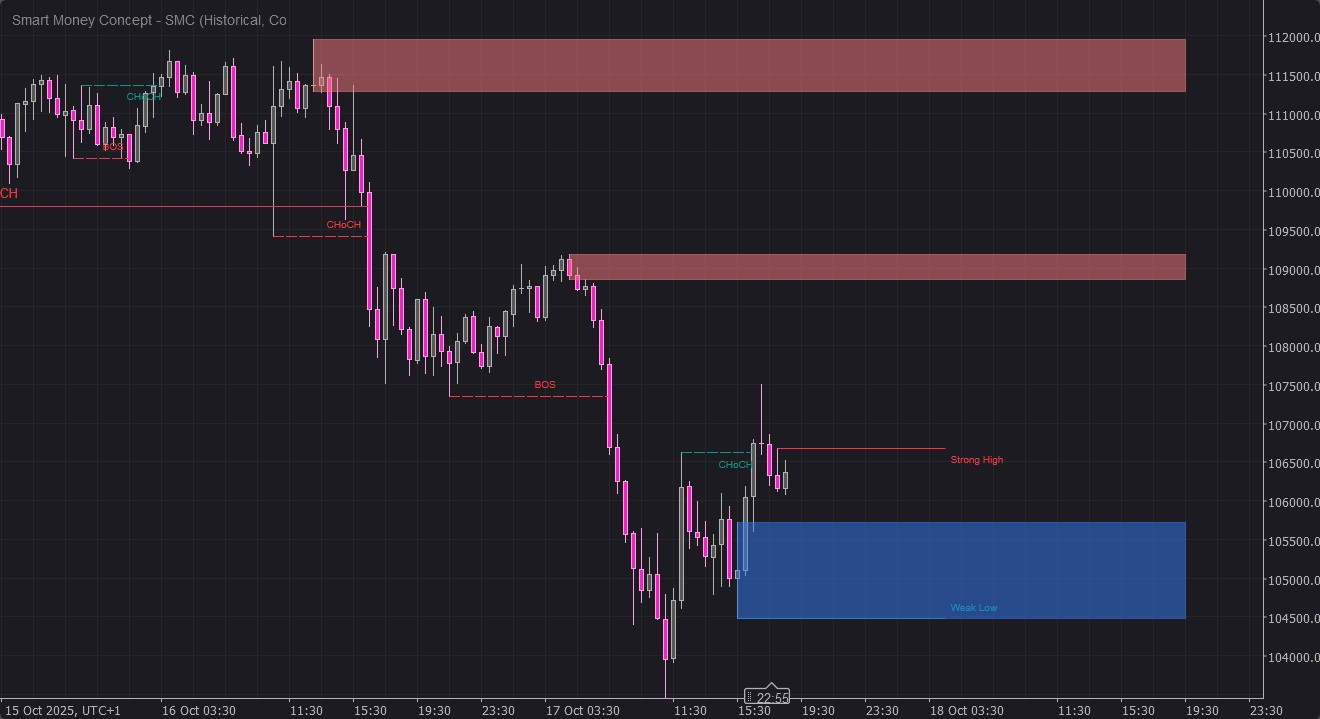
- Detects Break of Structure (BOS) and Change of Character (CHoCH) in both swing and internal structure.
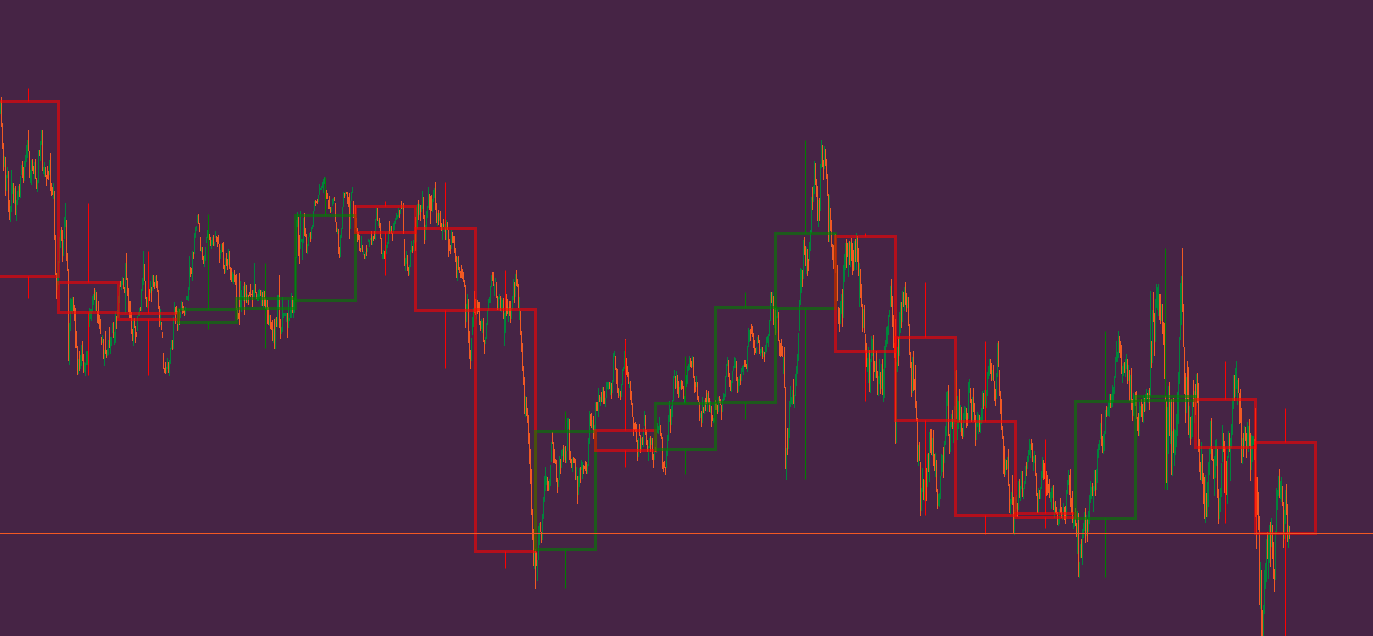
- Draws Order Blocks (OB) and Fair Value Gaps (FVG) as semi-transparent zones (RGBA colors—opacity is fully user-controlled).
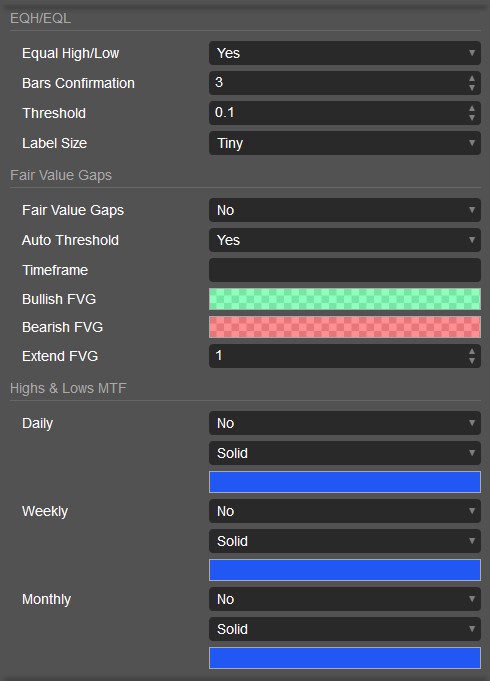
- Marks Equal Highs/Equal Lows (EQH/EQL) to show liquidity pools.
- Labels Strong/Weak High/Low so you can see which side is likely to be targeted or protected.
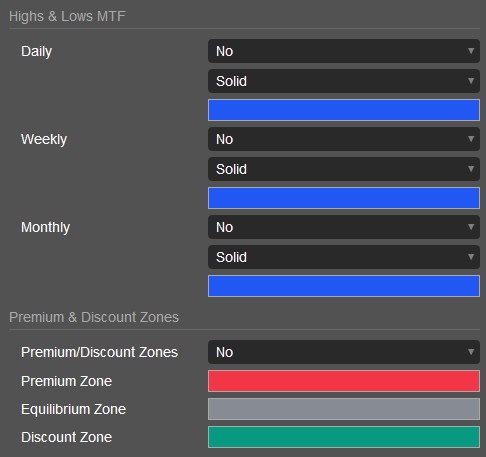
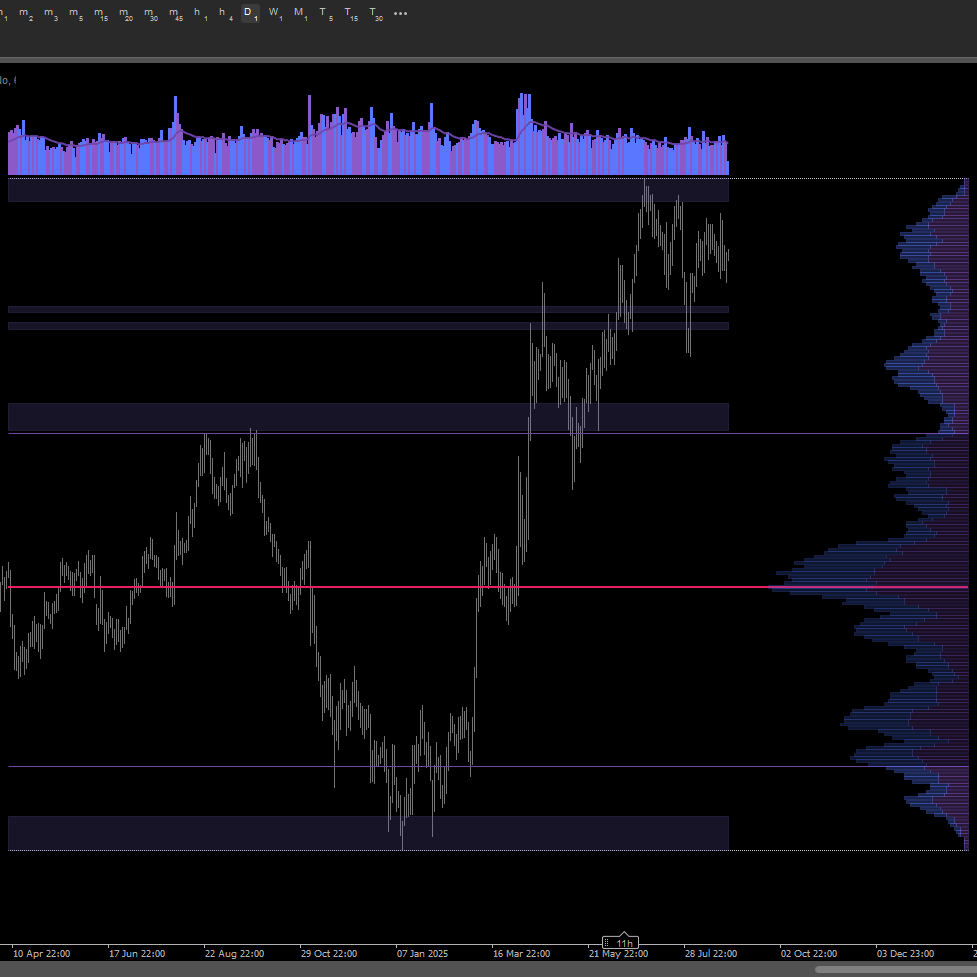
- Plots Premium/Equilibrium/Discount zones across the current swing range for value-area context.
- Overlays Daily/Weekly/Monthly highs & lows for multi-timeframe confluence.
- Offers Present/Historical drawing modes and Monochrome/Colored styles.
- 🧭 How to use it (practical workflow)
- 1) Read structure first:
- Look for BOS/CHoCH on swing and internal levels to establish bias.
- A bullish BOS + internal BOS often signals continuation; a CHoCH warns of potential reversal.
- 2) Map imbalances and blocks:
- Use FVG as “efficiency targets” where price often rebalances.
- Use OB as likely mitigation zones where entries can form (e.g., limit or confirmation entries).
- 3) Align with liquidity:
- Watch EQH/EQL for liquidity sweeps; the sweep + BOS is a strong SMC narrative.
- Note Strong/Weak High/Low to gauge which side is vulnerable.
- 4) Add confluence:
- Check premium/discount: buy setups are higher-probability in discount; sell setups in premium.
- Add MTF levels (D/W/M) and your own session timing for precision.
- 5) Execute and manage:
- Entries: OB mitigation or FVG fills with structure alignment.
- Stops: beyond the invalidation of the OB/FVG or the most recent strong pivot.
- Targets: opposite liquidity, opposing OB/FVG, or equilibrium of the swing.
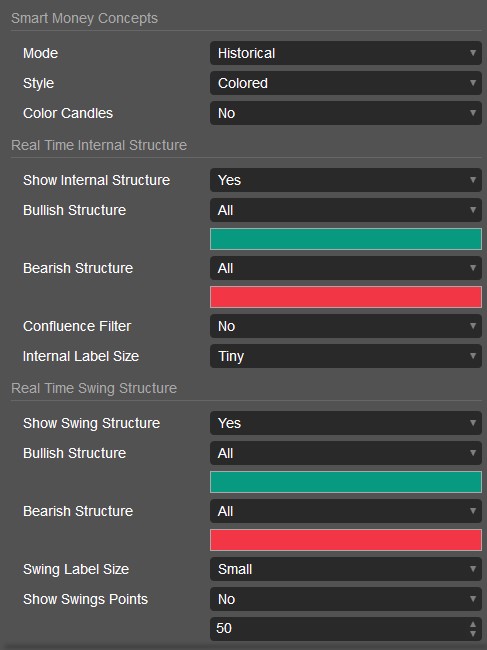
- ⚙️ Key settings you control
- Mode: Historical vs Present (clean real-time look).
- Structure filters: Show BOS/CHoCH for swing vs internal; label sizes; optional confluence (wick logic).
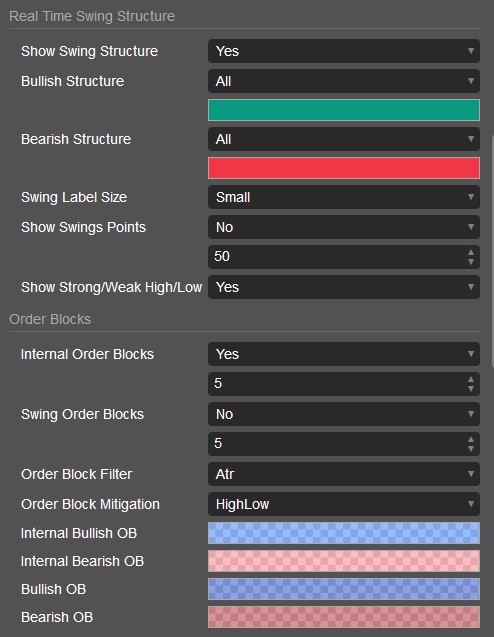
- OB/FVG colors: Choose any RGBA color; the alpha channel sets transparency directly.
- Counts/limits: Max number of visible OBs; FVG extension; EQH/EQL sensitivity.
- MTF levels: Toggle Daily/Weekly/Monthly and pick line styles.
- Style: Colored or Monochrome, plus optional candle coloring by trend.
- 🧩 Why traders like it
- 1:1 parity logic with the popular TradingView SMC approach (BOS/CHoCH, OB/FVG parity).
- Clean visuals: zones and labels stay readable and update smoothly in real time.
- Flexible: works for scalping to swing trading, on any symbol or timeframe supported by cTrader.
- ✅ Best practices
- Combine SMC context with risk management and a clear playbook (entry, stop, target rules).
- Use alerts or watchlists around HTF levels and session opens for higher-quality moves.
- Always validate with market session and news calendar to avoid random volatility.
- 📌 Notes
- Visuals depend on broker data (bid feeds/sessions can vary).
- This tool is not financial advice; trading involves risk. Use on a demo account before going live.
5.0
Reviews: 1
5 | 100 % | |
4 | 0 % | |
3 | 0 % | |
2 | 0 % | |
1 | 0 % |
Customer reviews
More from this author


You may also like


.png)