NNFX TP AND SL V1.1
"NNFX TP AND SL V1.1" logo
03/09/2025
Desktop
"NNFX TP AND SL V1.1" uploaded image"NNFX TP AND SL V1.1" uploaded image"NNFX TP AND SL V1.1" uploaded image

🔹 What It Does

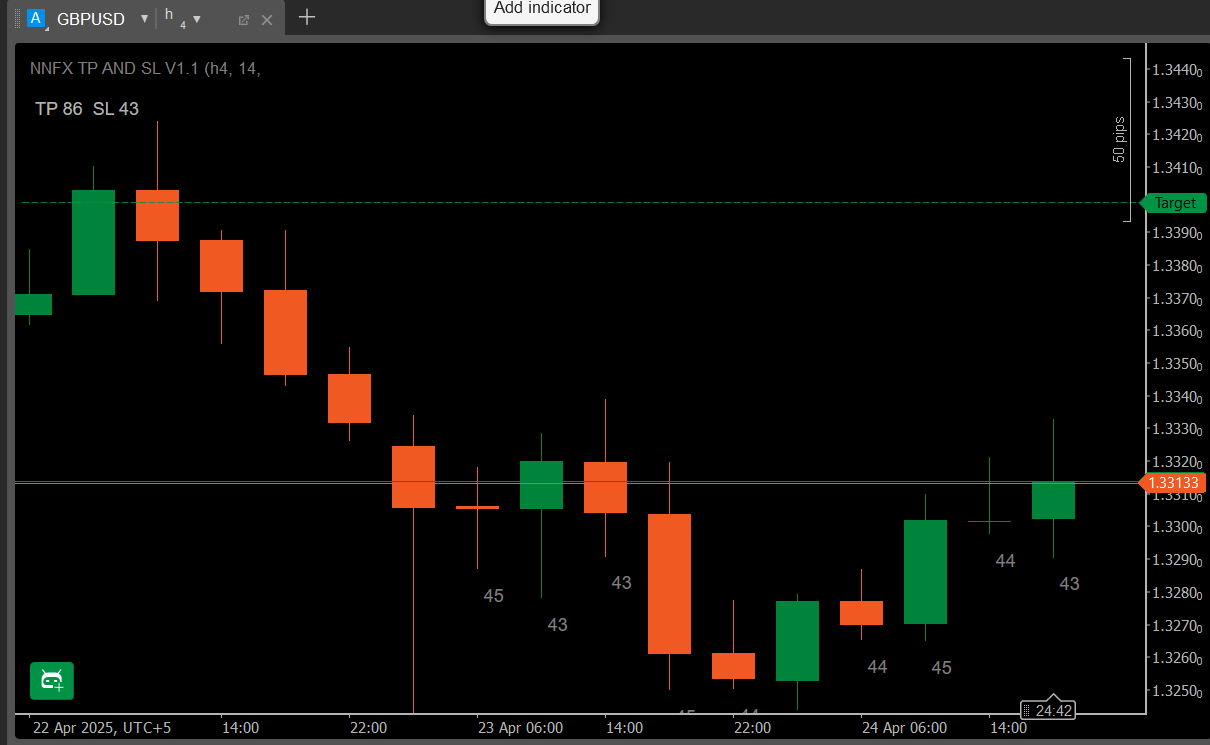
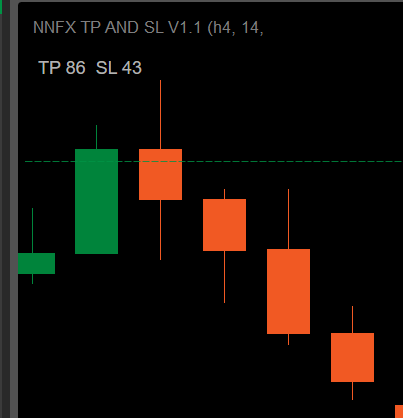
  • Dynamic Panel: Shows “TP × SL” in pips based on your chosen ATR period and TP-multiplier.
  • Last 10-Bar ATR Labels: Prints the ATR-in-pips under each of the last 10 candles (on the same timeframe).
  • Timeframe Check: If you attach it on a different chart timeframe, it warns “Timeframes do not match – ATR not shown on bars.”


🔹 Key Features

  1. Panel Display
    • TP = ATR × your Multiplier (choose 1 ÷ 4.5 in 0.5 steps)
    • SL = ATR in pips
    • Example: ATR = 43 → SL = 43 pips. If Multiplier = 2 → TP = 86 pips.
  2. Per-Bar ATR Labels
    • Underlay the last 10 bars with their ATR values in pips.
    • Keeps you instantly aware of recent volatility.
  3. Timeframe Validation
    • Only draws labels when the chart’s timeframe matches your ATR Time-frame setting.
    • Otherwise a red warning appears at the bottom.
  4. Spike Filtering (Optional)
    • Enable a mean + k·σ filter to clamp flash-crash bars.
    • Configurable σ-multiplier.


🔹 How to Install & Use

  1. Download NNFXATRInfoIndicator_v1.1.algo.
  2. In cTrader → Algo → Indicators, click Import Indicator and select the
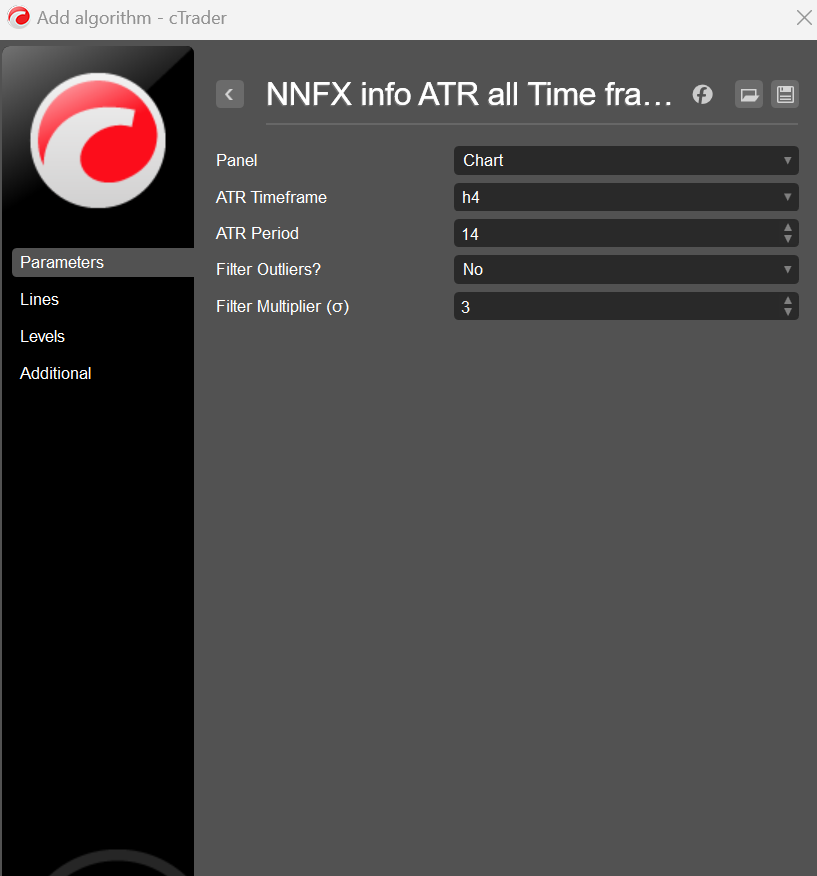
 .algo file.
  3. Add to Chart and open the Parameters tab:
    • ATR Time-frame: e.g. H4
    • ATR Period: default 14
    • TP Multiplier: 1 – 4.5
    • Use Spike Filter?: Yes/No
    • Filter Multiplier σ: default 3
  4. Click Add to Chart. You’ll see the “TP × SL” panel top-left and the last-10-bar ATR labels appear automatically (if timeframes match).


🔹 Why You’ll Love It

  • Zero Math: No more decimal-to-pip conversions—everything’s in whole pips.
  • NNFX-Ready: SL & TP sized exactly to your system’s ATR rules. You only have to choose the timeframe and the trade direction you want to trade—then simply adjust the TP Multiplier to fit your preferred risk-reward ratio.
  • Clear & Clean: All volatility info in one compact overlay—no extra panes.
  • Ultra-Flexible: Any FX pair, any timeframe, fully customizable.
  • supercharge your NNFX entries with precision ATR-based stops and targets!
0.0
Reviews: 0
Customer reviews
No reviews for this product yet. Already tried it? Be the first to tell others!
You may also like
Indicator
NAS100
NZDUSD
XAUUSD
+13
ORDERFLOW_SKIA_Plynuly
This Indicator will show you Direction, Distance, and Time;
Indicator
ZigZag
VWAP
Weis & Wyckoff System v2.0
Indicator
RSI
Breakout
XAUUSD
+6
Fair Value Gap Sessions
identify and highlight temporary market inefficiencies known as "fair value gaps" 🚨 within specific trading Sessions.
Daily Sessions HighLow Helper
Shows daily and sessions highs / lows and session boxes, everything configurable
Indicator
Breakout
Stocks
Signal
Darvas Box
The Darvas Box involves identifying "boxes" or trading ranges where a stock's price consolidates before breaking out.
Indicator
NAS100
NZDUSD
XAUUSD
+7
Bayesian Price Projection Model
Bayesian theory** to forecast a future price while providing **uncertainty ranges** that represent upper and lower bound
Indicator
RSI
Breakout
Supertrend
+1
Reactive Moving Average
Combines SMA with dynamic correlation to adapt to market trends. Adjusts sensitivity, filters noise🚀📉
SupertrendChannels
Supertrend-based channel for entries, trailing stops, and dynamic support/resistance zones.
Indicator
Indices
Prop
Stocks
+3
Smooth Heiken Ashi
The Smooth Heiken Ashi indicator is a refined charting tool designed to filter out market noise and highlight true price
Indicator
XAUUSD
Martingale
Commodities
+2
cAlgoBuddy - Zone Recovery
The Zone Recovery indicator is used in an advanced hedging strategy, opening traders in the opposite direction.
Indicator
Signal
FairValueGap-PremiumVersion1
This Fair Value Gap (FVG) indicator is a technical analysis on multi-timeframe.
Indicator
Prop
ATR
ADT_bigCandles
Outside Candle Detector: Highlights major candles/zones with ATR filter & pattern labels. By Avydel Talbo, prop trader.
Indicator
Breakout
BreakOut_Probability_Expo
Break Out Probability Experimental indicator. Credits for this indicator goes to Zeiierman !!!
Indicator
Indices
Breakout
Commodities
+3
Daily Levels
The "Daily Levels" indicator is used to display last week's and yestoday high/low price
Indicator
Signal
dark-cloud
The Dark Cloud Cover indicator detects a bearish reversal pattern, marking key candles and confirming signals based on v
Indicator
Indices
Breakout
Prop
+8
MarketRegimeAI
A cutting‑edge trading indicator that fuses AI and mathematics with adaptive logic to classify market regimes.
period seperate
daily period separate indicator.